
TRUMP
OFFICIAL TRUMP
| تریدر | نوع سیگنال | حد سود/ضرر | زمان انتشار | مشاهده پیام |
|---|---|---|---|---|
 JBPipRank: 508 | خرید | حد سود: ۸۰ حد ضرر: تعیین نشده | 10/12/2025 | |
 Crypto-by-PRIMERank: 35141 | خرید | حد سود: ۱۵ حد ضرر: تعیین نشده | 10/29/2025 |
Price Chart of OFFICIAL TRUMP
سود 3 Months :
خلاصه سیگنالهای OFFICIAL TRUMP
سیگنالهای OFFICIAL TRUMP
Filter
Sort messages by
Trader Type
Time Frame

brschultzSP500
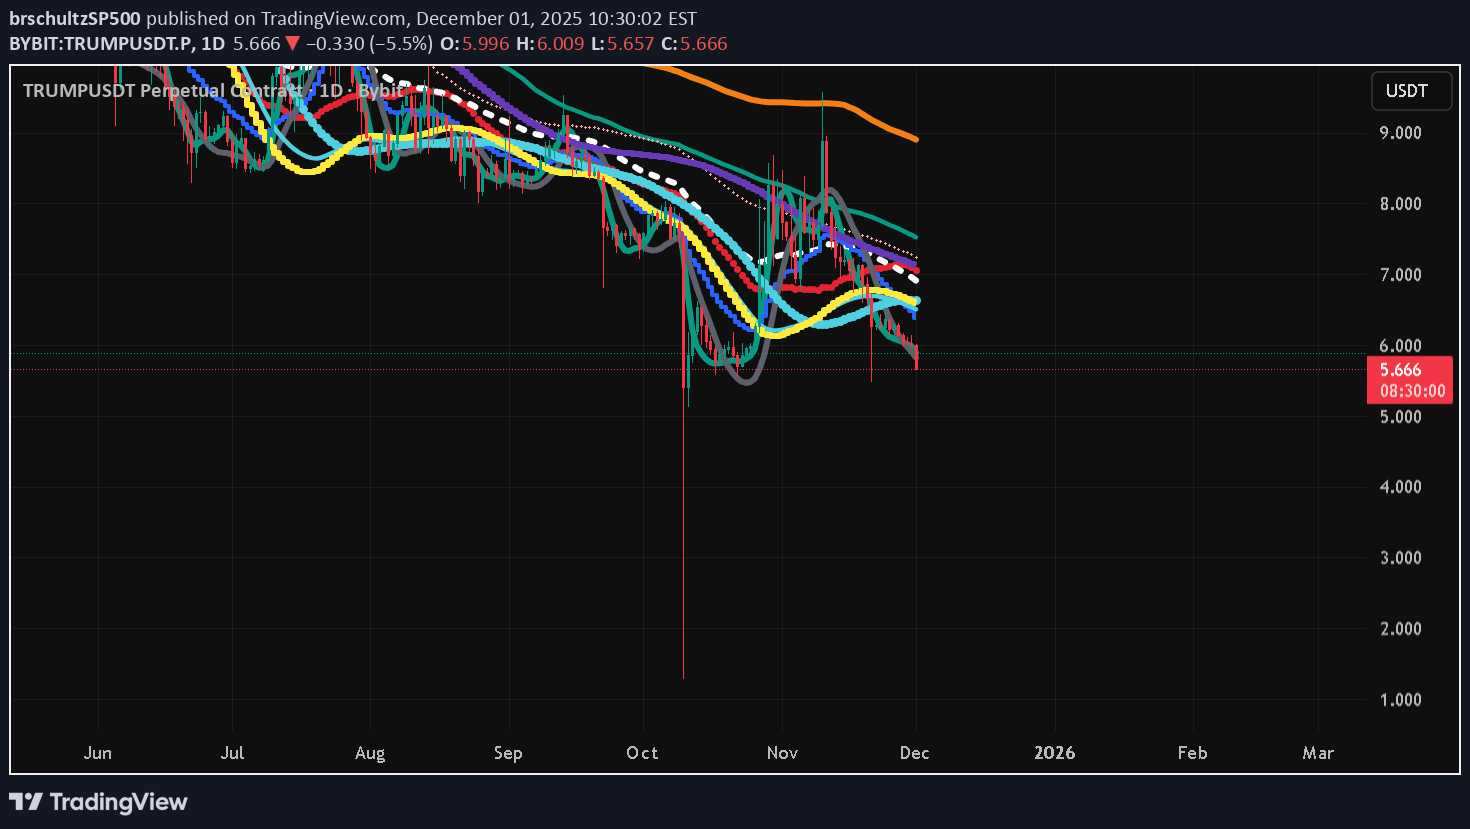

نمودار ترامپ: آیا روند صعودی ادامه دارد؟ (تحلیل تکنیکال لحظهای)
above the 50ma ++ super hormonica trend line. Can be Bull for now, join for updates ty

behdark
سقوط آزاد ترامپ کوین؛ آیا منتظر اصلاح ۹۰ درصدی دیگر باشیم؟
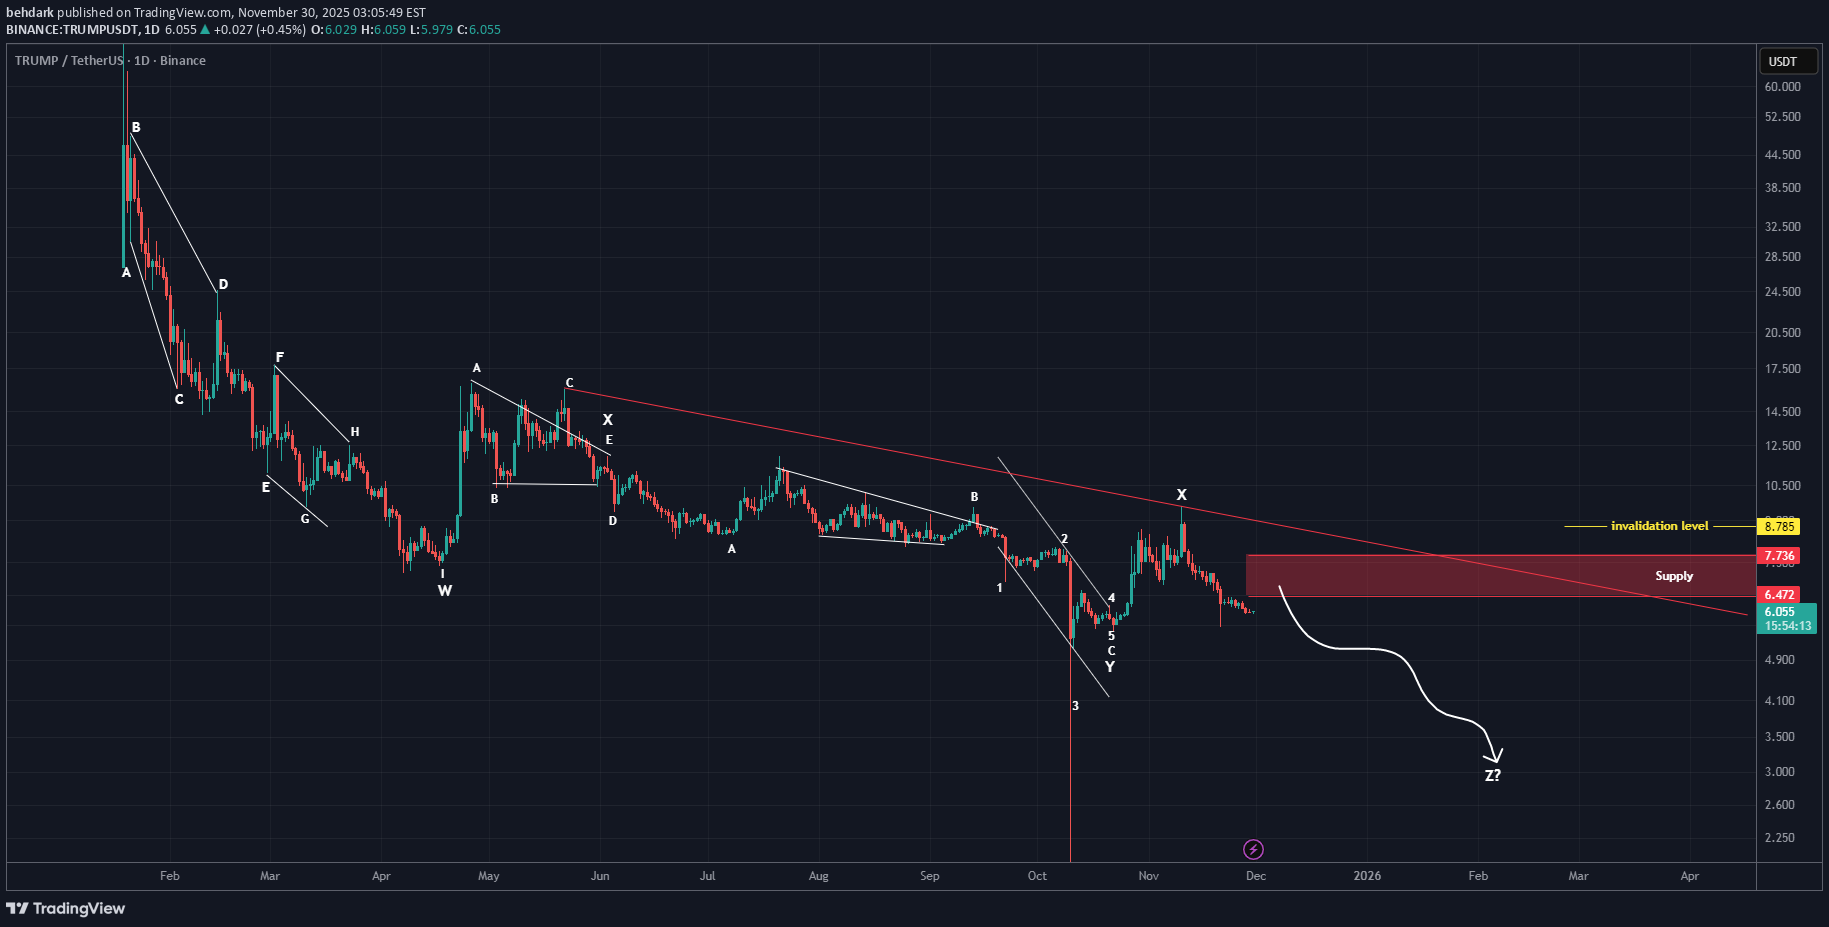
It seems to be in a triple correction, and we are currently in the second X wave. The first part was a symmetrical pattern and the second part was a zigzag, and now after the second X wave, the third correction will appear. Each correction has been strong and has caused an 80–90% price retracement, and the third part, the Z wave, can also create a deep correction. To enter a position on the hourly timeframes, you need confirmation and triggers. It appears there are many sell orders in the red zone. A daily candle closing above the invalidation level will invalidate this analysis. For risk management, please don't forget stop loss and capital management When we reach the first target, save some profit and then change the stop to entry Comment if you have any questions Thank You

KooshiCryptoGem
پیشبینی بازگشت قیمت به منطقه سبز: تحلیل موج و روش گن چه میگویند؟
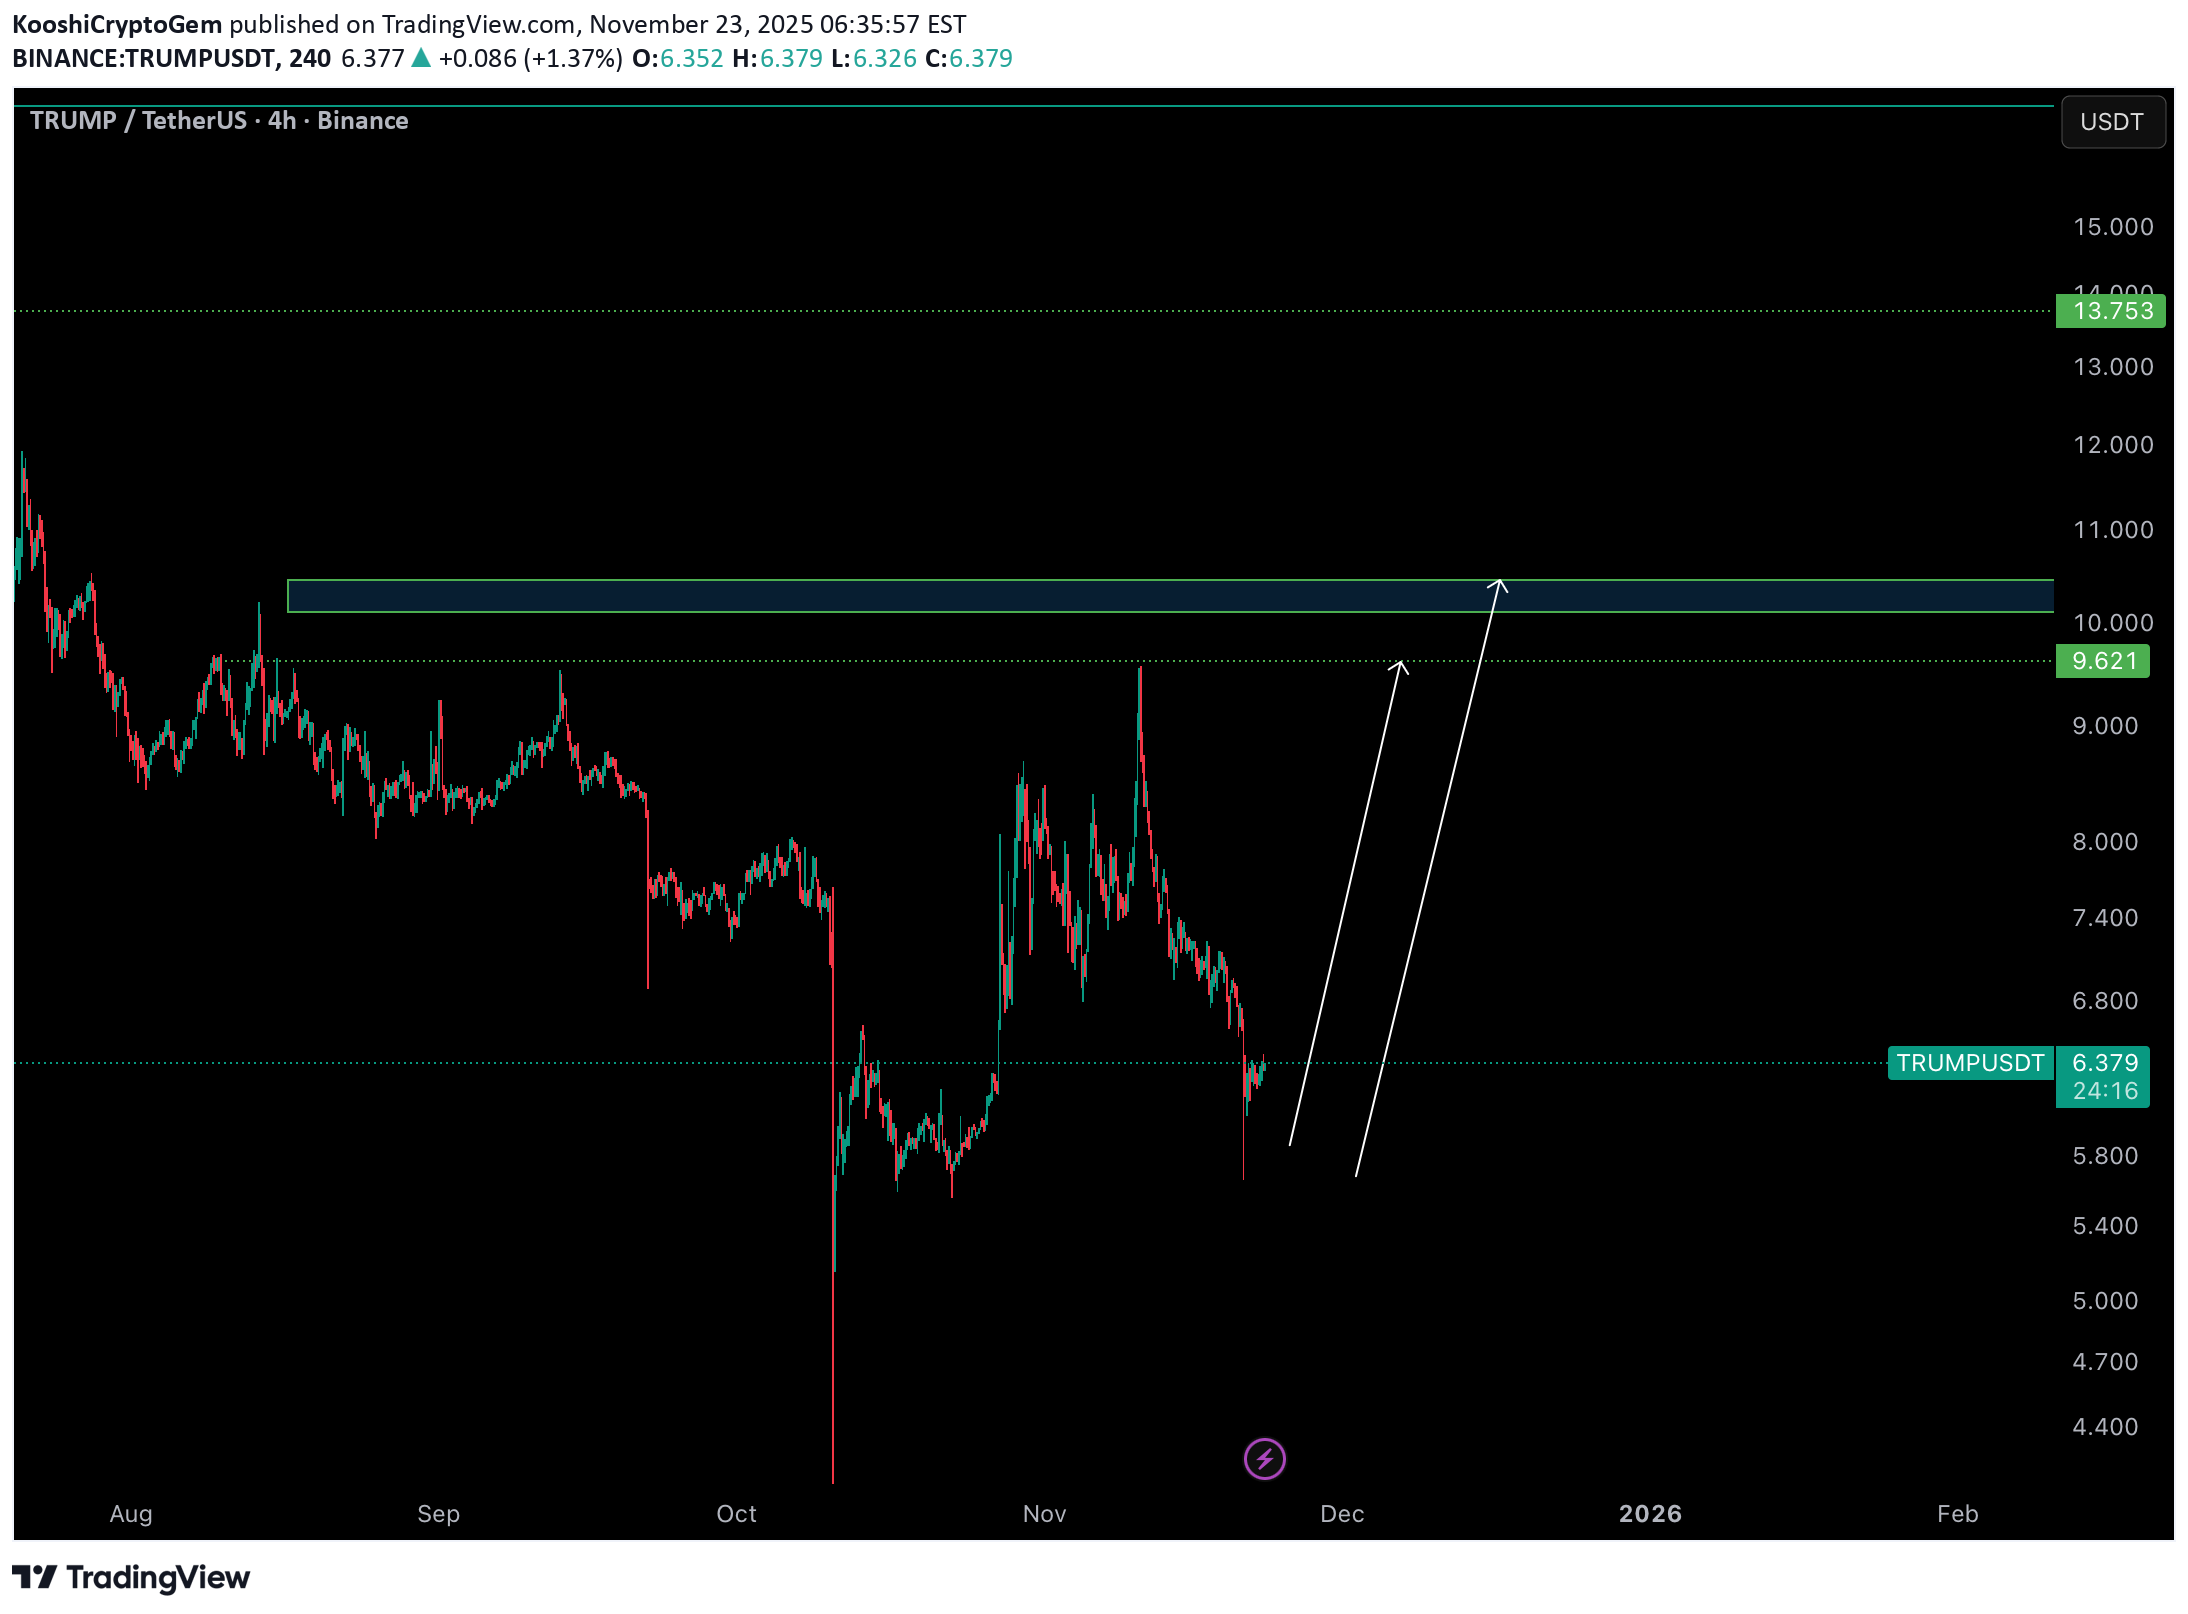
According to the analysis of the waves and the help of the Gann method, it can be expected that the price will return to the green zone again. This is my personal opinion. Please don't use it as your trading criteria. Good luck

تحلیل فوری 30 دقیقهای ترامپ: هشدار سقوط با الگوی گُوِه صعودی!
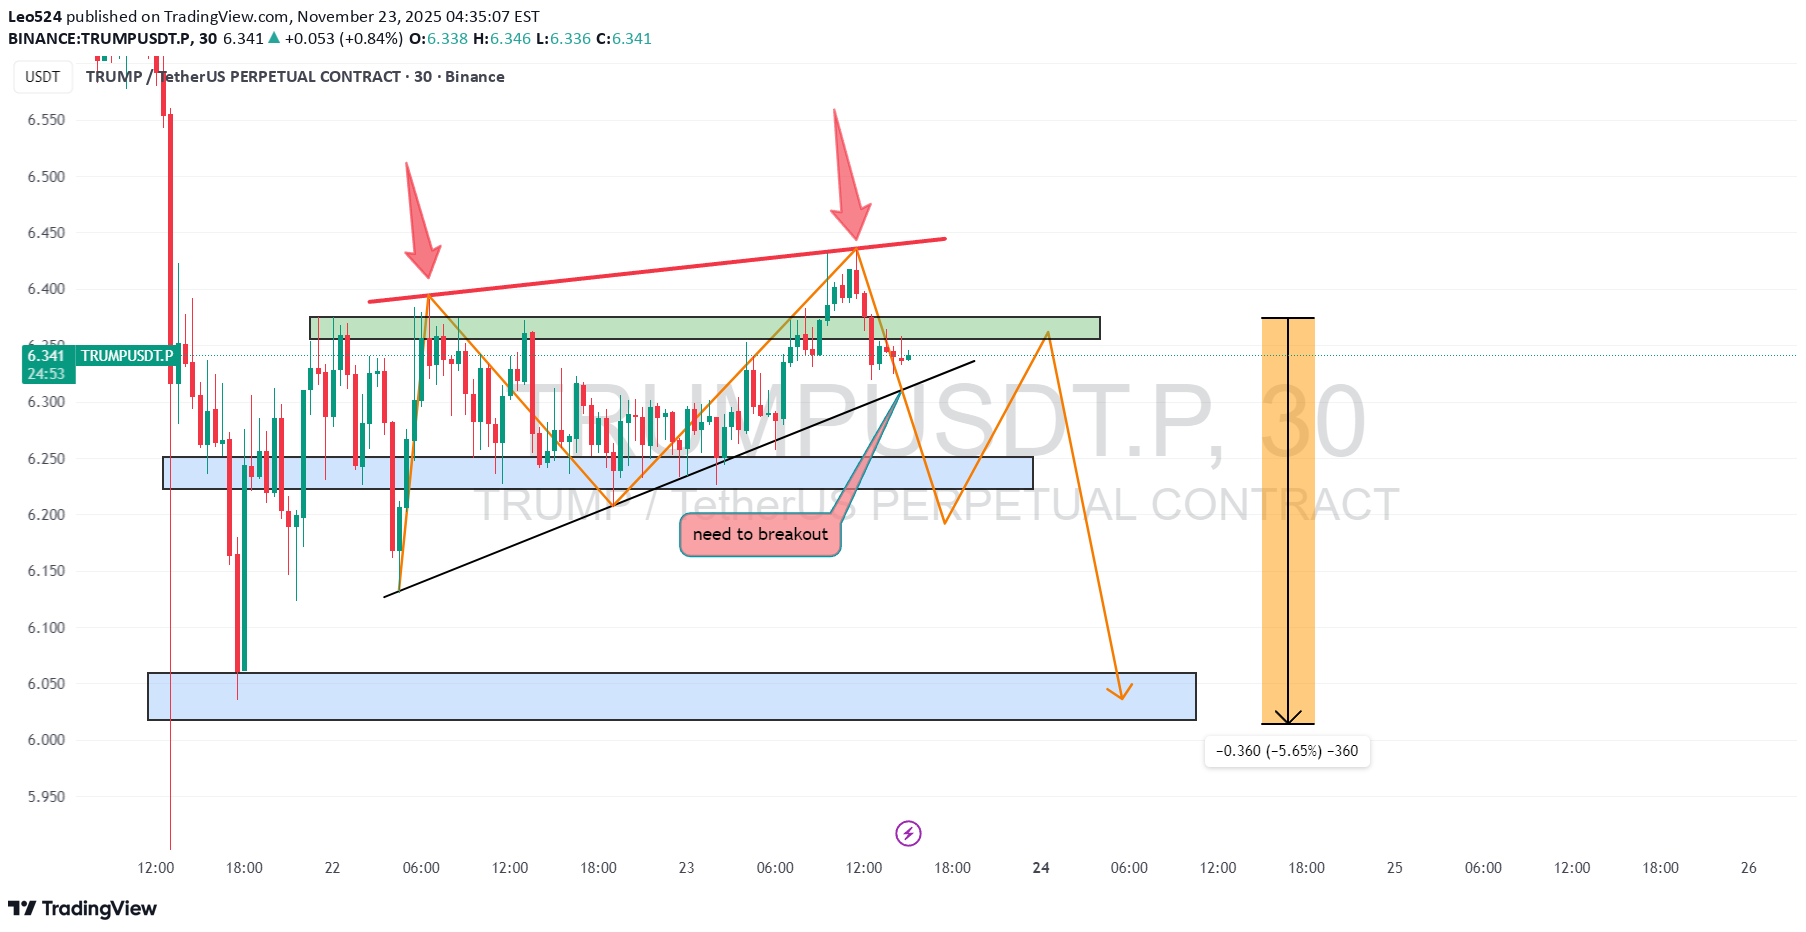
📌 $TRUMP 30 Minutes chart shows a rising wedge pattern ✅ 📌 It has not yet broken out ✅ 📌 It has been rejected by the red trend line several times ✅ 📌If this continues to reject the red trend line, and breaks down, the price will fall further 🚀🔥its dropping as i said !its dropping 6.34 to 6.1 as i said !

pullbacksignal
سیگنال فروش فوری TRUMPUSDT: نقاط ورود، حد ضرر و تارگتها بر اساس تحلیل تکنیکال
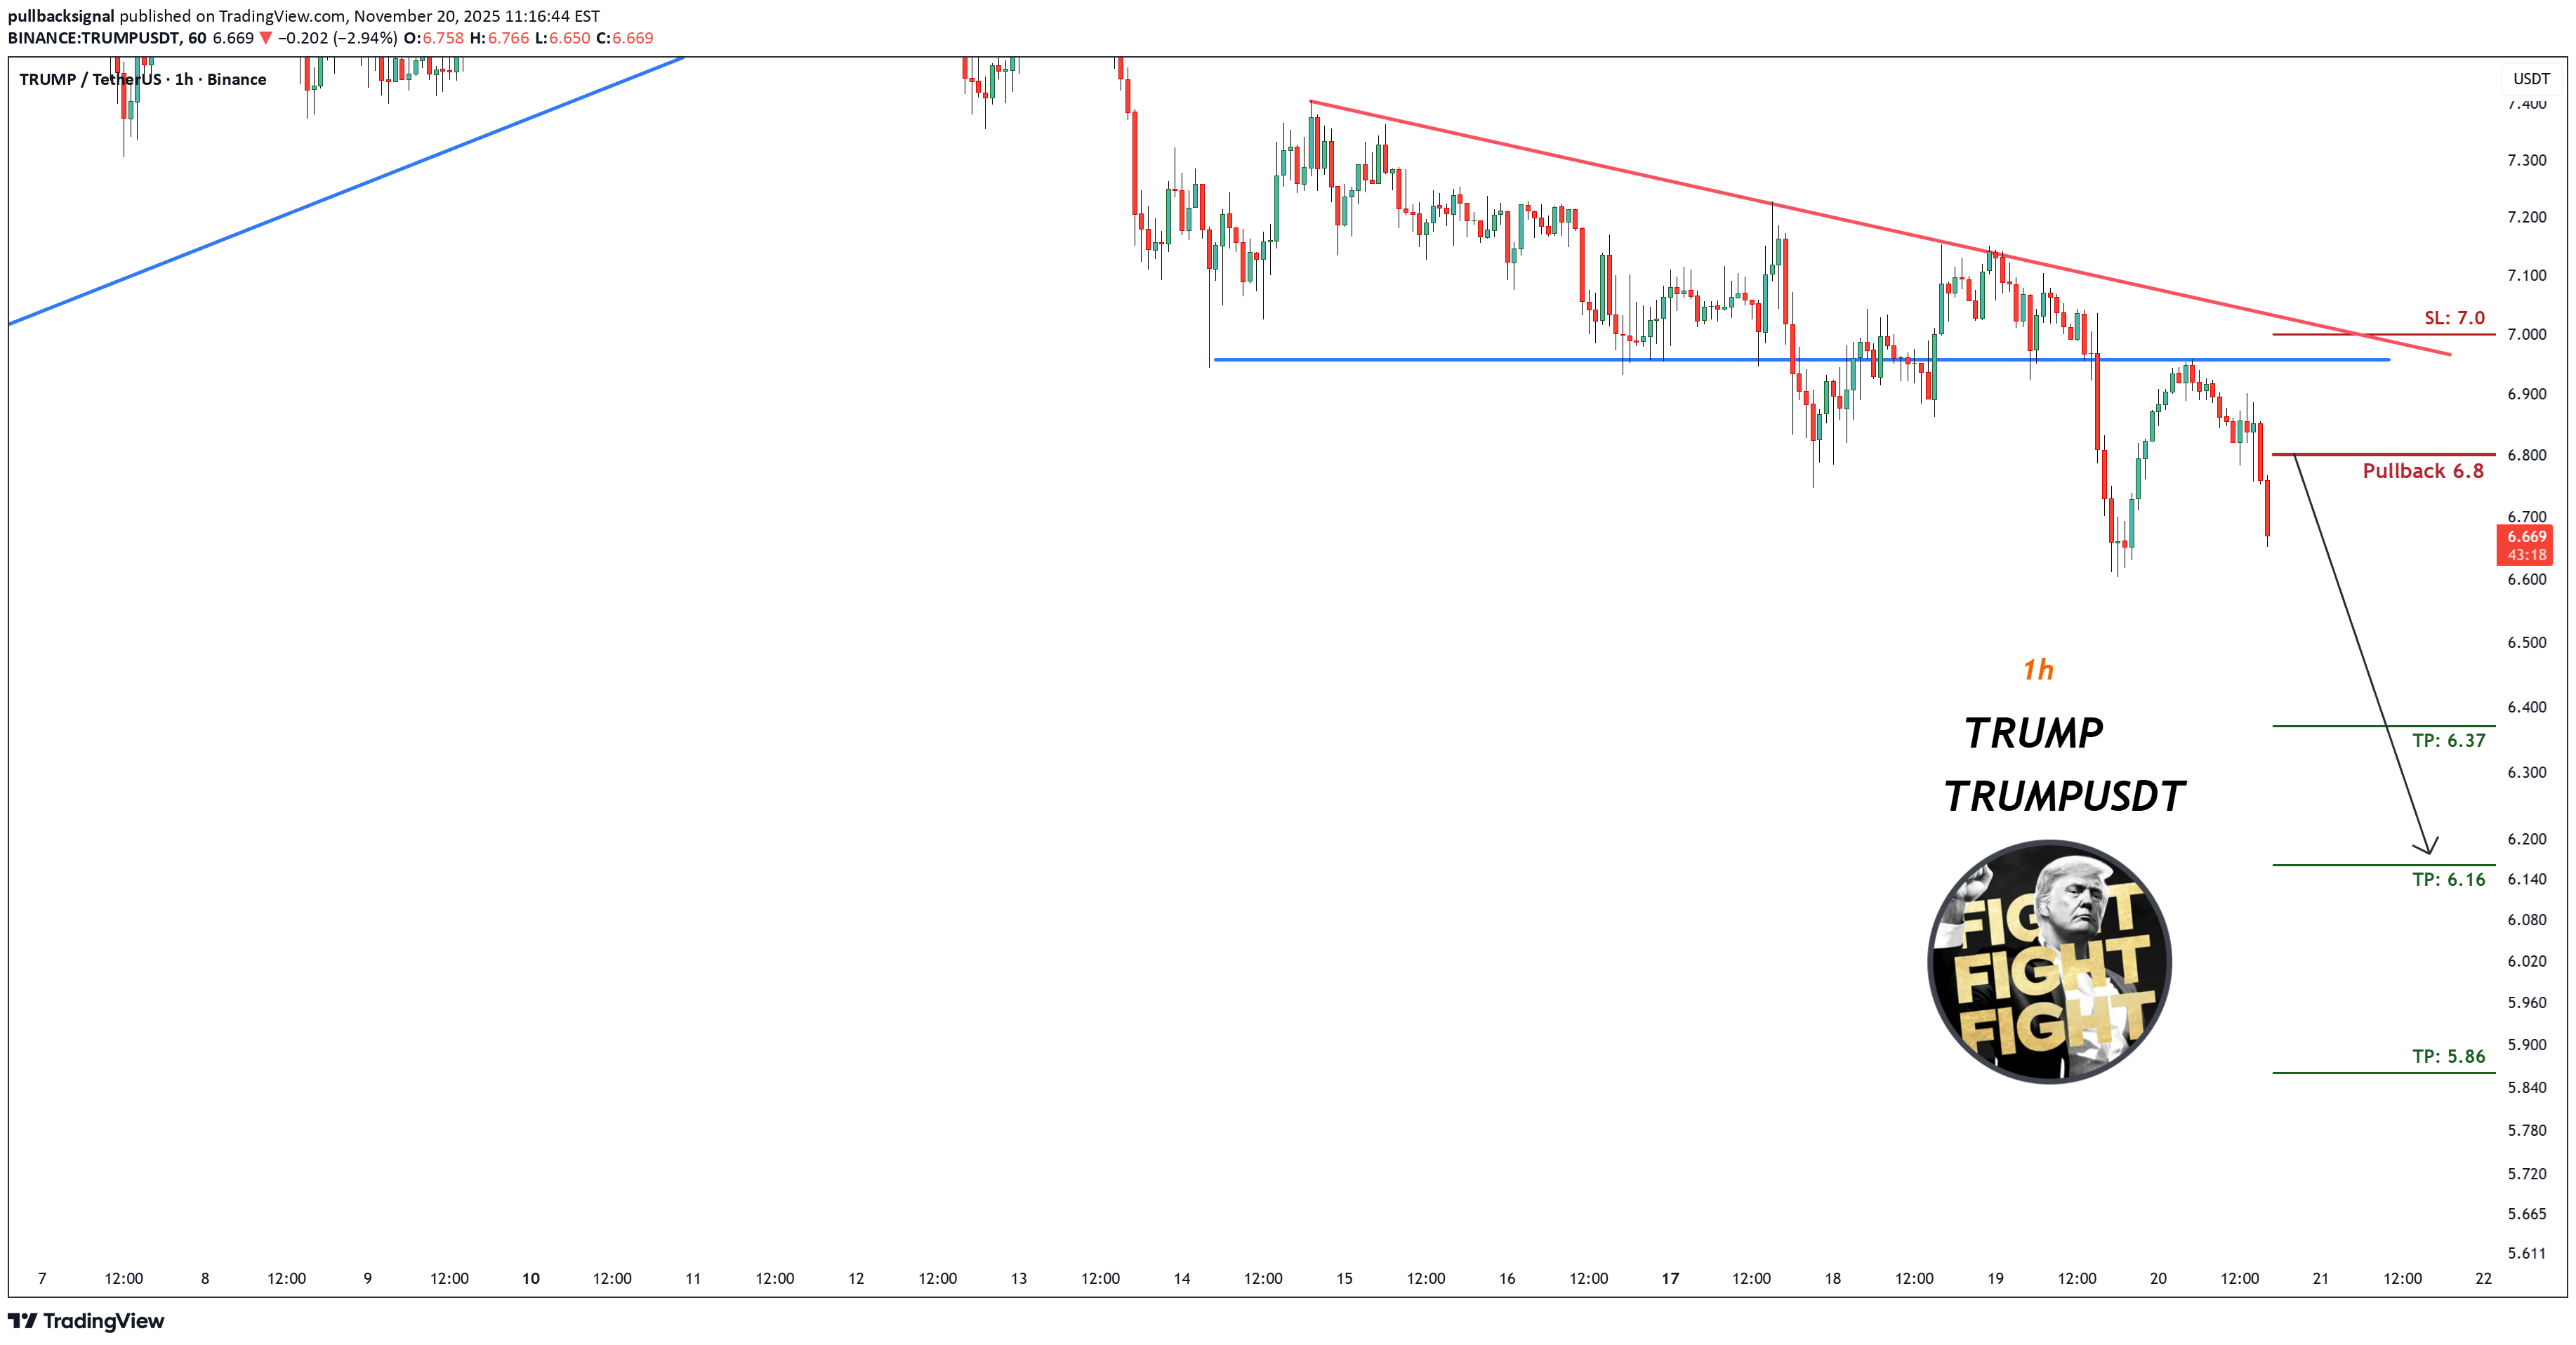
Trading Setup: There is a Trading Signal to Sell in TRUMPUSDT TRUMP (Futures) (1h) Traders can open their Sell Trades NOW ⬇️ Sell now or sell on 6.8 ⭕️SL @ 7.0 🔵TP1 @ 6.37 🔵TP2 @ 6.16 🔵TP3 @ 5.86 What are these signals based on? Classical Technical Analysis Price Action Candlesticks Fibonacci RSI, Moving Average , Ichimoku , Bollinger Bands Risk Warning Trading Forex, CFDs, Crypto, Futures, and Stocks involve a risk of loss. Please consider carefully if such trading is appropriate for you. Past performance is not indicative of future results. If you liked our ideas, please support us with your likes 👍 and comments .TRUMPUSDT TRUMP TP1 & TP2 and TP3 hit
brschultzSP500
ترامپ بازگردد، سکه او به ۱ دلار میرسد؟ نقشه بزرگ خانواده برای خرید تمام سکهها!


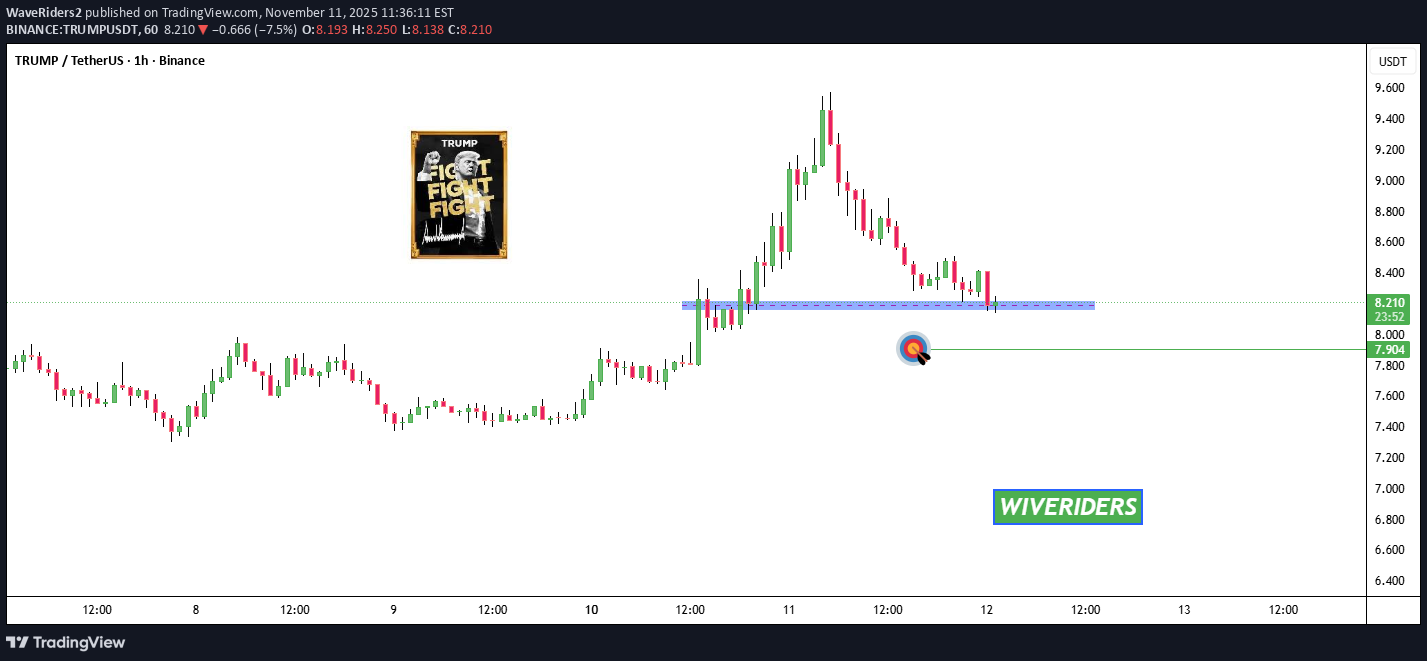
WaveRiders2

BeInCrypto
سقوط قریبالوقوع ترامپ (TRUMP) در آستانه ۲۰۲۵: آیا زمان خروج است؟
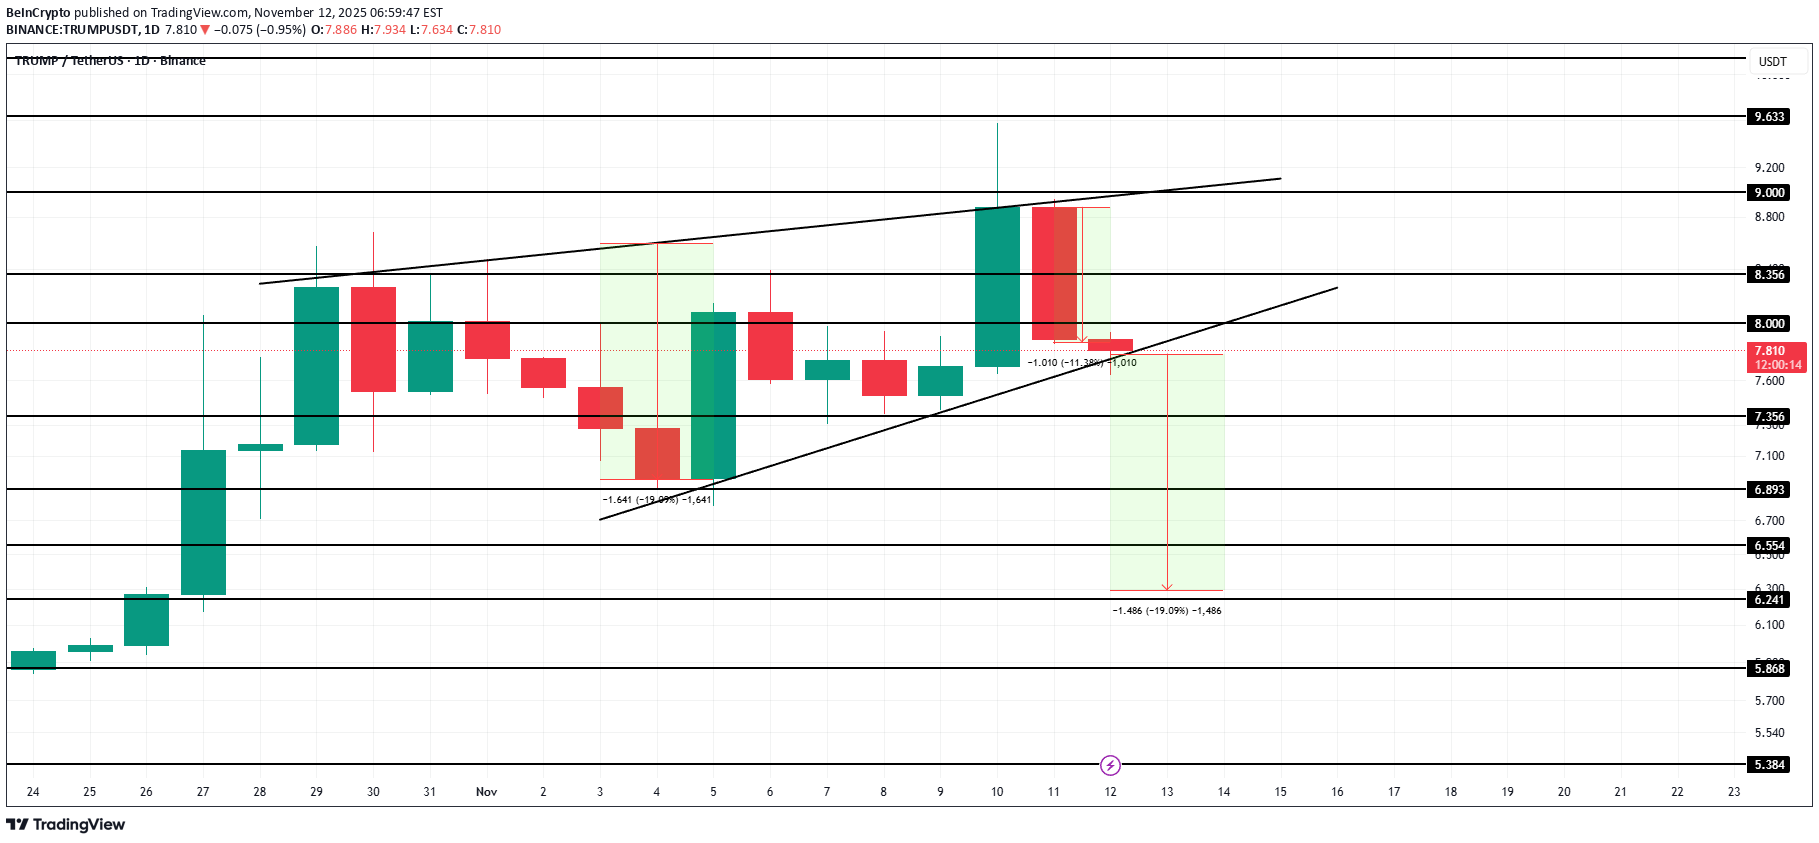
OFFICIAL TRUMP has been trading within an ascending wedge for the past two and a half weeks, sitting at $7.86. This chart formation is typically a bearish signal, often preceding downward moves. If bearish factors persist, TRUMP could break below its current threshold. Weak buying pressure may drive a 19% decline toward the $6.24 support level. Alternatively, if the CMF pattern holds, TRUMP could bounce off the lower trend line and surge past $8.36 to test $9.00. While this move would invalidate the short-term bearish outlook, the broader downtrend is still intact.
WaveRiders2
تحلیل فوری ترامپ: آیا حمایت کلیدی میشکند؟ سقوط احتمالی به کجا میرسد؟
Disclaimer
Any content and materials included in Sahmeto's website and official communication channels are a compilation of personal opinions and analyses and are not binding. They do not constitute any recommendation for buying, selling, entering or exiting the stock market and cryptocurrency market. Also, all news and analyses included in the website and channels are merely republished information from official and unofficial domestic and foreign sources, and it is obvious that users of the said content are responsible for following up and ensuring the authenticity and accuracy of the materials. Therefore, while disclaiming responsibility, it is declared that the responsibility for any decision-making, action, and potential profit and loss in the capital market and cryptocurrency market lies with the trader.