
The-Thief
@t_The-Thief

What symbols does the trader recommend buying?
Purchase History
پیام های تریدر
Filter
The-Thief
Nasdaq ETF QQQ: Liquidity Sweep Then Expansion Play
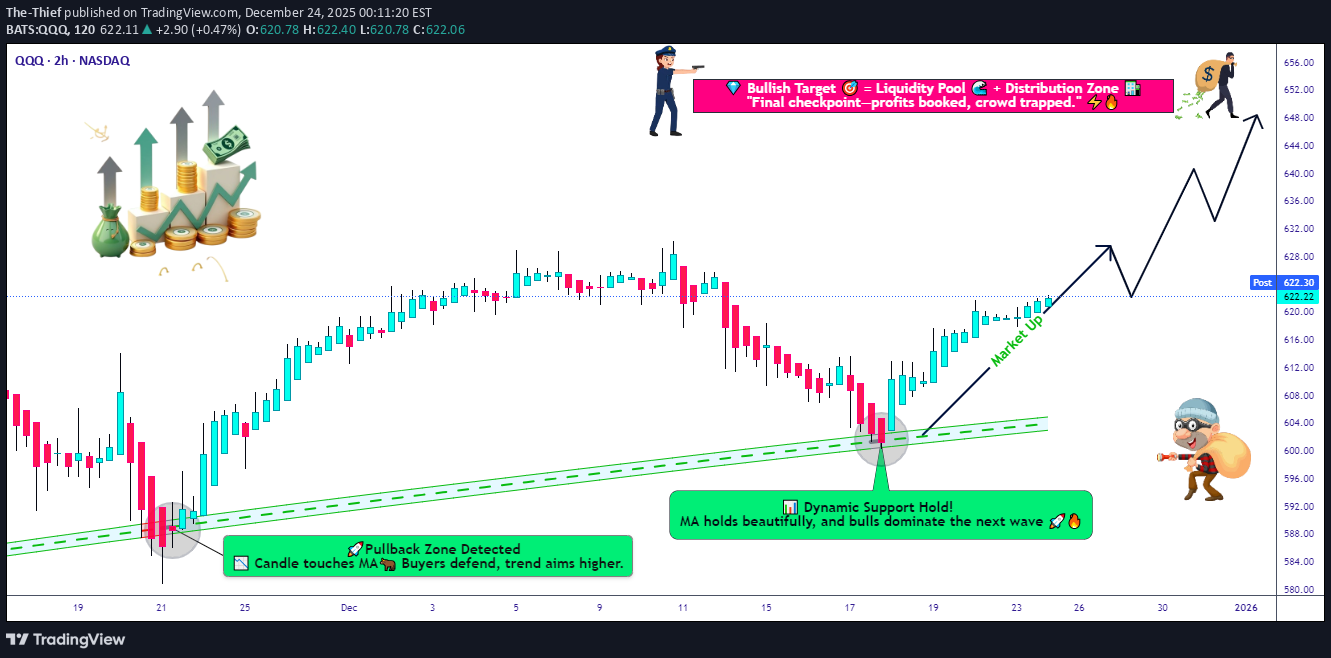
📊 ASSET DETAILS Instrument: QQQ — Invesco QQQ Trust Series Market: NASDAQ Type: ETF Trading Style: Swing Trade Bias: 🟢 Bullish 🧠 MARKET STRUCTURE & TECHNICAL CONTEXT QQQ is currently respecting a bullish market structure, supported by a triangular moving average pullback and clean retest. This behavior typically signals trend continuation, not reversal, provided key liquidity zones remain defended. 📌 Key confirmations: Higher-timeframe trend intact Price reacting positively to dynamic support Healthy pullback (not impulsive selling) Liquidity resting below current price action 🧩 TRADE PLAN — THIEF STYLE (EDUCATIONAL / ENTERTAINMENT) 🟢 Bias Bullish continuation scenario 🎯 ENTRY STRATEGY (THIEF LAYER METHOD) This plan uses a layered limit order approach, commonly known as a scaling-in / cost-averaging style entry. You may also choose any price level entry based on your own confirmation. Example Layered Buy Limits: 605.00 610.00 615.00 620.00 ➡️ You may increase or adjust layers based on your own risk profile and execution model. ⚠️ This method is designed to avoid emotional chasing and allows flexibility during volatility. 🛑 STOP LOSS (REFERENCE LEVEL) Stop Level: 600.00 📌 Note for Thief OGs: This stop level is not a recommendation. Risk management is your personal responsibility. Use your own stop logic if it better fits your strategy. 🎯 TARGET / EXIT ZONE Primary Target: 650.00 📍 Rationale: Strong resistance / supply zone Potential overbought conditions Possible liquidity trap above highs 🧠 When price reaches this zone, capital preservation > greed. Escaping with profits is always a professional move. 📌 Reminder: This target is not mandatory — partials, trailing exits, or custom targets are valid alternatives. 🔗 RELATED PAIRS & CORRELATED MARKETS TO WATCH 📈 SPY (S&P 500 ETF) Confirms broader market risk-on sentiment Strength in SPY often supports continuation in QQQ 💻 AAPL / MSFT / NVDA Heavy-weight components of QQQ Institutional accumulation in these names often leads QQQ direction 💵 DXY (US Dollar Index) Weak or sideways DXY typically supports tech strength Strong DXY may slow upside momentum 📉 VIX Rising VIX = caution Suppressed VIX supports bullish continuation ⚠️ IMPORTANT NOTES (READ BEFORE COMMENTING) This setup is educational & entertainment-based No guarantee of outcome Markets can invalidate any setup at any time Always manage risk and position size responsibly ✨ “If you find value in my analysis, a 👍 and 🚀 boost is much appreciated — it helps me share more setups with the community!” ⚠️ DISCLAIMER This is a thief-style trading strategy just for fun. Nothing here should be considered financial advice.
The-Thief
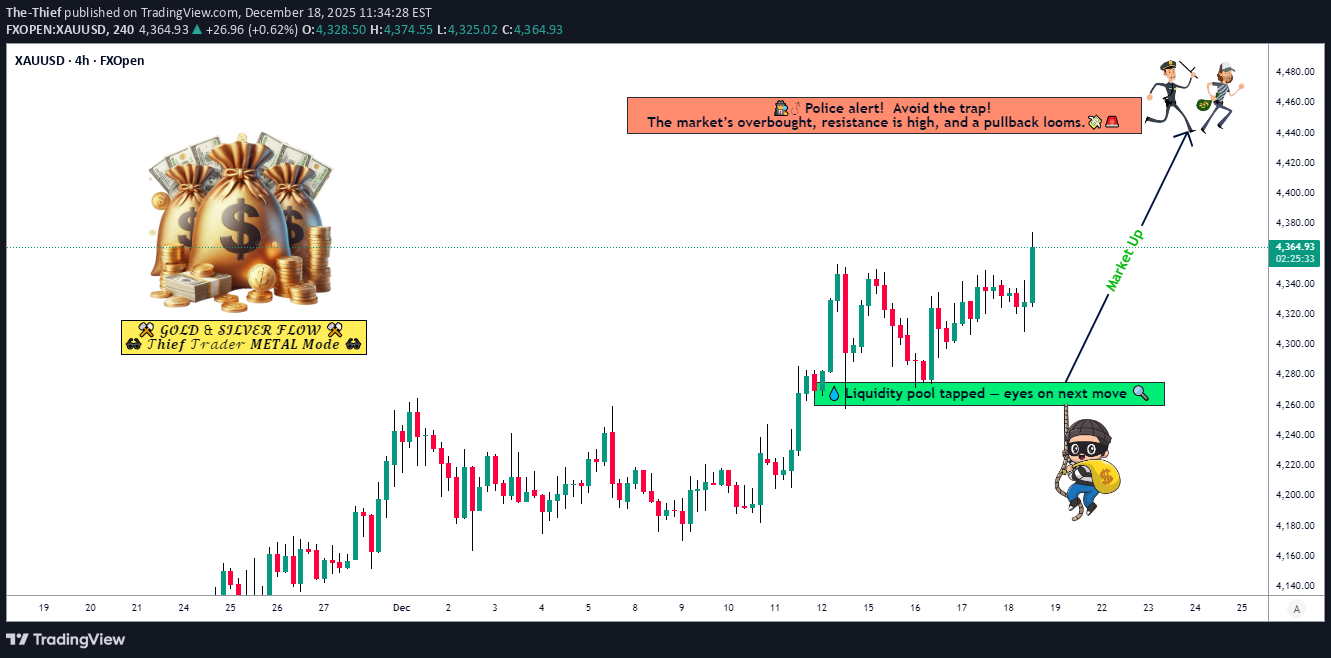
آیا خیز طلا (XAU/USD) ادامه پیدا میکند؟ برنامه خرید لایهای برای طلای داغ!
🟡 XAU/USD – GOLD vs U.S. DOLLAR Metals Market Opportunity Blueprint (Day / Swing Trade) 📈 Market Bias 🟢 Bullish Plan Active Price continues to respect higher-low structure, indicating sustained buy-side interest. Momentum remains constructive while dips are being absorbed, favoring a buy-the-dip approach rather than chasing price. 🎯 Entry Plan (Layered Buy Method) 📍 Any Price Level Entry – Layered Strategy Applied Buy Limit Layers: 4275 4300 4325 4350 🔹 Layering allows average price optimization, reduces emotional entries, and aligns with professional risk management. 🔹 You may add or adjust layers based on volatility and personal risk rules. 🛑 Risk Management Stop Loss: 4250 ⚠️ This stop level is reference-based, not mandatory. Always align SL placement with your account size, leverage, and risk tolerance. 🎯 Profit Objective Primary Target: 4550 🚨 Price is approaching a police-force zone (strong resistance area) where: Market shows overbought conditions Liquidity traps often form Corrections frequently initiate 📌 Protect profits aggressively as price approaches resistance. 🧠 Trade Notes No fixed SL or TP is recommended Partial profits are encouraged Capital protection > profit maximization 🔗 RELATED PAIRS TO WATCH (USD Correlation) 💵 DXY – U.S. Dollar Index 🔻 Inverse correlation with Gold A weaker DXY = supportive for XAU/USD upside 💵 XAG/USD (Silver) Often moves in tandem with Gold Strength in Silver confirms precious metals momentum 💵 USD/JPY Acts as a risk-sentiment proxy Yen strength often aligns with Gold demand 💵 US10Y Treasury Yields Falling yields reduce opportunity cost of holding Gold Yield weakness = bullish tailwind for XAU/USD ✅ Summary 📌 Trend Bias: Bullish 📌 Strategy: Layered Buy on Pullbacks 📌 Focus: Capital protection near resistance If you found this analysis useful, boost it with a like 👍 and follow for consistent, structured market insights. 📊 Trade safe. Trade disciplined.
The-Thief
COIN Breakdown Setup Activated — Sellers in Control!
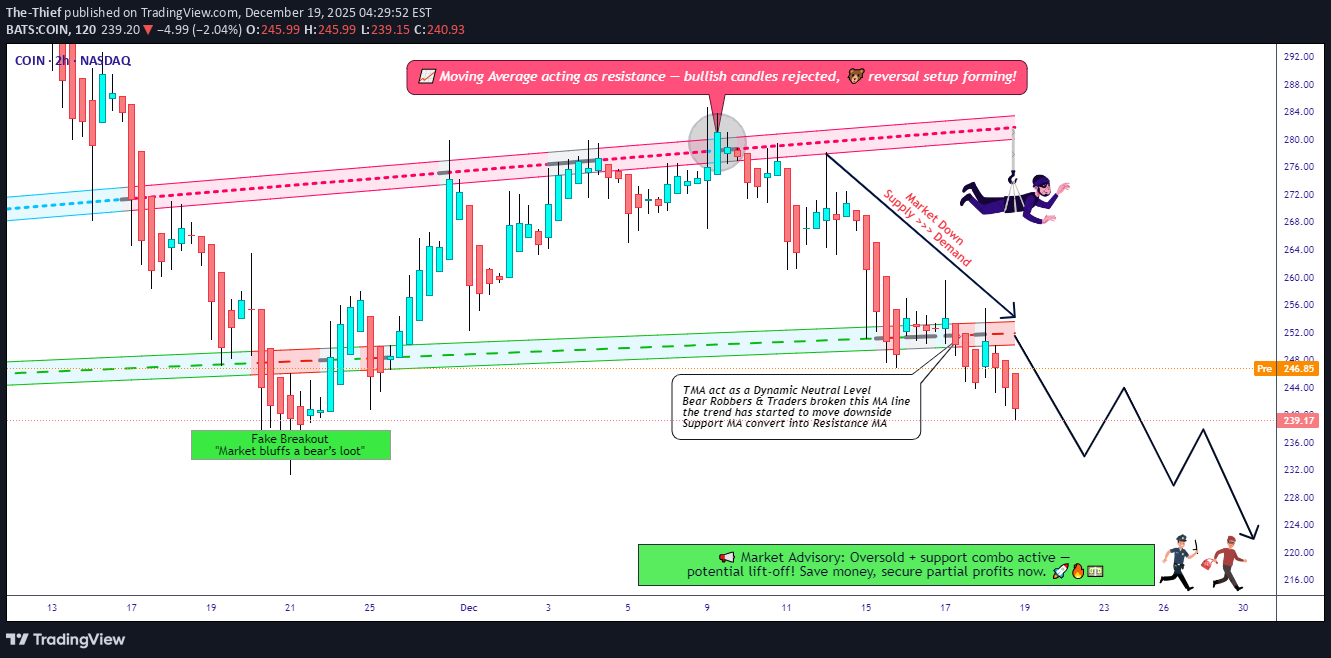
🔥 COIN Bearish Heist 🕵️♂️ | Layered Sell Strategy in Play 📊 Asset Overview COINBASE GLOBAL, INC. (COIN) 📍 NASDAQ Exchange 📈 Instrument Type: US Stock ⏱️ Trading Style: Swing Trade / Day Trade COIN is currently showing structural weakness after failing to hold key consolidation levels. Price behavior suggests distribution, not accumulation. 🧠 Technical Analysis Breakdown (Detailed) 🔻 Market Structure Price formed a symmetrical / contracting triangle Breakout occurred to the downside, confirming bearish intent Follow-through shows lower highs + weak rebounds ➡️ This indicates sellers are absorbing liquidity on every bounce. 📐 Moving Average Context Price broke below clustered moving averages MAs have shifted from support → resistance Compression + expansion = volatility release 📉 When moving averages fail together, continuation risk increases. 📊 Momentum & Price Action Bearish candles with long upper wicks Failed recovery attempts = supply dominance No strong bullish displacement after the breakdown ➡️ This favors sell-on-rally, not buy-the-dip behavior. 🎯 Trading Plan — Thief Style (Layering Strategy) Instead of predicting the exact top, this plan uses multiple limit sell orders to build a position gradually as price reacts into resistance zones. 🕵️♂️ Entry Philosophy: No single “perfect” entry Scale in calmly Let price come to you 🔴 Sell Limit Layer Zones (Example) 256.00 250.00 248.00 240.00 📌 These zones align with: Prior structure resistance MA rejection areas Liquidity grab zones ➡️ You may add or reduce layers based on your execution model. 🛑 Risk Management (Expanded) Reference Stop Loss: 265.00 This level represents: Triangle invalidation Failed bearish structure Strong bullish reclaim zone ⚠️ Important Note to Thief OGs: This stop is not mandatory. You control: Position sizing Risk per layer Partial exits or full invalidation Trade responsibly and within your system. 🎯 Target Logic (Why 220.00?) Target Zone: 🎯 220.00 This area is supported by: Major historical demand Oversold technical conditions Correction completion zone Possible bear trap resolution 💨 Execution Style: Fast profit-taking No greed Exit when liquidity is offered 🚨 Escape quickly before volatility reverses. 🔗 Related Symbols to Watch (Correlation Insight) Watching correlated assets improves timing and confidence: BTCUSD 🟠 ↳ Strong correlation with COIN direction and sentiment ETHUSD 🔵 ↳ Confirms crypto market risk appetite NASDAQ 📊 ↳ Tech stocks weakness = pressure on COIN MSTR 🧠 ↳ High-beta crypto equity, often moves first 📌 If BTC + NASDAQ show weakness, COIN downside probability increases. 🧠 Key Execution Rules ✅ Trade the structure, not emotions ✅ Layer entries, don’t chase ✅ Respect invalidation ✅ Take profits quickly at target ✅ Risk management > prediction ✨ “If you find value in my analysis, a 👍 and 🚀 boost is much appreciated — it helps me share more setups with the community!” 📢 Disclaimer: This is a thief-style trading strategy just for fun. Educational & entertainment purposes only — not financial advice. #COIN #Coinbase #NASDAQ #BearishSetup #SwingTrade #DayTrade #TechnicalAnalysis #LayeredEntry #RiskManagement #PriceAction #MarketStructure #TradingView
The-Thief
META Momentum Builds! Bullish Swing Trade Roadmap
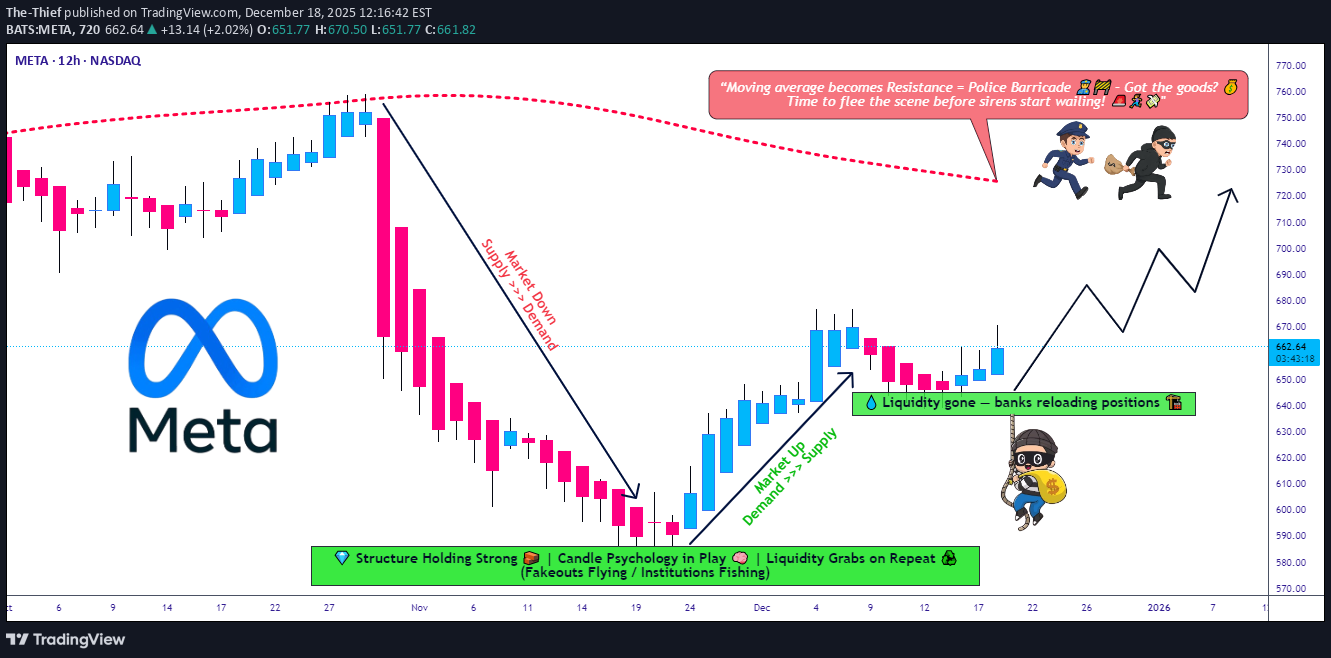
🚀 META: The Layered Entry Swing Play - AI Momentum Revival 📈 Executive Summary 💼 META Platforms sits at a pivotal technical juncture where institutional AI capex demand collides with short-term profit-taking. This swing trade targets the $720 resistance breach using a disciplined layered entry methodology — perfect for risk-managed traders seeking 3-5% upside with controlled downside. 📊 Trade Setup | Master Plan Asset: 🔵 META (NASDAQ) | Meta Platforms, Inc. Timeframe: Swing Trade (4-6 weeks) Bias: 🟢 BULLISH (Support Zone Recovery) Risk Appetite: Moderate to Aggressive 🎯 Entry Strategy | The Intelligent Layering System Rather than chasing a single entry price, we employ a pyramiding buy-in method across key support zones. This reduces emotional trading and improves risk-reward at scale. Multi-Layer Entry Points (Buy in Tranches): Layer 1 (Initial Position): $638.50 — 2% account risk Layer 2 (Dip Catch): $630.00 — 2% account risk Layer 3 (Strength Reload): $650.00 — 2% account risk Layer 4 (Breakout Confirmation): $660.00 — 1.5% account risk Total Allocation: ~7.5% per full setup (adjust per your risk tolerance) Rationale: Layering avoids the emotional cost of "missing" an entry and distributes your execution cost—professional traders call this dollar-cost averaging on entries. 🛑 Stop Loss | Discipline Wins Wars Hard Stop: $610.00 Reasoning: Below this level, the daily chart's support at the 200-EMA fails. Loss = ~4-5% from average entry ($645), which is reasonable swing risk. ⚠️ DISCLAIMER: This stop-loss level is MY analysis only. You remain fully responsible for your risk. Consider your account size, leverage, and emotional tolerance before committing capital. Never risk more than 2% per trade. 🎪 Target Strategy | Know When to Take Profits Primary Target (Resistance Police Force): 📍 $720.00 Why $720 Matters: 328-Period SMA (4-hour chart) typically acts as resistance during consolidated ranges Overbought Territory Signal: RSI creeping above 70 = profit-taking zone Technical Trap Warning: Large sellers often cluster here after gaps up Psychological Level: Round numbers ($720) trigger algorithmic selling Escape Plan: When price approaches $720, take 50% off the table to lock profits. Let remaining 50% run with a trailing stop at +3% below entry. ⚠️ DISCLAIMER: This target is NOT guaranteed. META could face: regulatory headwinds, macro rate shock, or competitor moves. You decide your exit—never marry a target. Protect your capital first. 📡 Related Pairs to Monitor (Correlation Watch) 🔗 1️⃣ GOOG (Google / Alphabet Inc.) — POSITIVE CORRELATION (+0.82) Key Insight: Both compete in AI advertising and data-center infrastructure. If GOOG rallies, META usually follows. Watch: GOOG breaks above $200 = risk-on sentiment for META. 2️⃣ TSLA (Tesla, Inc.) — MODERATE POSITIVE CORRELATION (+0.71) Key Insight: Both are "mega-cap AI/Tech bets." TSLA weakness can drag META down (flight to safety). Watch: TSLA support breaks = potential META correction into your layers. 3️⃣ AMZN (Amazon.com) — POSITIVE CORRELATION (+0.76) Key Insight: AWS AI infrastructure play; if AMZN capex concerns flare, META suffers (shared narrative). Watch: AMZN guidance = signal for META's data-center spend outlook. 4️⃣ SPY (S&P 500 ETF) — MODERATE CORRELATION (+0.68) Key Insight: Macro beta. Fed rate decisions move SPY; SPY moves all mega-caps. Watch: CPI data Dec 18, 2025 at 8:30 AM ET = critical catalyst. 5️⃣ VIX (Volatility Index) — NEGATIVE CORRELATION (-0.55) Key Insight: Rising VIX = fear. META can gap down on broad market panic. Watch: VIX above 20 = consider tightening your stop or waiting for another layer signal. 💡 Key Technical Confluences ✅ Why This Setup Works: Layered entries = you're never "too early" or paying too much 52-week range sits between $480–$796 (META has room to $720) 📈 Analyst consensus = "Strong Buy" with targets ~$832 median AI capex narrative = earnings growth driver into Q1 2026 Dividend pay date Dec 23 = pre-holiday consolidation likely ❌ Risks to Abort: Breaking below $610 = trade is invalid; exit immediately Regulatory shock (FTC enforcement) = gap down risk Macro CPI shock Dec 18 = volatility surge, potential liquidation Competitive loss to GOOG/AMZN AI = narrative reversal 📈 Risk Management Checklist Before you trade this setup: Do you understand layering reduces timing risk? ✅ Is your stop at $610 within your risk tolerance? ✅ Have you calculated max loss? (e.g., 7.5% × 2% per layer = ~$150 per $1000 risked) ✅ Is $720 target realistic in 4-6 weeks? (YES—analyst upside + technical confluence) ✅ Will you stick to your exit plan, or will greed override? ⚠️ (This is the real test!) 🎬 Action Plan | Execution Timeline Week 1 (Dec 18–22): Place Layer 1 & 2 buy orders. Watch CPI data (Dec 18, 8:30 AM ET). Week 2–3: Scale into Layers 3 & 4 on any dips. Monitor GOOG/AMZN correlation. Week 4–6: Approach $720; take 50% profit at resistance. Manage trailing stop on remainder. Exit Plan: TP hit = reduce risk. SL hit = accept loss, move on. No "hope trading." 📝 Disclaimer & Fun Caveat 🎭 This is a "playful but serious" swing-trade idea. It's designed for entertainment AND education—think of it as how a mischievous but disciplined trader (our "thief trader OG") approaches META with style, humor, and risk management. ✨ Closing Thought If you find value in this analysis, a 👍 and 🚀 boost is much appreciated — it helps me share more setups with the community! #META #SwingTrade #TechStocks #AITheme #LayeredEntry #TradingView #StockMarket #NASDAQ #Bullish #MoneyManagement #RiskManagement #ProfitTaking #TechnicalAnalysis #StockAnalysis #TradeSetup #LongBias #2025Trading
The-Thief
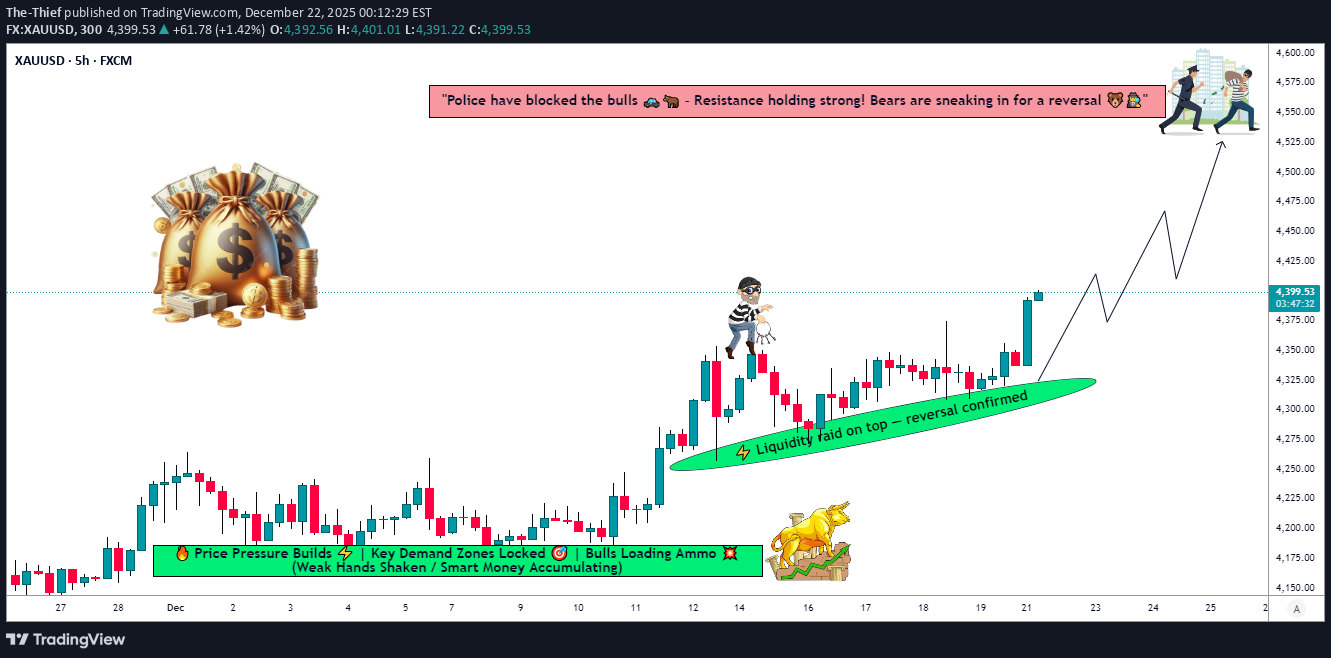
XAU/USD Bullish Setup | Smart Money Still Supporting Gold
🟡 Asset XAU/USD — GOLD vs U.S. DOLLAR Metals Market Opportunity Blueprint (Day Trade) 📈 Market Plan 🟢 Bullish Bias Active Gold continues to show strong bullish structure, supported by sustained buying pressure and safe-haven demand. Momentum remains intact until major resistance is reached. 🎯 Entry Strategy 🛒 Buy at any price level (Traders may scale entries based on personal strategy, confirmation, or risk model.) 🛑 Stop Loss ⚠️ This is thief SL @ 4250 Dear Ladies & Gentleman (Thief OG’s), I am not recommending you to use only my SL. Risk management is your responsibility — trade based on your own plan. 🏁 Target Zone 🎯 Target @ 4450 Strong resistance zone Overbought conditions likely Bull trap & correction risk increases here 📌 Kindly secure profits near this zone if price shows rejection. ⚠️ Important Risk Note Dear Ladies & Gentleman (Thief OG’s), I am not recommending you to use only my TP. Market behavior decides — protect capital and manage profits wisely. 🔗 RELATED PAIRS & CORRELATION TO WATCH ($-Based) 💵 USD Index (DXY) Inverse correlation with Gold Weak USD = bullish fuel for XAU/USD Strong USD rallies may slow gold upside 🟡 XAG/USD (Silver) Strong positive correlation with Gold Silver strength often confirms gold continuation Divergence may warn of short-term exhaustion 🇺🇸 US10Y / US Treasury Yields Rising yields = pressure on gold Falling yields = supportive for bullish gold flows 📊 SPX / NAS100 (US Indices) Risk-off sentiment boosts gold demand Equity pullbacks often coincide with gold strength 💱 EUR/USD Dollar-driven pair EUR/USD strength often aligns with XAU/USD upside due to USD weakness 🧠 Key Takeaway Gold remains bullish until proven otherwise, but 4450 is not a buy zone — it’s a decision zone. Trade smart, protect profits, and let price confirm the next move. 💬 If this idea adds value, drop a like 👍, comment your view, and follow for consistent market blueprints.
The-Thief
برنامه دو مرحلهای اپل (AAPL): فروش در اوج و خرید در ساختار!
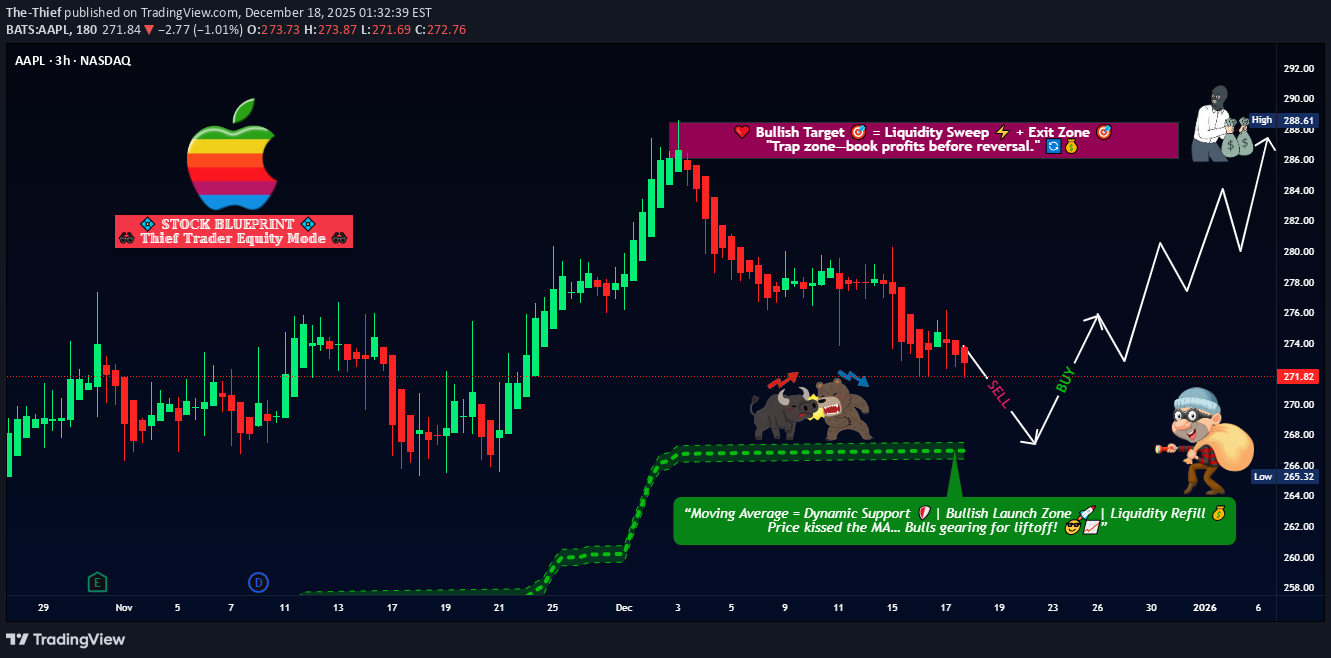
🍎 ASSET OVERVIEW Asset: AAPL — Apple Inc. Exchange: NASDAQ Style: Swing Trade Market Context: Extended price action near resistance with overbought signals, followed by potential mean reversion toward moving average structure. 🧠 MARKET PLAN (PROFESSIONAL + FUN VIBE) 📉 PHASE 1 — SHORT-TERM BEARISH BIAS Price is currently overextended, sitting near a strong resistance zone with signs of buyer exhaustion. Overbought conditions ⚠️ Resistance + liquidity trap potential Expectation: Pullback toward the moving average 📈 PHASE 2 — STRUCTURED BULLISH PULLBACK After the retracement, trend continuation is possible if price respects the dynamic moving average support near 267.00. This is a two-scenario plan, not prediction — react, don’t predict. 🎯 EXECUTION LEVELS 🔴 Entry (Bearish Leg) Sell: Current price zone (into resistance / overextension) 🟢 Buy Zone (Bullish Pullback) Buy: Near Moving Average Support @ 267.00 🛑 RISK MANAGEMENT (ADJUSTABLE) Bearish Stop Loss: @ 278.00 Bullish Stop Loss: @ 260.00 ⚠️ Dear Ladies & Gentlemen (Thief OGs) These stop levels are reference points only. Risk management is personal — adjust position size and stops based on your own strategy and risk tolerance. 🎯 TARGETS 📉 Bearish Objective Target: Near Dynamic Moving Average Support @ 267.00 📈 Bullish Continuation Objective Target: 288.00 🚨 Strong resistance + prior overbought zone suggests partial profit booking is smart. Market gives, market takes — protect gains. ⚠️ Dear Ladies & Gentlemen (Thief OGs) These targets are not mandatory — manage profits at your discretion. 🔗 RELATED PAIRS & CORRELATED WATCHLIST Keeping an eye on correlated instruments can confirm or invalidate this setup: NDX / NAS100 📊 Apple is a heavyweight — weakness or strength here directly impacts AAPL momentum. SPX / SPY 🏦 Broad market risk sentiment helps confirm pullback sustainability. QQQ 🚀 Tech ETF correlation — divergence may signal early reversal or continuation. MSFT & NVDA 🧠 Relative strength comparison within mega-cap tech. 🧩 KEY TAKEAWAYS Trade the reaction, not emotions Respect moving average dynamics Scale wisely, protect capital No single bias — adapt with structure ✨ “If you find value in my analysis, a 👍 and 🚀 boost is much appreciated — it helps me share more setups with the community!” ⚠️ DISCLAIMER This is a thief-style trading strategy just for fun 🎭 Educational & entertainment purposes only — not financial advice. Always do your own analysis and manage risk responsibly. #AAPL #Apple #NASDAQ #SwingTrading #Pullback #MovingAverage #PriceAction #MarketStructure #RiskManagement #TraderCommunity #TechnicalAnalysis #Stocks #USMarkets #TradingView
The-Thief
مکدونالد (MCD): آیا آماده جهش بزرگ معاملاتی از سطح ۳۲۰ دلار است؟
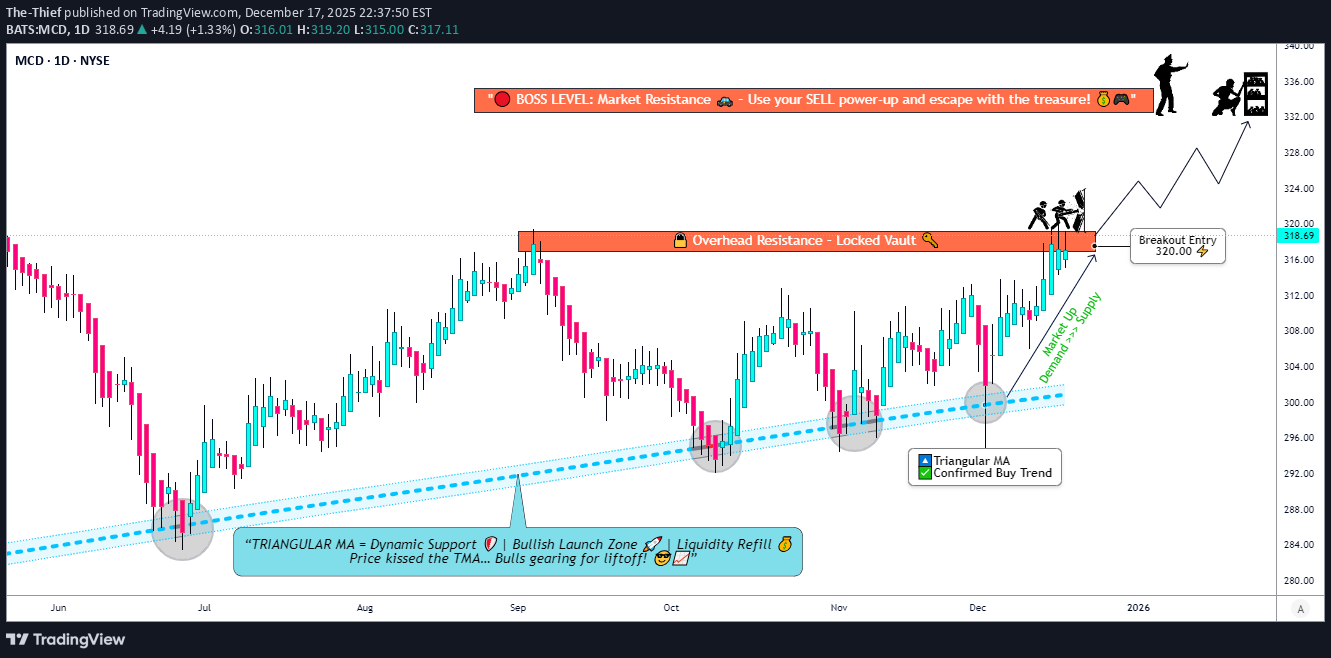
MCD Bullish Pullback Heist 🍔📈 | 320 Break = Green Lights? 🍔 MCD — McDonald’s Corporation (NYSE) Stock Market Profit Playbook | Swing Trade Setup This is my original technical idea, built on price structure, trend behavior, and momentum context — presented in a clean, TradingView-friendly style with a touch of Thief OG fun 😎 🧠 Market Structure & Technical Context Overall trend remains bullish Price is respecting a Triangular Moving Average pullback structure Healthy pullbacks inside an uptrend often offer high-probability continuation setups Momentum previously entered overbought conditions, followed by controlled cooling — a classic bullish reset 🟢 Trade Plan — Bullish Pullback Continuation Bias: Bullish 📈 Strategy Type: Pullback + Breakout Confirmation 🔓 Entry Plan Trigger: Break and hold above the overbought resistance zone Key Level: $320.00 After confirmation above 320, traders may consider flexible entries based on personal execution rules ⚠️ Entry execution depends on your own risk management and confirmation criteria. 🛑 Stop Loss (Risk Control) Protective Level: $305.00 This is a reference risk level, not a mandatory rule Adjust position size and stop placement according to your own strategy 📝 Dear Ladies & Gentlemen (Thief OG’s): This stop level is not a recommendation. Risk decisions are always your responsibility. 🎯 Target Zone (Profit Area) Primary Objective: $335.00 Area aligns with: Historical resistance Overbought reaction zones Potential liquidity trap region ⚠️ Market conditions can change — partial profits and active management are encouraged 📝 Dear Ladies & Gentlemen (Thief OG’s): This target is not mandatory. You decide how and when to secure profits. 👀 Related Symbols to Watch (Correlation & Sector Insight) SPY — Overall market strength supports continuation setups DIA — Dow exposure matters as MCD is a defensive heavyweight XLY — Consumer Discretionary strength adds confirmation SBUX — Sector sentiment comparison within consumer services 📌 If indices remain stable or bullish, continuation probability for MCD improves. 🧾 Final Notes from a Master Trader You’re not wrong to ask for clarity — precision matters What’s important is confirmation, risk control, and discipline No single level guarantees profit — price action always leads Trade smart. Protect capital. Let price confirm the story 🧠📊 ✨ “If you find value in my analysis, a 👍 and 🚀 boost is much appreciated — it helps me share more setups with the community!” ⚠️ Disclaimer: This is a Thief-style trading strategy shared for fun and educational purposes only. Not financial advice. Always manage your own risk. 🔖 Hashtags #MCD #Stocks #SwingTrading #BullishSetup #PullbackTrade #PriceAction #NYSE #TradingViewIdeas #RiskManagement #ThiefOG 😎📈
The-Thief
Gold Technical Outlook: LSMA Breakout Validated
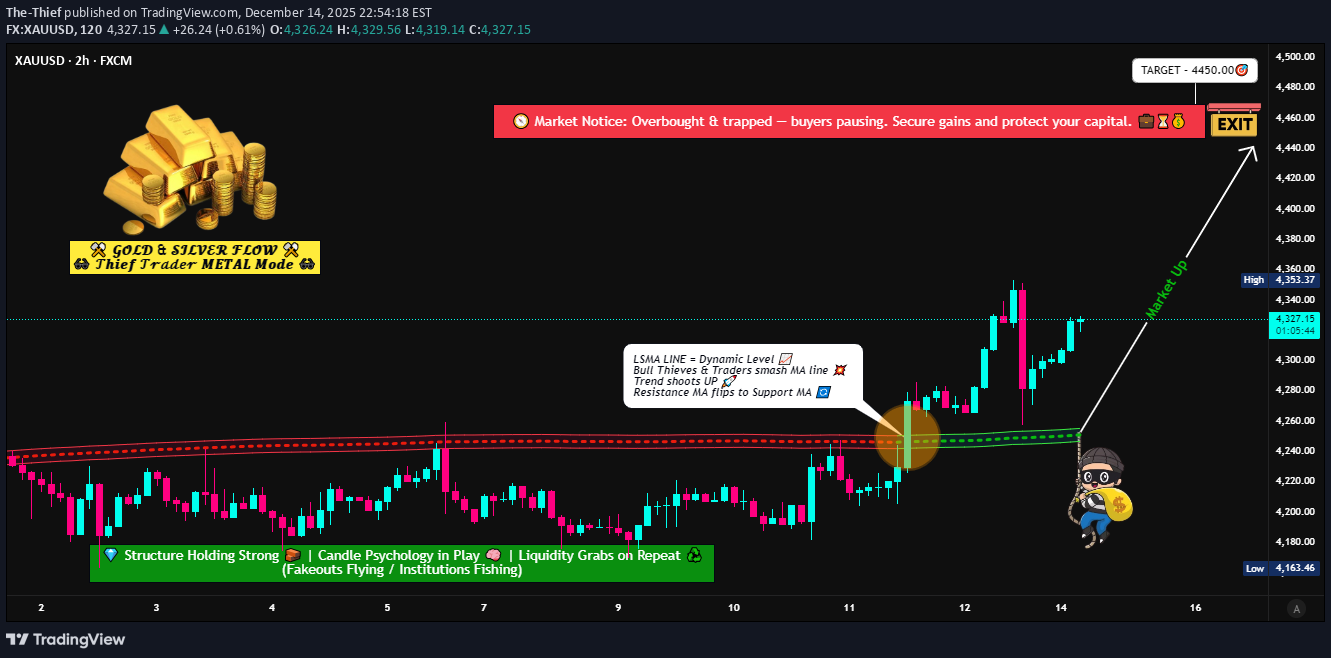
🟡 XAU/USD Bullish Breakout Blueprint | LSMA Momentum Play 📌 Asset XAU/USD – GOLD vs U.S. Dollar ⏱️ Day Trade / Swing Trade 📊 Metals Market Opportunity 📈 Market Bias & Structure Bullish Bias CONFIRMED ✅ Gold has delivered a clean LSMA (Least Squares Moving Average) breakout, signaling a shift in momentum from consolidation to expansion. Price acceptance above LSMA suggests buyers are in control, with dips attracting demand rather than rejection. This structure favors buy-the-dip strategies rather than chasing price at highs. 🔓 Entry Strategy (Layered Position Building) Entry Style: Flexible / Any Price Level 🧠 Layered Entry System for Better Average Pricing Buy Limit Layers (Thief Strategy): • 4240.00 • 4280.00 • 4320.00 ➡️ Traders may add or reduce layers based on volatility, risk profile, and position sizing. ➡️ Layering helps smooth entries during pullbacks and avoids emotional execution. 🛑 Risk Management (Stop Loss) Protective Stop: 4220.00 🚫 ⚠️ Dear Ladies & Gentlemen (Thief OG’s): This stop level is not mandatory. Adjust your SL according to: • Account size • Volatility conditions • Personal risk rules Capital protection always comes first. 🎯 Profit Objective (Smart Exit Zone) Primary Target: 4450.00 💰 📌 Rationale for Exit: • Strong historical resistance • Overbought conditions likely • Liquidity trap potential • Corrective pullback probability increases 👉 Do not get greedy near resistance. Scale out or exit fully when conditions align. ⚠️ TP is guidance only — manage profits according to your own system. 🔗 Related Markets to Watch (Correlation Guide) 💵 DXY – U.S. Dollar Index Inverse correlation with Gold Weakening DXY = tailwind for XAU/USD Watch for breakdowns below key support zones 📉 US10Y / US2Y Treasury Yields Falling yields increase Gold’s appeal (non-yielding asset) Yield compression often fuels bullish Gold expansions XAG/USD – Silver Silver often lags then accelerates after Gold moves Strength in XAG confirms broader precious metals demand 📊 SPX500 / US500 Equity risk-off sentiment supports Gold Sharp equity corrections = safe-haven inflows into XAU 🧠 Final Notes ✔️ Trend-following structure ✔️ LSMA breakout confirmation ✔️ Layered entries for precision ✔️ Defined risk & logical exit zone 👑 TO THE THIEF OG's & SMART TRADERS Trade responsibly. This is a blueprint – adapt it to your style. Like & follow if you find this useful! Sharing boosts visibility for all. ✅ 🔔 Stay updated with my ideas for more data-driven setups. 📈 Trade smart, manage risk, and stack profits! Disclaimer: This is not financial advice. Past performance doesn’t guarantee future results. You are solely responsible for your trades. ✅ LIKE | ✅ FOLLOW | ✅ SHARE Let’s grow together! 🚀📊
The-Thief
US500 Price Map. Will Buyers Defend Key Layers Toward 7000?
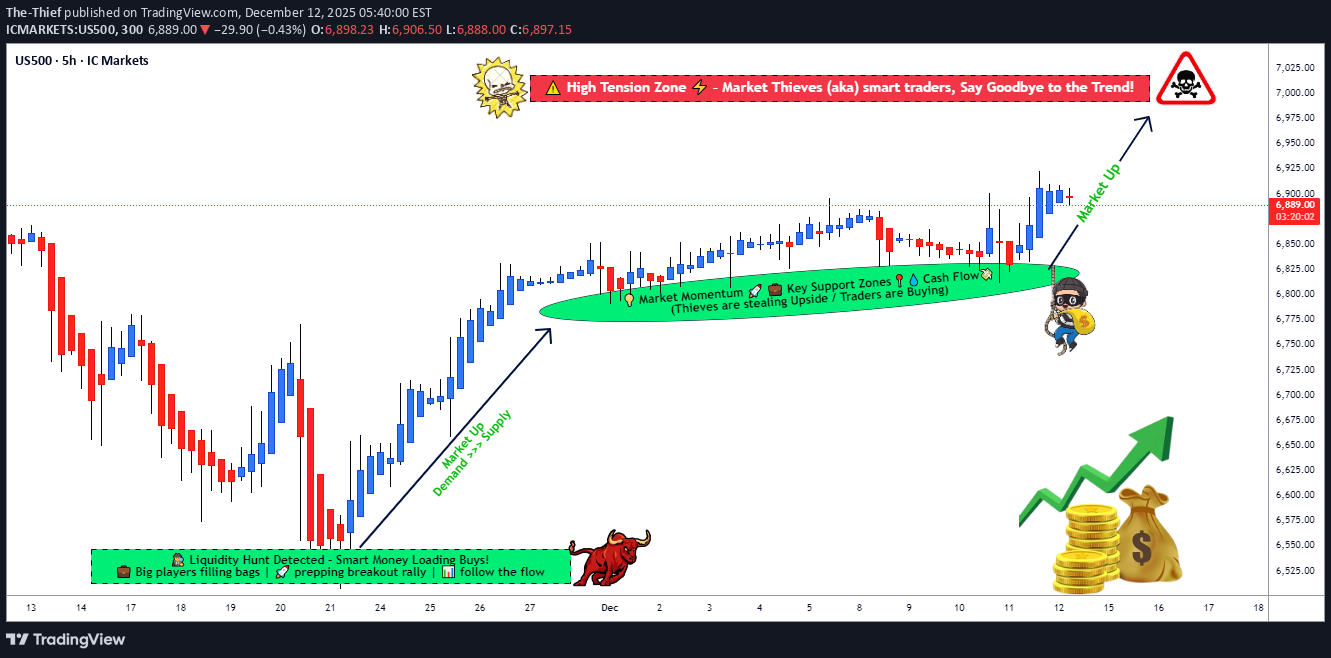
📊 US500/SPX500 Bullish Swing Trade Strategy | Professional Analysis 🚀 Current Price: $6,870.40 | Status: Bullish Momentum Building 🔥 🎯 TRADE OVERVIEW Asset: US500 / SPX500 Index Timeframe: DAY/SWING TRADE (Perfect for Active Traders) Market Condition: BULLISH 📈 Risk Level: Calculated & Managed ✅ 💡 WHY THIS SETUP WORKS The SPX500 is trading near 52-week highs ($6,920.34), with technical indicators showing Strong Buy signals on daily timeframes. Market sentiment remains constructive with potential for mean reversion plays and breakout opportunities. The index has strong institutional support and is consolidating before the next leg up. 🎲 ENTRY STRATEGY: LAYERED APPROACH (THIEF STRATEGY) Best Practice Approach: Use MULTIPLE LIMIT ORDERS at different price levels for optimal risk management. Entry Layers - Place These Simultaneously: Layer 1 - 6,800 (Low Risk Entry) This is your first position entry at the strong support zone. This layer captures traders looking for early bounces and reduces your average entry cost significantly. Perfect for conservative traders who want maximum confirmation before committing capital. Layer 2 - 6,825 (Medium Risk Entry) This second layer adds confirmation as price moves higher. This is where momentum traders jump in. By staggering entries here, you're catching the middle ground between aggressive and conservative positions, giving you excellent risk-reward setup. Layer 3 - 6,850 (Aggressive Breakout Entry) This final layer targets breakout traders who wait for price confirmation. Use this only if you have capital left and see strong volume confirmation. This is your most aggressive entry but has the strongest conviction signal. ✅ Pro Tip: You can add MORE layers based on your risk tolerance & account size. Start small, build positions gradually. Never go all-in on one layer! Why Layering Works 🎯 Layering is the professional way to build positions because it reduces average entry cost, protects against sudden whipsaws, captures multiple entry opportunities, and significantly increases your overall success probability. Instead of being wrong on one entry, you have three chances to be right! 🛑 STOP LOSS (SL): THIEF OG PROTECTION SL Level: 6,750 Risk Zone: Below support level This stop loss level protects you from breaking below a critical support zone. If price closes below 6,750, the bullish thesis is broken and you should exit to preserve capital. 📌 IMPORTANT DISCLAIMER: ⚠️ You are NOT required to use our suggested SL ⚠️ Adjust based on YOUR strategy & risk management rules ⚠️ YOUR MONEY = YOUR RULES | Trade with capital you can afford to lose SL Management Tips: Place your stop loss below key support levels that make sense with your trading strategy. Once you're in profit (usually +2% on SPX), consider moving your stop to breakeven so you're trading with house money. After solid confirmation and +3-5% profit, use trailing stops to let winners run. Most importantly, never risk more than 2-3% of your total account on a single trade. 🎁 PROFIT TARGET (TP): RESISTANCE CONFLUENCE Primary Target: 7,000 Reasoning: Strong Resistance + Overbought Zone + Technical Trap Pattern The 7,000 level represents a major psychological resistance and technical confluence where multiple indicators suggest profit-taking is likely. This is where smart money typically exits positions. The confluence of strong resistance levels, overbought RSI readings, and technical trap pattern all converge at this critical level, making it the ideal exit point for capturing the full move while protecting profits. 📌 CRITICAL NOTICE: ⚠️ Use YOUR OWN profit targets based on risk/reward ratio ⚠️ This is a SUGGESTED level only ⚠️ Protect Your Profits: Lock in gains before pullbacks Exit Strategy: Watch for volume divergence signals where price moves higher but volume decreases - this is a classic warning sign. Monitor RSI levels above 70, which indicate overbought conditions and potential reversals. Track support and resistance breaks throughout the move. Most importantly, don't be greedy. If you've hit your profit target, take it and move on. The best traders know when to say "I'm done for the day." 📍 RELATED PAIRS TO MONITOR (CORRELATION ANALYSIS) Strong Positive Correlation 🔗 NASDAQ-100 (NQ100/COMP) - Correlation: +0.92 This is your tech-heavy index and moves almost in lockstep with US500. Why watch this? Because tech drives the market. If NASDAQ is weak while SPX is strong, watch out for sector rotation. The NASDAQ-100 currently sits at 25,692. If SPX breaks 7,000, expect NASDAQ targets of 26,500+ based on historical correlation patterns. This pair move confirms the strength of the rally. DJIA (US30/Dow Jones) - Correlation: +0.89 The Dow Jones is your large-cap indicator. These are the blue-chip stocks. At 47,955, the Dow tends to lag SPX on rallies but confirms the trend strength. If Dow is not participating in SPX strength, it signals rotation OUT of mega-caps into mid-caps. Watch for this divergence as a warning signal. Russell 2000 (RUT) - Correlation: +0.78 Small-cap participation is crucial. A weak Russell 2000 during SPX strength means only mega-caps are rallying. This is a RED FLAG for sustainability. If Russell is strong with SPX, the rally is broad-based and likely to continue. If Russell is weak, we're in a narrow rally that can reverse quickly. Inverse Correlation (Risk Hedge) 🛡️ VIX (Volatility Index) - Correlation: -0.85 Currently at 15.41, this low volatility reading screams "risk-on" environment. Traders are comfortable, fear is low. But remember, VIX can spike suddenly. If VIX jumps above 20, consider taking profits and reducing exposure. A VIX spike signals institutional selling and risk-off sentiment. US DOLLAR (DXY) - Correlation: -0.72 Trading at 98.97, a weak dollar SUPPORTS equities because US companies make more money when the dollar is weak (exports become cheaper). If the dollar strengthens suddenly, expect SPX pressure. Monitor Fed policy announcements that impact currency valuations - they directly impact your equity trades! Sector Rotations to Track 💼 Tech Giants Matter: NVIDIA (NVDA) at $182.41 is down -0.53% but still critical. This is THE stock to watch. If NVDA collapses, the entire rally is in question. NVIDIA is your AI barometer. Meta Platforms (META) at $673.42 is up +1.80% and showing strength. This mega-cap strength confirms institutional confidence in the rally. When META leads, the market is feeling risk-on. Microsoft (MSFT) at $483.16 is stable at +0.48%. This is your stability indicator. If MSFT can't go higher with SPX, it's a divergence warning. Apple (AAPL) should be monitored for consumer health signals. Any weakness in AAPL suggests consumer spending concerns ahead. 🔍 TECHNICAL CONFIRMATION CHECKLIST ✅ Daily Chart: STRONG BUY - Moving Averages perfectly aligned in uptrend ✅ Weekly Chart: STRONG BUY - Macro uptrend completely intact, higher lows confirmed ✅ RSI: Not Yet Overbought - Means room to run before pullback expected ✅ MACD: Bullish Crossover Confirmed - Momentum indicator flashing green light ✅ Volume Profile: Good Distribution - Buying happening at higher price levels, not just sharp spikes ✅ Sentiment: Institutional Buying - Big money is flowing into SPX, not retail FOMO This checklist confirms the setup is solid for the bullish premise. All signals are aligned, which means the probability is in your favor. ⚡ TRADER RULES & DISCLAIMERS 🎯 Golden Rules for This Trade: Rule 1 - Only Risk What You Can Afford to Lose 💰 Don't use your rent money. Don't risk your emergency fund. Only trade capital that won't hurt your life if you lose it. This removes emotion from decision-making. Rule 2 - Respect Your Stop Loss No exceptions. Ever. A stop loss is not a suggestion - it's your insurance policy. Hit it and move on without hesitation. The traders who don't respect stops are the traders who blow up their accounts. Rule 3 - Scale In and Out Don't FOMO all-in on one entry. Build positions gradually with the three layers. Exit gradually with the three targets. This removes emotion and improves results dramatically. Rule 4 - Lock Profits Before Pullbacks Let winners run but protect gains. Your first 30% profit at 6,900 is EARNED. Take it. You only regret profits you didn't take. Rule 5 - Track Correlations Watch related pairs for divergence. If SPX goes up but NASDAQ goes down, something is wrong. Exit first, ask questions later. Rule 6 - Use Alerts - Don't Stare at Screens 24/7 Set price alerts on TradingView. Let technology do the work. You have a life outside trading. Check alerts a few times per day. Important Notices ⚠️ 📋 This is TECHNICAL ANALYSIS ONLY - Not financial advice 🔒 NOT a recommendation to buy or sell 💡 Use this framework with YOUR OWN analysis - Don't blindly follow 🎓 Paper trade first if you're testing this strategy - Practice before risking real money 📊 Past performance ≠ Future results - Markets change constantly 💪 TRADER PSYCHOLOGY EDGE Set your entries BEFORE market opens. Don't make emotional decisions when the market is moving fast. Your exit plan matters more than your entry plan. Where you exit determines your profit, not where you enter. Profits are made on discipline, not on aggression. The patient traders dominate the impatient ones. One good trade beats ten desperate ones. Never try to "make back" losses with revenge trading. The best traders know when to step away from the market and recharge their minds. 🚀 ENGAGEMENT BOOSTERS FOR LIKES & VIEWS If This Resonates: 👍 Like if you trade US500 index regularly 💬 Comment your entry price and targets ⭐ Bookmark this for your personal watchlist 🔔 Follow for daily swing trade setups and analysis Share Your Thoughts: "What's YOUR target on SPX? Comment below! 👇 Are you taking this trade or waiting for confirmation?" "Have you tried the layered entry method? Tell me your experience in the comments!"
The-Thief
ETHUSD Momentum Building! MA Breakout Keeps Bulls in Control
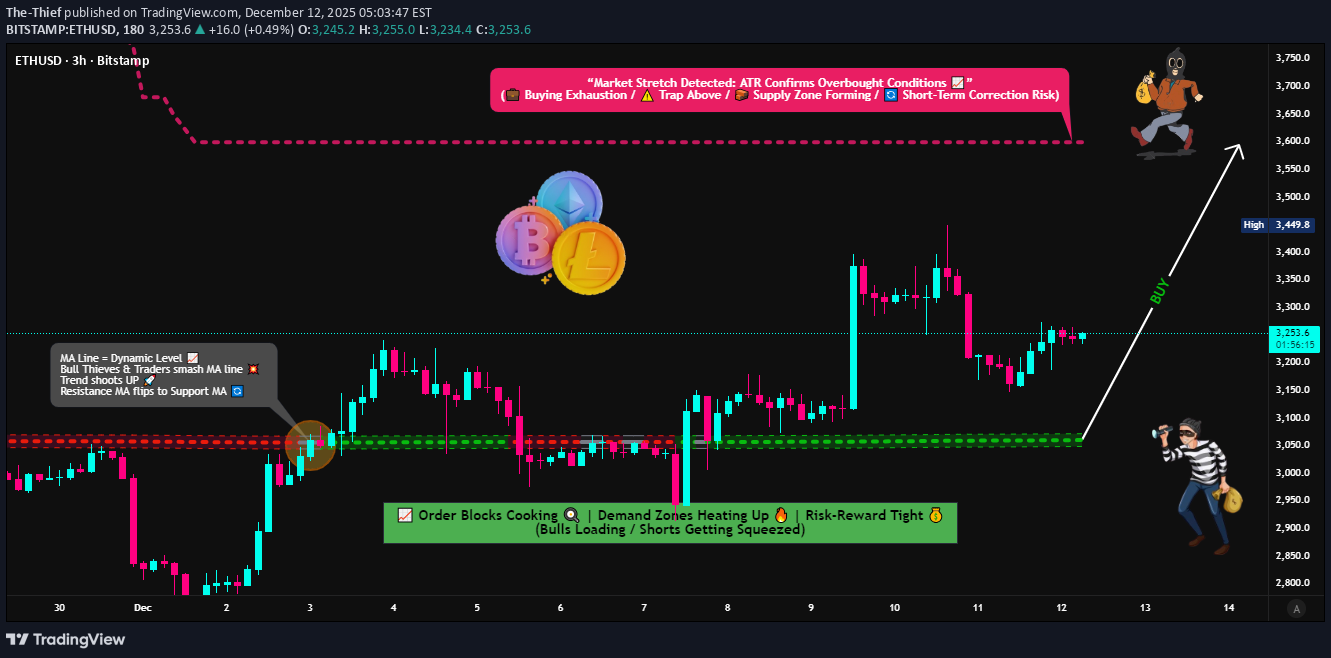
📘 **ETHUSD “Ethereum vs U.S. Dollar” Crypto Market Opportunity Blueprint (DAY Trade)** 🚀 Plan Overview A bullish continuation scenario is active following a clear Moving Average breakout and clean retest. This structure builds a favorable environment for controlled entries backed by momentum confirmation. 🎯 Entry 👉 You can enter at any price level once your personal confirmation aligns with the ongoing MA structure. The breakout + retest provides the core framework. 🛡️ Stop Loss Strategy 📍 This is the Thief SL @ 3050 Dear Ladies & Gentleman (Thief OG’s) Adjust your Stop Loss based on your own strategy, risk tolerance, and trade model. ⚠️ Place the SL only after the MA breakout confirmation, not before. 📝 Note: Dear Ladies & Gentleman (Thief OG's) I am not recommending that you use only my SL. It’s your own choice; you can make money then take money at your own risk. 🎯 Target The SuperTrend ATR line is acting as a strong resistance, and current conditions suggest: 📈 Overbought signals building Trap zones developing 📌 Smart exit required 👉 Our target: 3600 📝 Note: Dear Ladies & Gentleman (Thief OG’s) I am not recommending that you set only my TP. It’s your own choice; you can make money then take money at your own risk. 🔍 Related Pairs to Watch (Correlation & Key Notes) 1. BTCUSD (Bitcoin vs USD) ETHBTC correlation remains high during MA-driven moves. BTC’s trend strength often dictates crypto-wide volatility. Strong BTC breakout boosts ETH’s bullish follow-through potential. 2. ETHBTC (Ethereum vs Bitcoin) Great pair to measure Ethereum’s relative strength. Rising ETHBTC = ETH outperforming BTC → supports the bullish ETHUSD narrative. Useful for detecting early reversals before USD-pairs show it. 3. TOTAL2 (Altcoin Market Cap) Represents overall altcoin strength excluding BTC. If TOTAL2 breaks resistance with volume, ETH usually moves aggressively. Helps confirm whether the market supports a broad-based ETH rally. 4. SOLUSD (Solana vs USD) Competes for capital rotation with ETH. When SOL pumps aggressively, ETH sometimes lags before catching momentum. Watching SOL gives early hints of altcoin capital flow. 5. DXY (US Dollar Index) Inverse correlation with major crypto assets. Weak DXY = supportive environment for ETHUSD upside. Strong DXY = caution for crypto longs.
Disclaimer
Any content and materials included in Sahmeto's website and official communication channels are a compilation of personal opinions and analyses and are not binding. They do not constitute any recommendation for buying, selling, entering or exiting the stock market and cryptocurrency market. Also, all news and analyses included in the website and channels are merely republished information from official and unofficial domestic and foreign sources, and it is obvious that users of the said content are responsible for following up and ensuring the authenticity and accuracy of the materials. Therefore, while disclaiming responsibility, it is declared that the responsibility for any decision-making, action, and potential profit and loss in the capital market and cryptocurrency market lies with the trader.