
FxProGlobal
@t_FxProGlobal

What symbols does the trader recommend buying?
Purchase History
پیام های تریدر
Filter
FxProGlobal
تحلیل موج انویدیا: بازگشت قدرتمند به سوی ۱۹۰ دلار!
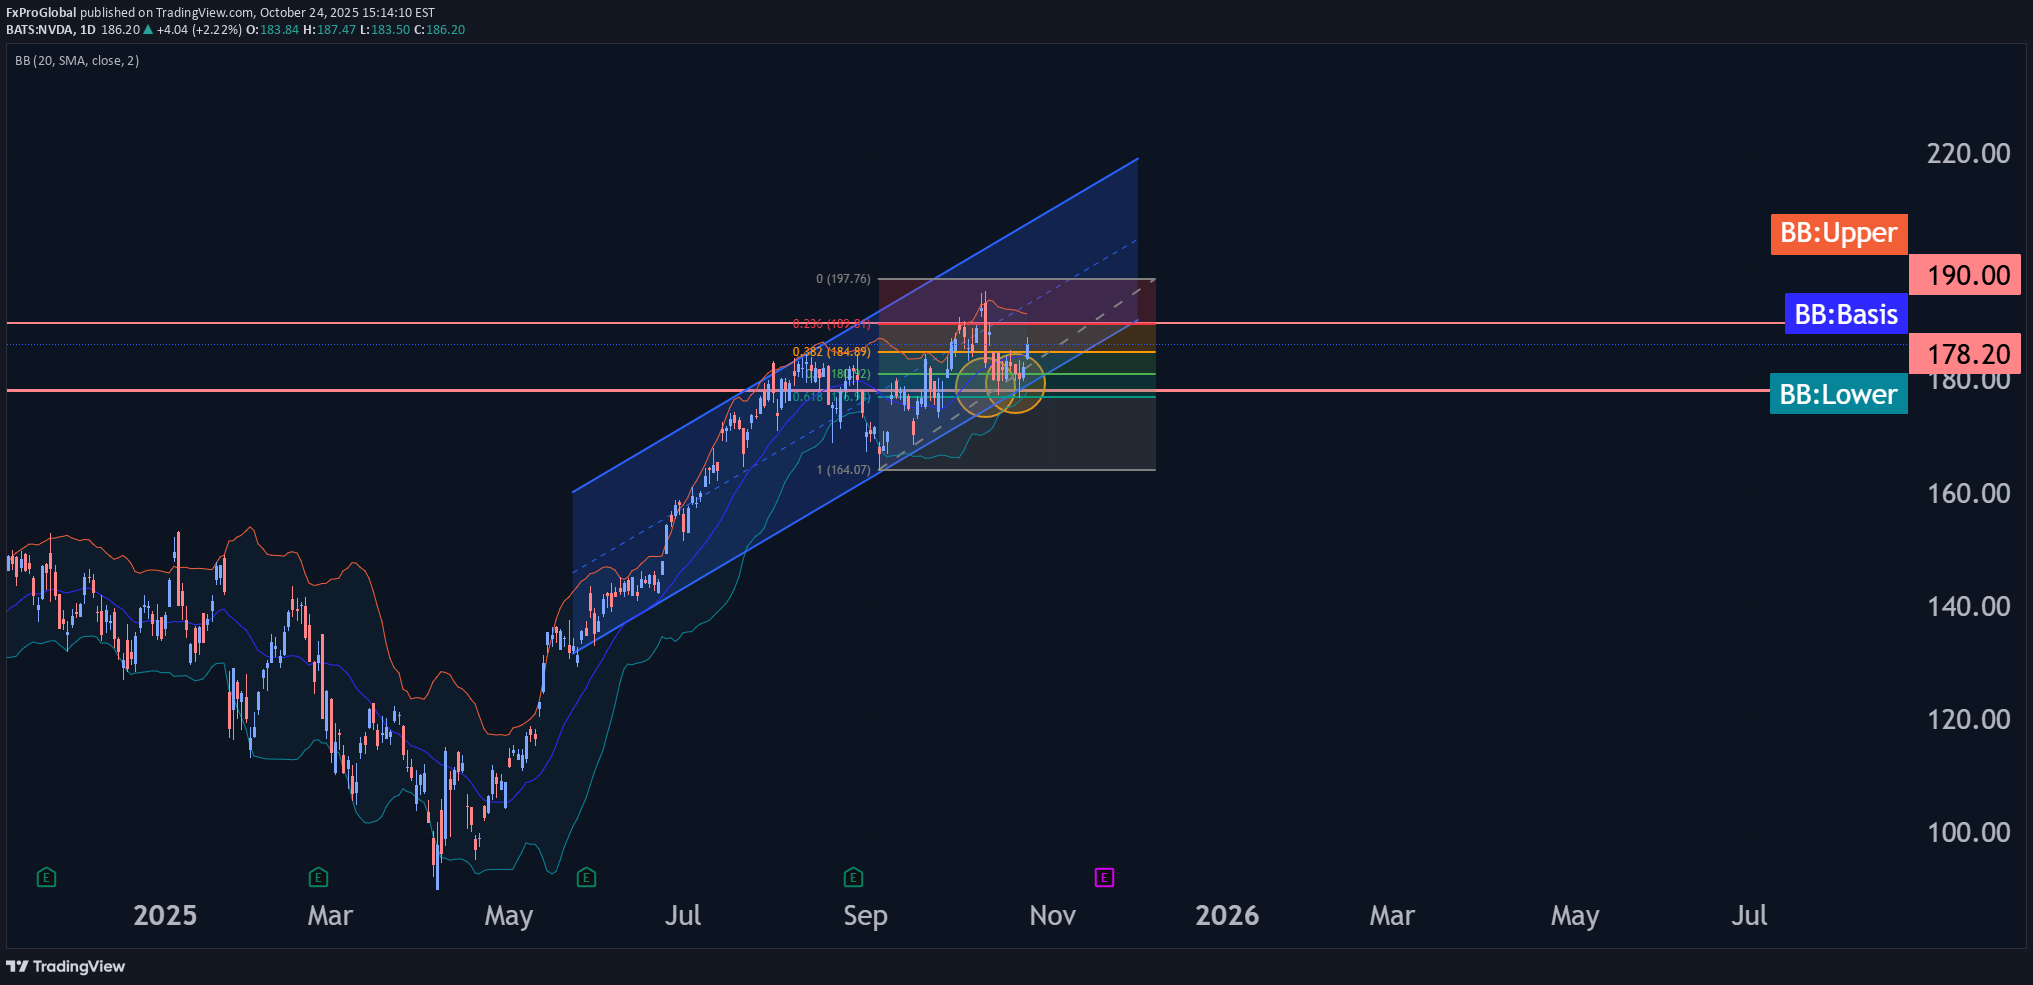
- Nvidia reversed from support zone - Likely to rise to resistance level 190.00 Nvidia recently reversed up from the support zone between the key support level 178.20 (which stopped the previous minor wave a, as can be seen from the daily Nvidia chart below), support trendline of the daily up channel from May and the 50% Fibonacci correction of the upward impulse from the start of September. The upward reversal from the support level 178.20 stopped the previous short-term ABC correction ii. Given the long-term uptrend, Nvidia can be expected to rise to the next resistance level 190.00 (which reversed the price at the start of October).
FxProGlobal
تحلیل موج اتریوم: سیگنال خرید قوی؛ آماده جهش به مقاومت ۴۰۹۵ دلار!
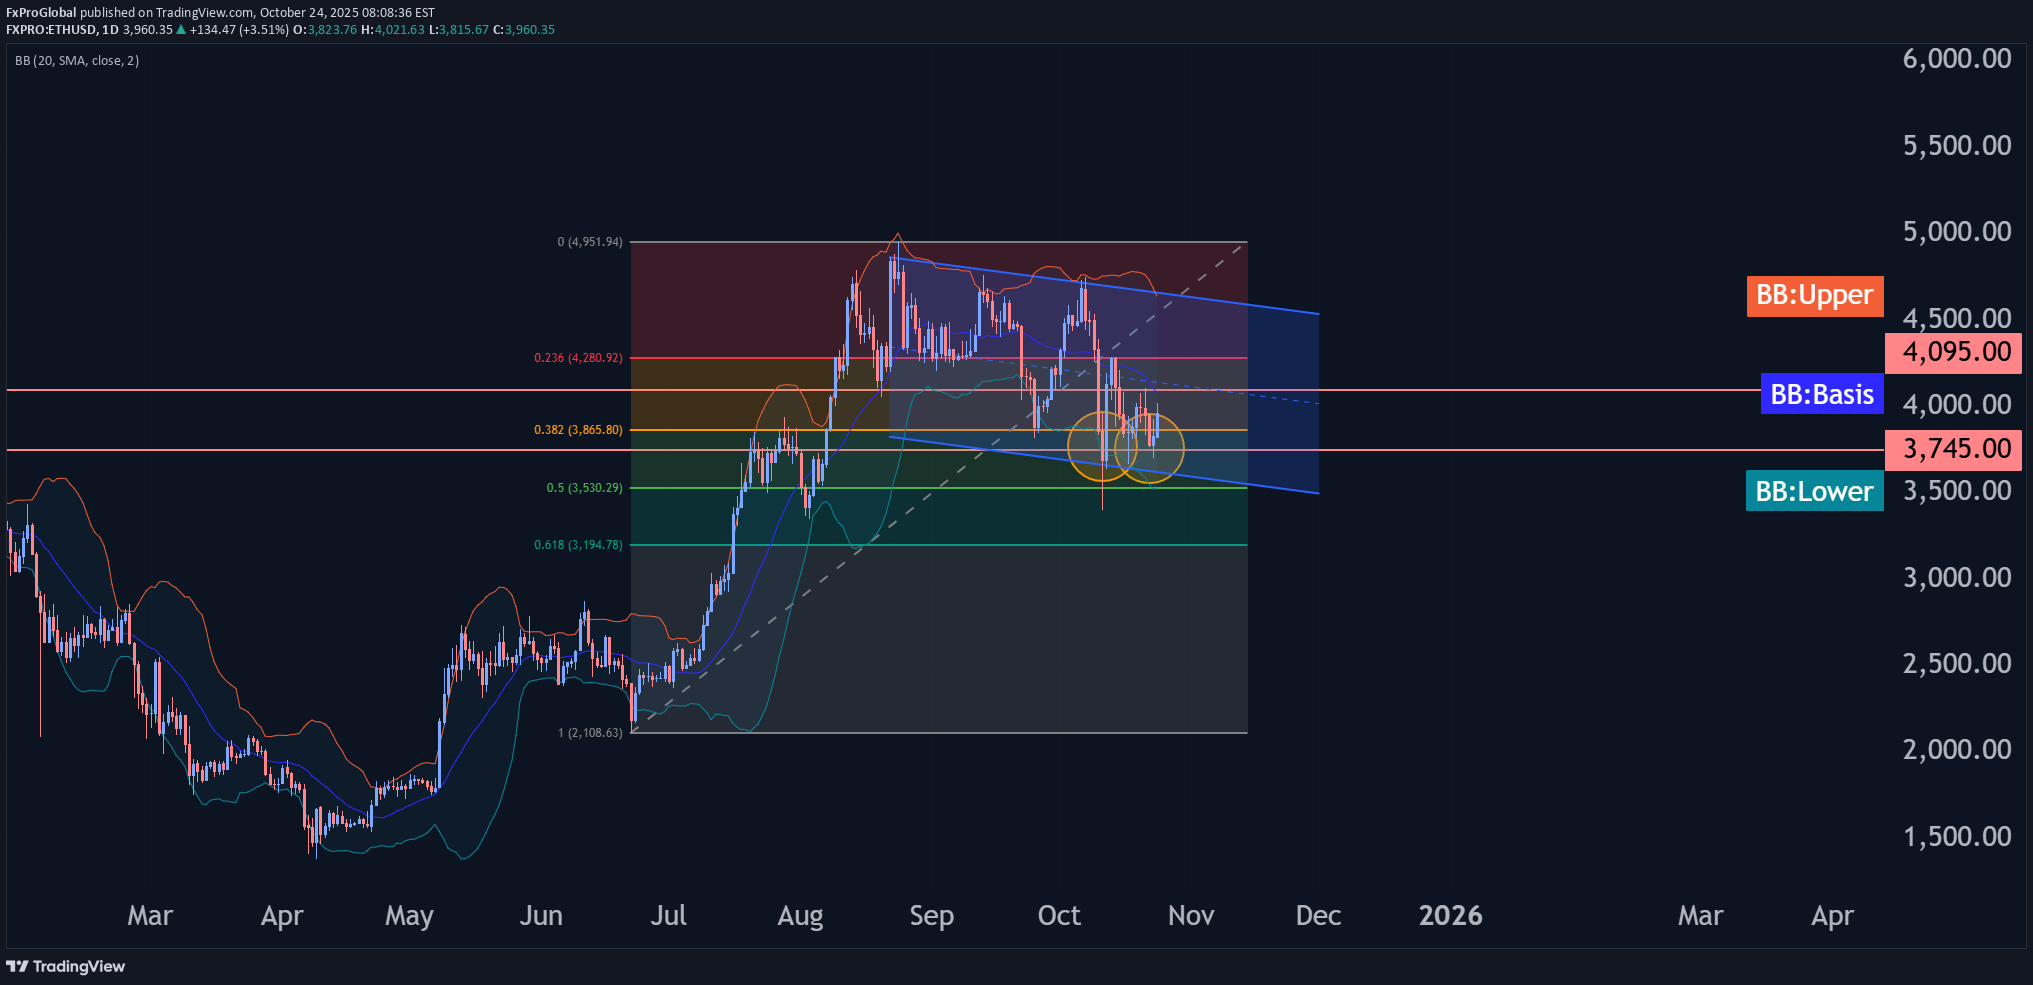
- Ethereum reversed from support zone - Likely to rise to resistance level 4095,00 Ethereum cryptocurrency recently reversed up from the support zone between the strong support level 3745.00 (which reversed the price multiple times this month) and the 38.2% Fibonacci correction of the upward impulse from June. The upward reversal form this support zone is likely to form the daily Japanese candlesticks reversal pattern Morning Star – strong buy signal for Ethereum. Given the clear daily uptrend, Ethereum cryptocurrency can be expected rise fall to the next resistance level 4095,00 (which stopped the previous correction ii).
FxProGlobal
تحلیل موج تسلا (۲۳ اکتبر): آیا سهم به مقاومت ۴۶۷ دلار میرسد؟
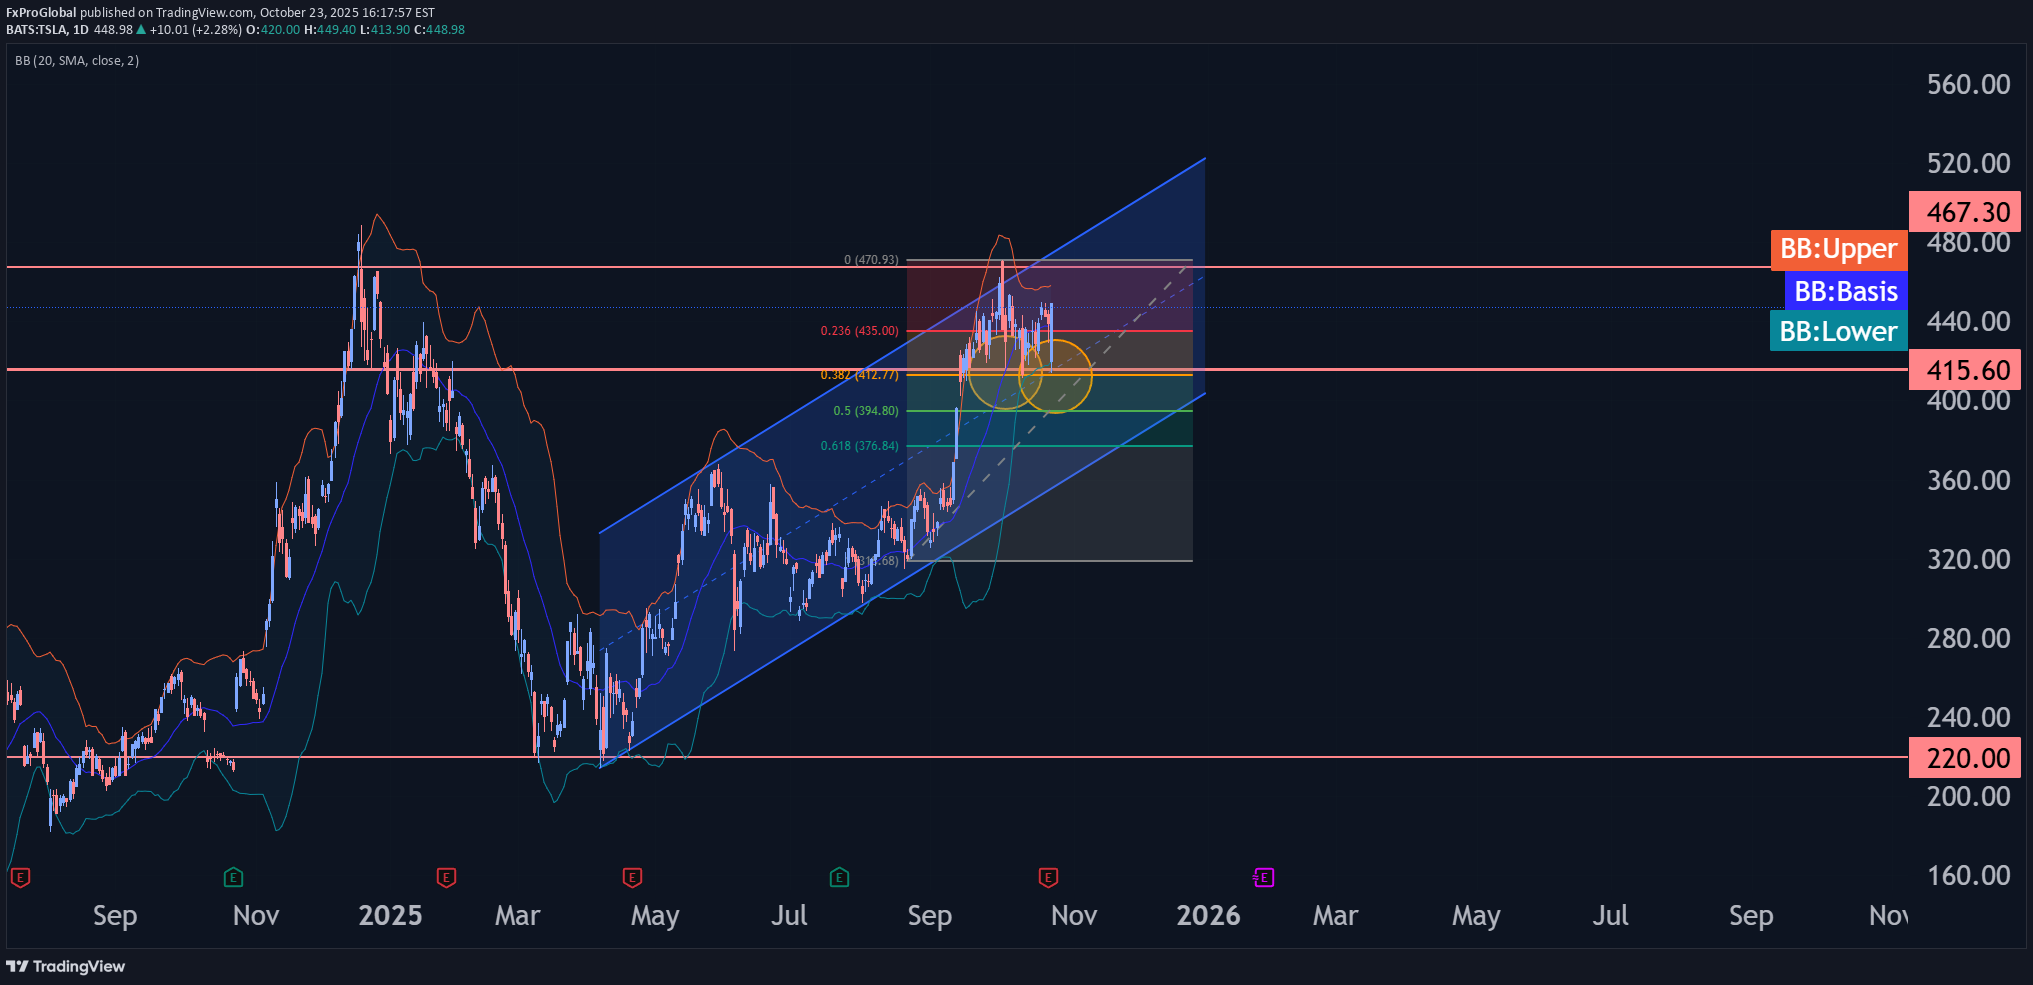
- Tesla reversed from support area - Likely to rise to resistance level 467.30 Tesla recently reversed from the support area located between the key support level 415.60 (which has been reversing the price from the middle of September) and the lower daily Bollinger Band. This support area was further strengthened by the 38.2% Fibonacci correction of the upward impulse from August. Given the strong daily uptrend, Tesla can be expected to rise to the next strong resistance level 467.30 (top of the previous impulse wave i).
FxProGlobal
تحلیل موجی زدکش (ZCash): سقوط قریبالوقوع به حمایت 240 دلار!
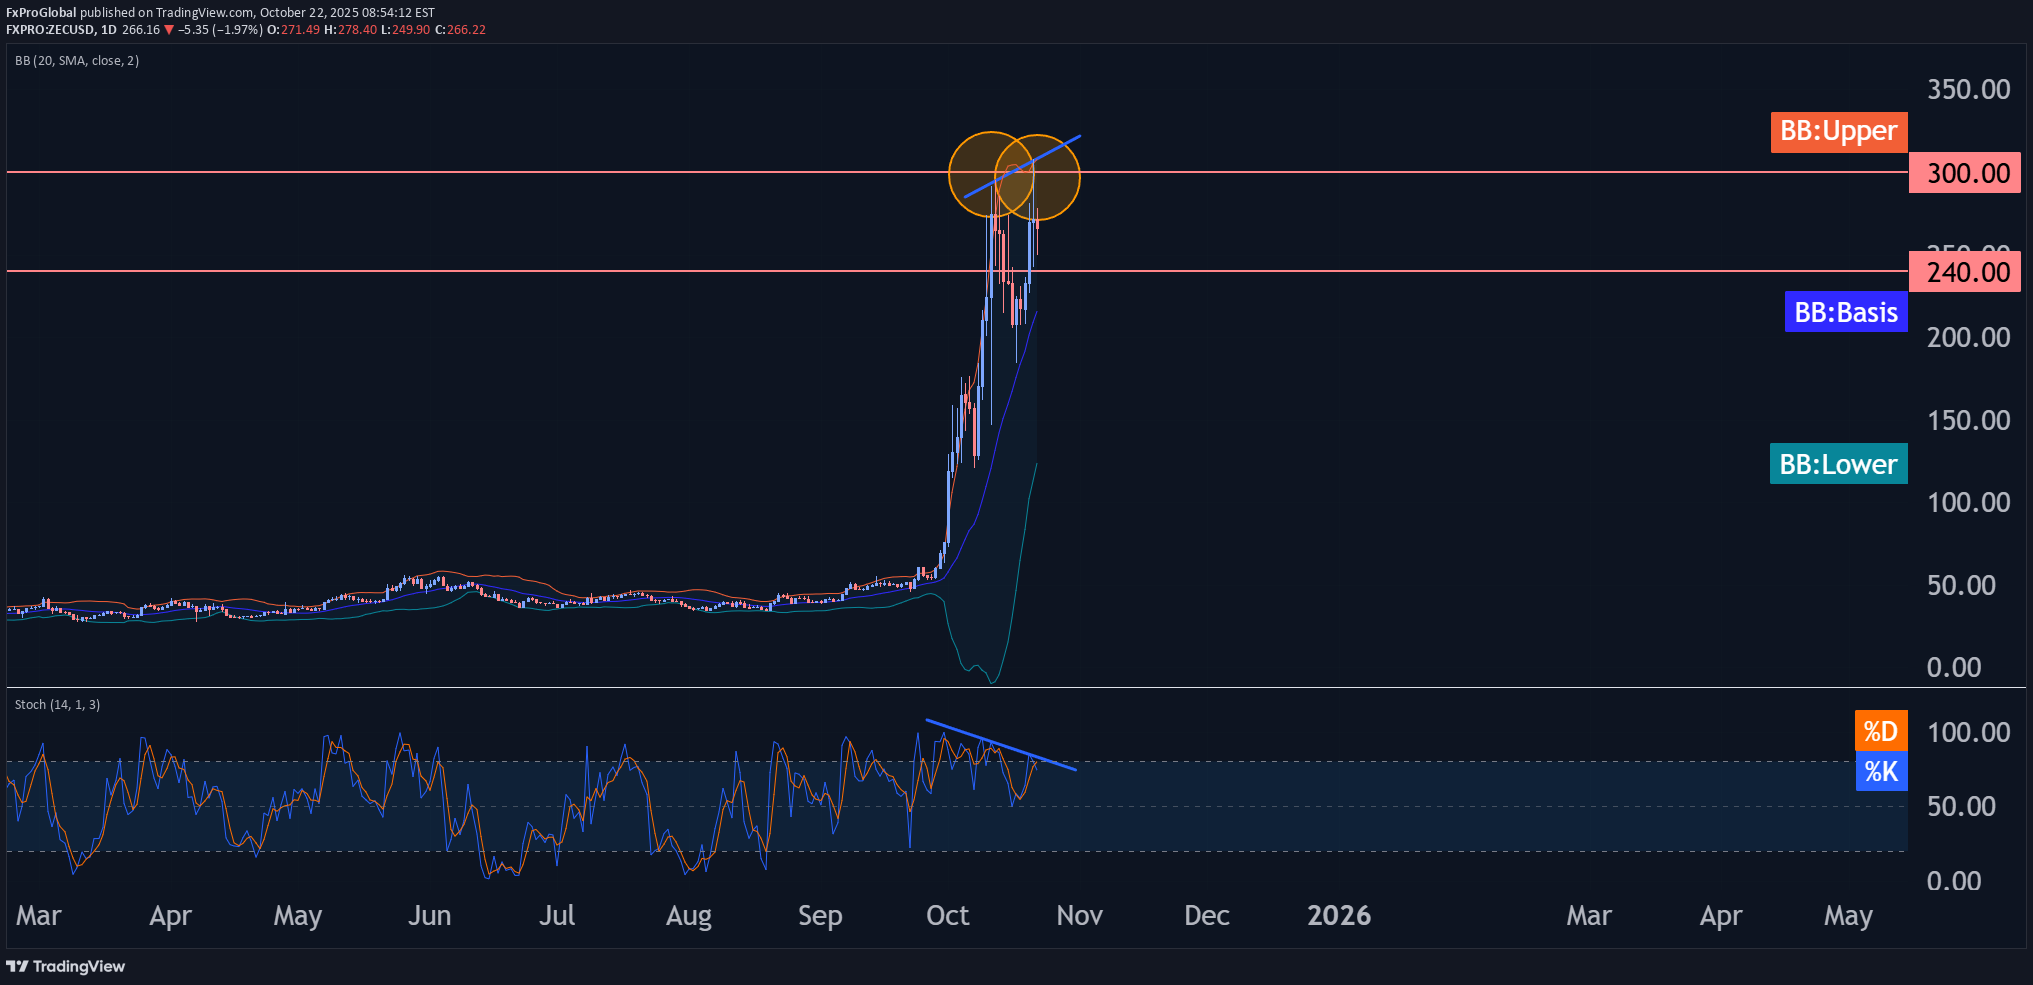
- ZCash reversed from round resistance level 300.00 - Likely to fall to support level 240.00 ZCash cryptocurrency recently reversed down from the resistance area surrounding the round resistance level 300.00 (which stopped the previous impulse wave 1 at the start of October). The downward reversal from this resistance area formed the daily Japanese candlesticks reversal pattern long-legged Doji. Given the strength of the resistance level 300.00 and the bearish divergence on the dally Stochastic, ZCash cryptocurrency can be expected to fall to the next support level 240.00.
FxProGlobal
تحلیل موجی تنکوین (۲۱ اکتبر): سقوط احتمالی به سطح حمایتی ۲.۰۰۰۰!
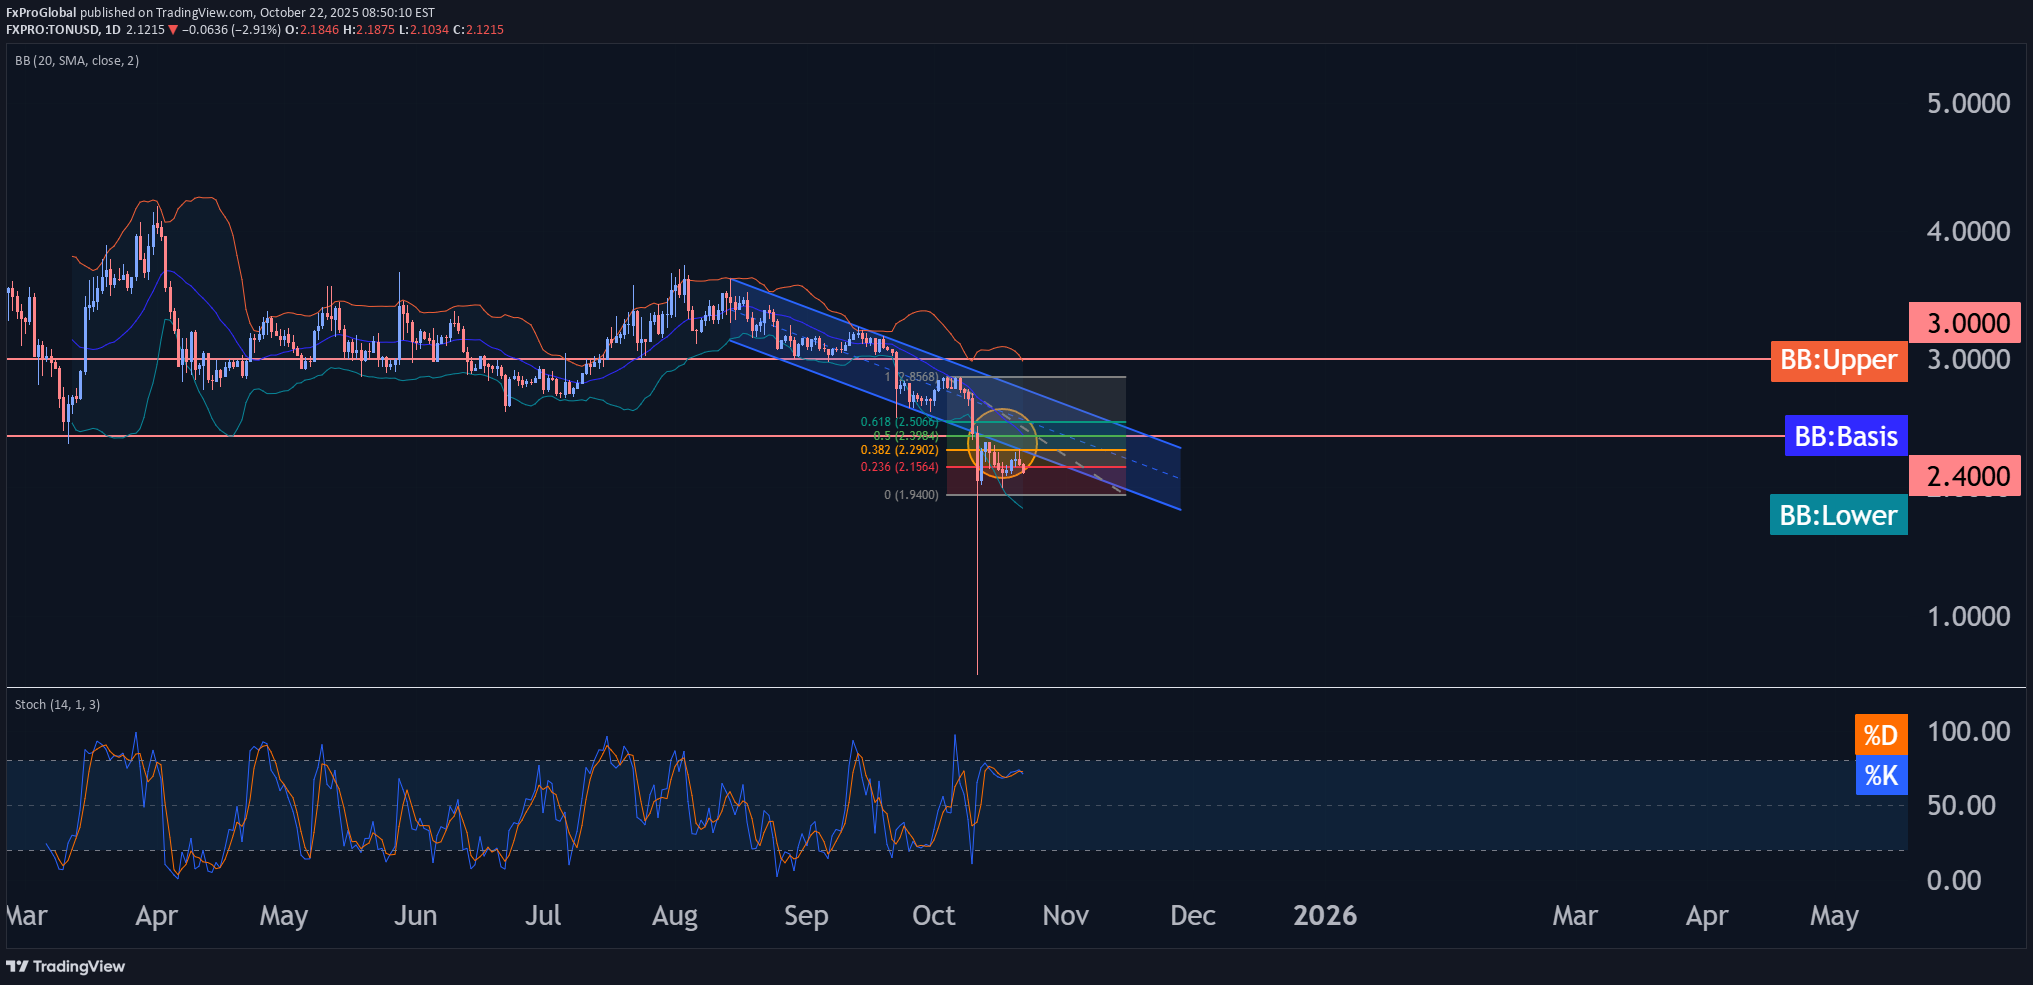
- Toncoin reversed from resistance area - Likely to fall to round support level 2.0000 Toncoin cryptocurrency recently reversed down from the resistance area between the resistance level 2.4000 (which reversed the price at the start of October) and the lower trendline of the recently broken down channel from August. The downward reversal from this resistance area stopped wave (b) of the previous short-term ABC correction 2. Given the clear daily downtrend, Toncoin cryptocurrency can be expected to fall to the next round support level 2.0000 (low of the earlier wave a).
FxProGlobal
تحلیل موج طلا (21 اکتبر): ریزش سنگین پس از ناتوانی در شکست مقاومت ۴۳۷۰!
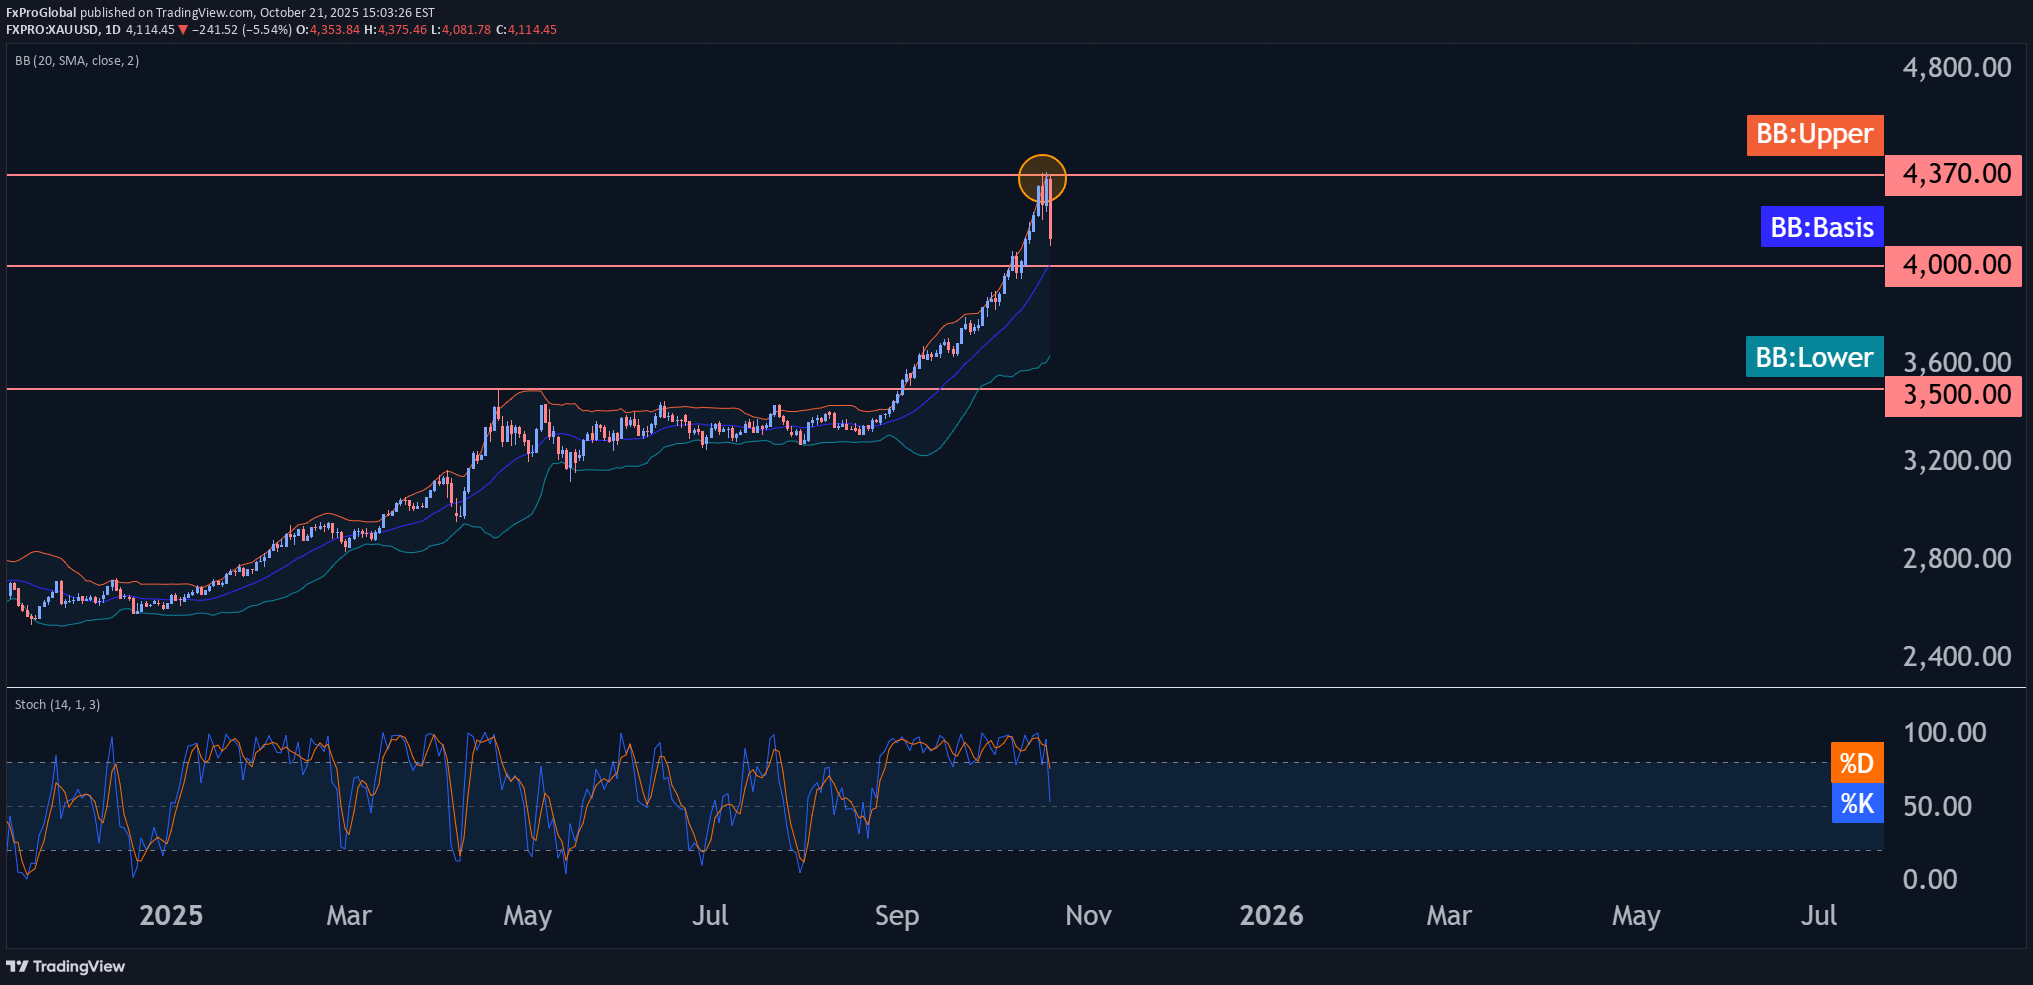
- Gold reversed from key resistance level 4370.00 - Likely to fall to support level 4000.00 Gold falling strongly after the price made 3rd failed attempt to break above the key resistance level 4370.00 standing well above the upper daily Bollinger Band. The downward reversal from the resistance level 4370.00 will form the daily Japanese candlesticks reversal pattern Bearish Engulfing – strong sell signal for Gold. Given the abnormally long period of overbought daily Stochastic, Gold can be expected to fall to the next round support level 4000.00.
FxProGlobal
تحلیل موجی XRP: آیا صعود به ۲.۶۵۰ قطعی است؟ (۲۰ اکتبر ۲۰۲۵)

- XRP reversed from key support level 2.200 - Likely to rise to resistance level 2.650 XRP cryptocurrency recently reversed from the support area between the key support level 2.200, lower daily Bollinger Band and the support trendline of the daily down channel from July. The upward reversal from this support zone created the daily Japanese candlesticks reversal pattern Morning Star – with its middle candle being long-legged Doji. Given the strength of the support level 2.200, XRP cryptocurrency can be expected to rise to the next resistance level 2.650 (top of the previous wave A).
FxProGlobal
تحلیل موج آمازون (۲۰ اکتبر): آیا سهام از ۲۱۰ دلار به سمت ۲۲۰ دلار اوج میگیرد؟
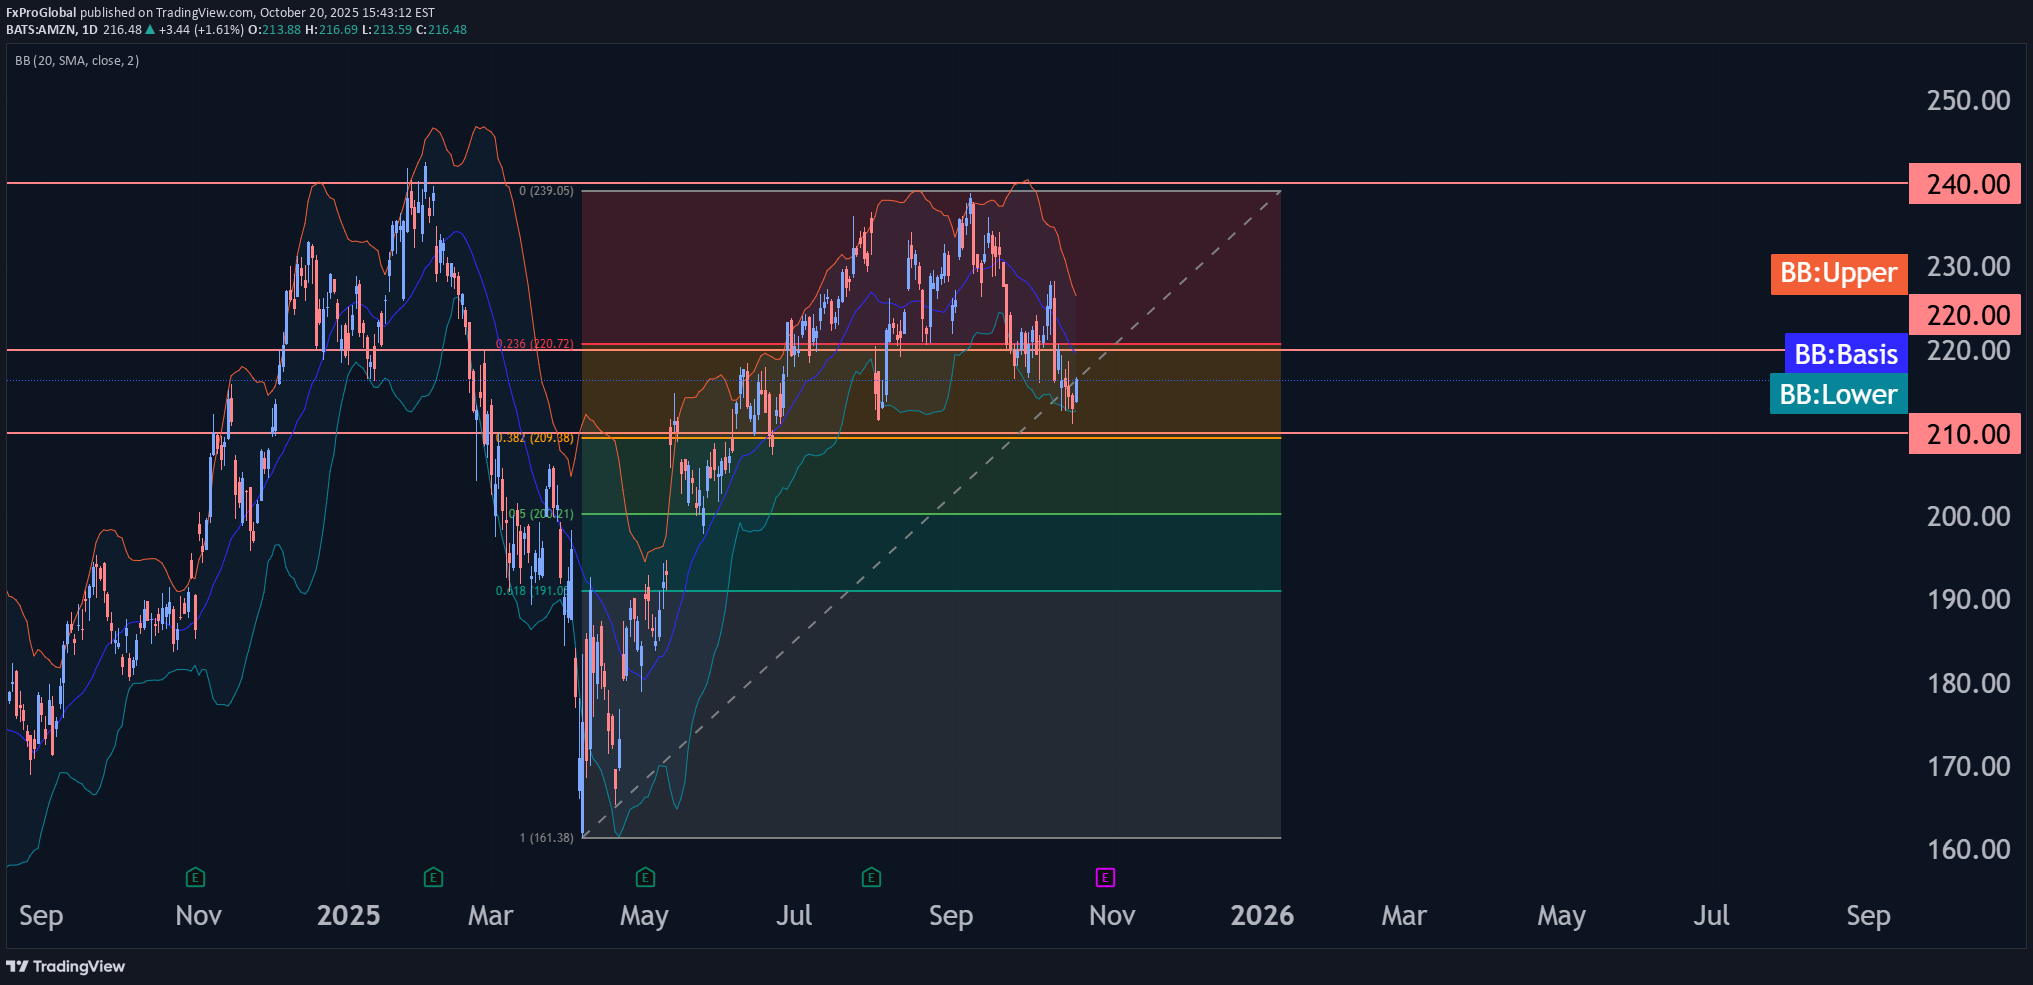
- Amazon reversed from support level 210.00 - Likely to rise to resistance level 220.00 Amazon recently reversed from the support area between the key support level 210.00 (which has been reversing the price from June), lower daily Bollinger Band and the 38.2% Fibonacci correction of the upward impulse from April The upward reversal from this support zone created the daily Japanese candlesticks reversal pattern Hammer. Given the strength of the support level 210.00 and the oversold daily Stochastic, Amazon can be expected to rise to the next resistance level 220.00 (former strong support from September).
FxProGlobal
تحلیل تکنیکال استلار (XLM): ریزش تا کف ۰.۳۰۰۰ پس از شکست مقاومت قوی!
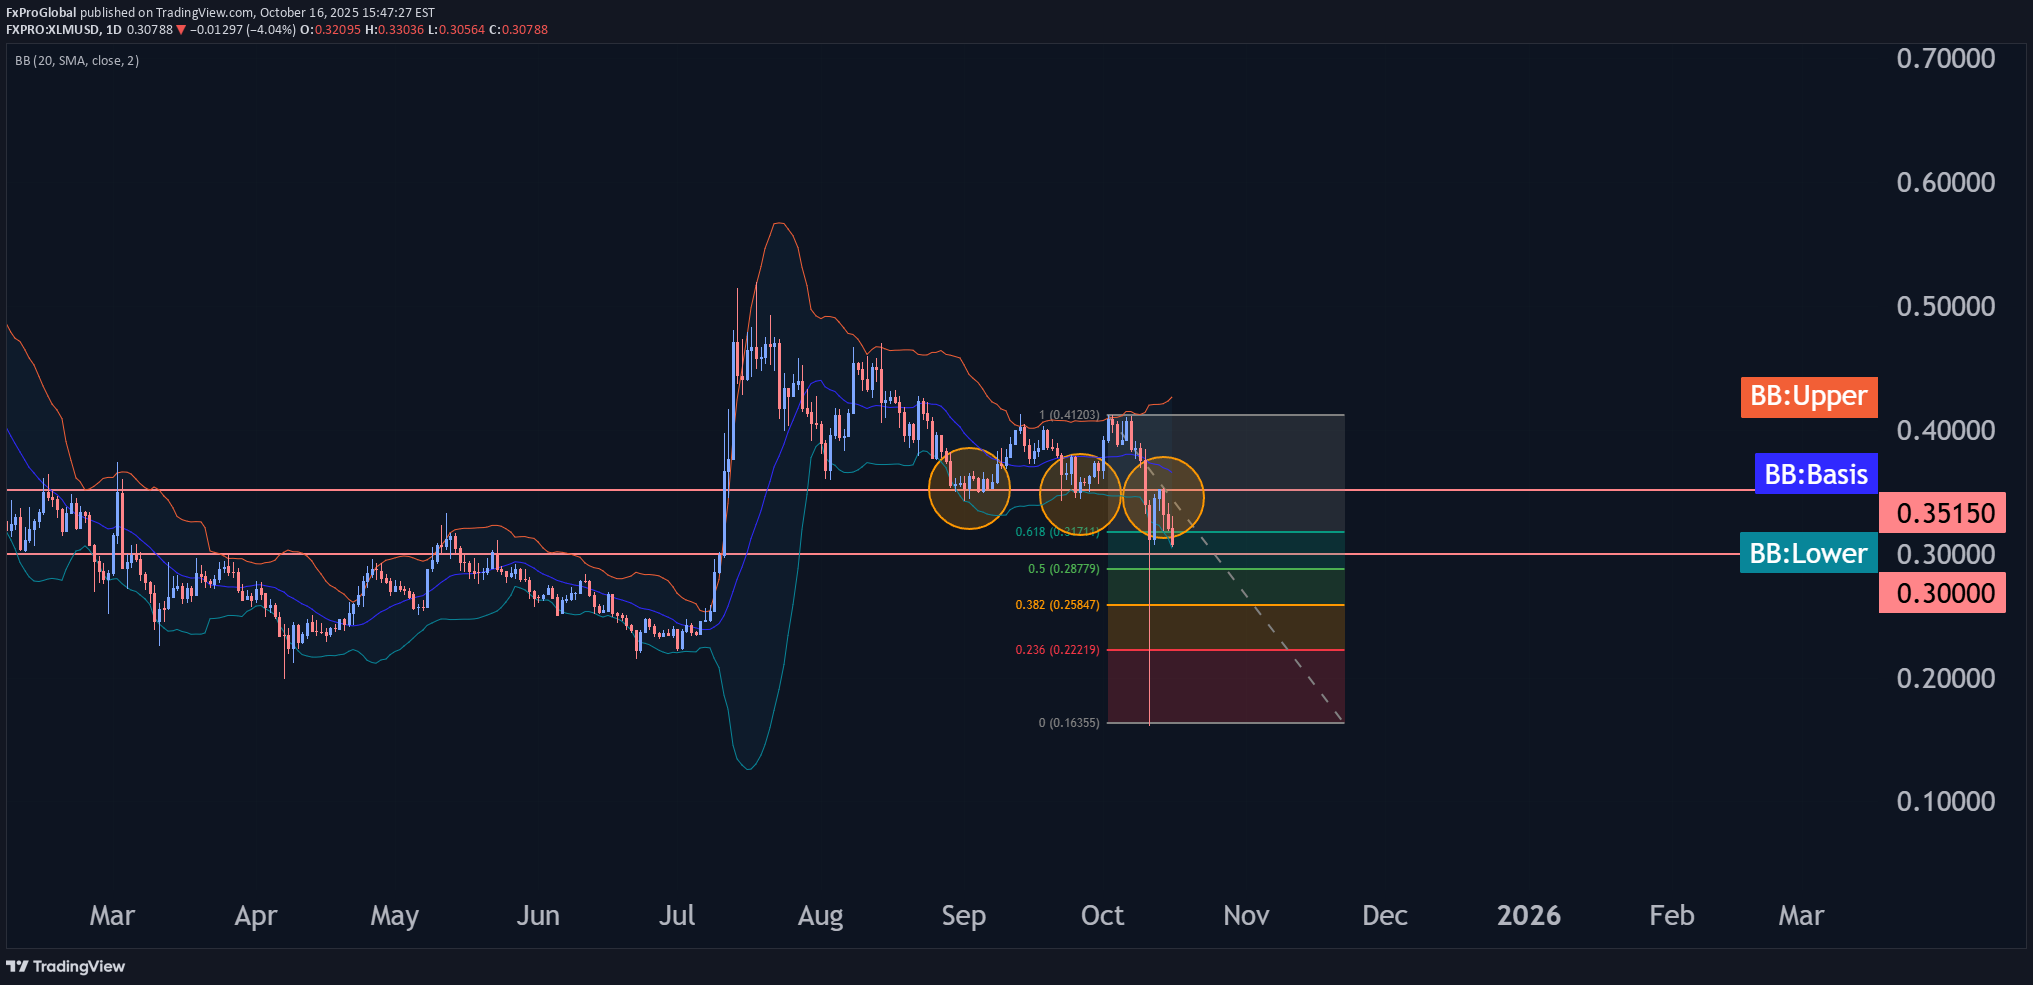
- Stellar reversed from strong resistance level 0.3515 - Likely to fall to support level 0.3000 Stellar cryptocurrency recently reversed down from the strong resistance level 0.3515 (former strong support from August and September, acting as resistance after it was broken recently). The resistance level 0.3515 was strengthened by the 78.6% Fibonacci correction of the previous sharp downward impulse from the start of October. Given the strong daily downtrend, Stellar cryptocurrency can be expected to fall to the next round support level 0.3000.
FxProGlobal
تحلیل موجی سولانا: آیا رالی تا ۲۱۰ دلار آغاز شده است؟ (پشتیبانی ۱۵۰ دلار نجات داد!)
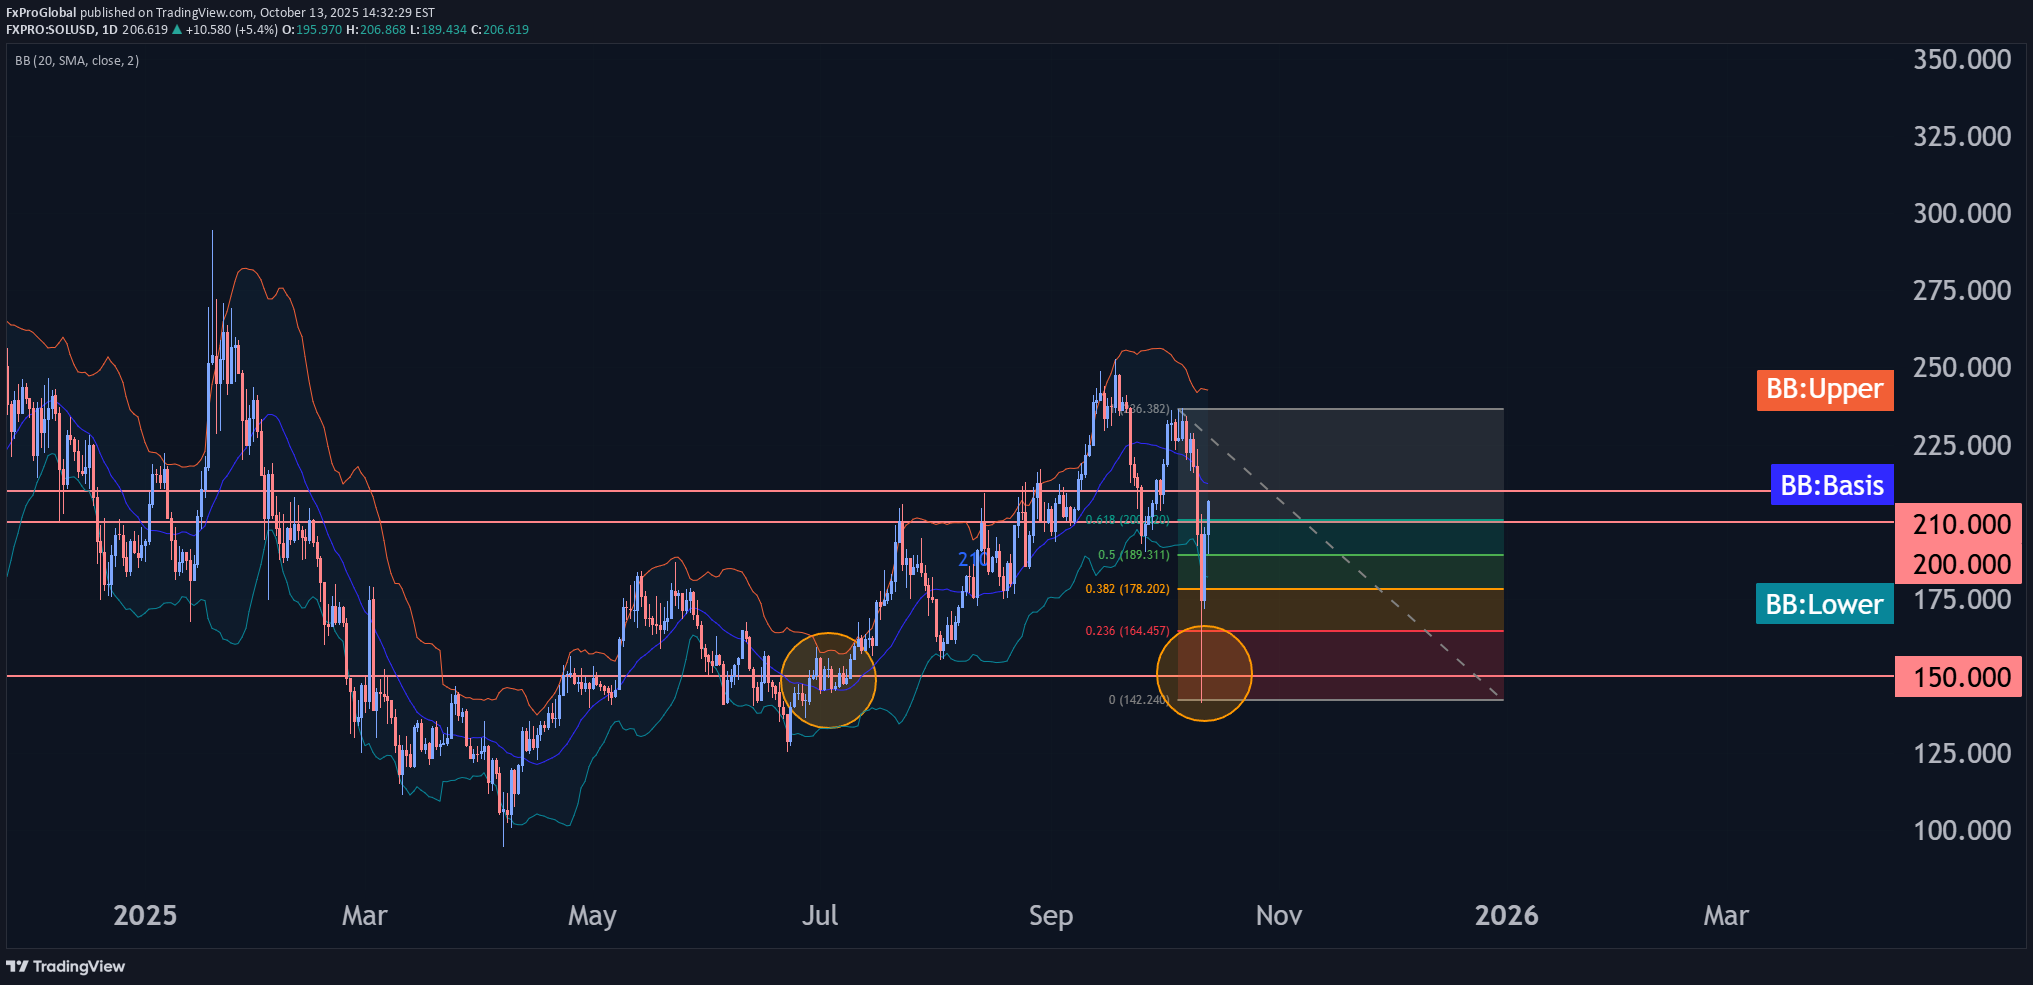
- Solana reversed from key support level 150.00 - Likely to rise to resistance level 210.00 Solana recently reversed up sharply from the key support level 150.00, which has been reversing the price from July, as can be seen below. The upward reversal from the support level 150.00 stopped the earlier sharp downward ABC correction 2 from September. Given the recent breakout of the round resistance level 200.00 and the strongly bullish crypto sentiment seen today, Solana can be expected to rise to the next resistance level 210.00.
Disclaimer
Any content and materials included in Sahmeto's website and official communication channels are a compilation of personal opinions and analyses and are not binding. They do not constitute any recommendation for buying, selling, entering or exiting the stock market and cryptocurrency market. Also, all news and analyses included in the website and channels are merely republished information from official and unofficial domestic and foreign sources, and it is obvious that users of the said content are responsible for following up and ensuring the authenticity and accuracy of the materials. Therefore, while disclaiming responsibility, it is declared that the responsibility for any decision-making, action, and potential profit and loss in the capital market and cryptocurrency market lies with the trader.