
TRU
TrueFi
| تریدر | نوع سیگنال | حد سود/ضرر | زمان انتشار | مشاهده پیام |
|---|---|---|---|---|
 CryptoAnalystSignalRank: 2104 | خرید | حد سود: ۰٫۰۱۹۶ حد ضرر: تعیین نشده | 10/22/2025 |
Price Chart of TrueFi
سود 3 Months :
سیگنالهای TrueFi
Filter
Sort messages by
Trader Type
Time Frame
CryptoAnalystSignal
آیا TRU/USDT در حال تشکیل الگوی گُوِه نزولی است؟ پیشبینی انفجار قیمتی و نقاط ورود و خروج!
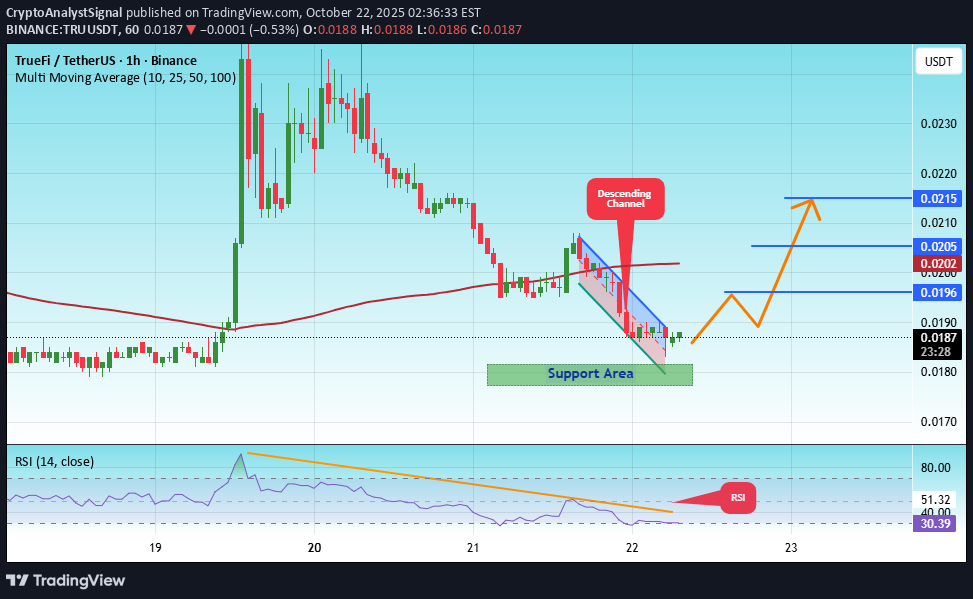
#TRU The price is moving within a descending channel on the 1-hour frame, adhering well to it, and is heading for a strong breakout and retest. We have a bearish trend on the RSI indicator that is about to be broken and retested, which supports the upward breakout. There is a major support area in green at 0.0178, representing a strong support point. We are heading for consolidation above the 100 moving average. Entry price: 0.0186 First target: 0.0196 Second target: 0.0205 Third target: 0.0215 Don't forget a simple matter: capital management. When you reach the first target, save some money and then change your stop-loss order to an entry order. For inquiries, please leave a comment. Thank you.
CryptoAnalystSignal
احتمال صعود بزرگ #TRU/USDT: تحلیل نمودار گُوِه نزولی و نقاط ورود کلیدی!

#TRU The price is moving within a descending channel on the 1-hour frame, adhering well to it, and is heading for a strong breakout and retest. We have a bearish trend on the RSI indicator that is about to be broken and retested, which supports the upward breakout. There is a major support area in green at 0.0276, representing a strong support point. We are heading for consolidation above the 100 moving average. Entry price: 0.0285 First target: 0.0290 Second target: 0.0295 Third target: 0.0302 Don't forget a simple matter: capital management. When you reach the first target, save some money and then change your stop-loss order to an entry order. For inquiries, please leave a comment. Thank you.

mejazkhanm

truusdt is defi project, when money flow into the defi system it will blast soon, doesn't matter what btc or eth doing, build positions from mention zone n use tigh sl. don't expect too much targets from any dead cat. First wait for the sweep of previous daily swing low n then enter. for any continuously update must join my tg or discord group it's free.
CryptoAnalystSignal

#TRU The price is moving within an ascending channel on the 1-hour frame, adhering well to it, and is on track to break it strongly upwards and retest it. We have support from the lower boundary of the ascending channel, at 0.0295. We have a downtrend on the RSI indicator that is about to break and retest, supporting the upside. There is a major support area (in green) at 0.0298, which represents a strong basis for the upside. Don't forget a simple thing: ease and capital. When you reach the first target, save some money and then change your stop-loss order to an entry order. For inquiries, please leave a comment. We have a trend to hold above the 100 Moving Average. Entry price: 0.0314. First target: 0.0321. Second target: 0.0332. Third target: 0.0345. Don't forget a simple thing: ease and capital. When you reach your first target, save some money and then change your stop-loss order to an entry order. For inquiries, please leave a comment. Thank you.#TRU First target: 0.0321 Reached Second target: 0.0332 Reached Third target: 0.0345 Reached

CryptoNuclear

📌 Overview: TRU/USDT is currently trading within a key long-term demand zone between $0.0229–$0.0307 — an area that has consistently acted as a strong bounce level since early 2023. Now that this zone is being tested again, the outcome could define the next major move for TrueFi. --- 🔍 Market Structure & Pattern: The pair has been moving sideways in a year-long accumulation range, hinting at a potential accumulation phase by smart money. There's a possibility of a triple bottom formation, a classic reversal signal, should price break above resistance with momentum. Although the overall trend remains bearish, selling pressure is weakening, suggesting a possible trend transition phase. --- 📈 Bullish Scenario (Reversal Potential): If price holds the support zone and confirms a bullish weekly candle: Upside Targets: 🔹 $0.0387 (First breakout level) 🔹 $0.0512 – $0.0610 (Previous distribution range) 🔹 $0.1209 – $0.1545 (Mid-term trend shift target) Potential catalysts: strong breakout volume, improving market sentiment, and weakening BTC dominance. --- 📉 Bearish Scenario (Breakdown Risk): If price fails to hold above $0.0229 and closes below on the weekly chart: Price could fall further toward the psychological level around $0.0200 or even lower. This would confirm a new lower low, continuing the broader bearish trend and possibly entering a capitulation phase. --- 🎯 Key Levels to Watch: Level Significance $0.0229 – $0.0307 Major demand zone (historical support) $0.0387 Initial resistance / bullish trigger $0.0512 & $0.0610 Previous supply zones $0.1209 & $0.1545 Mid-term reversal targets $0.2437 Long-term target if uptrend confirms --- 🔄 Conclusion: TRU/USDT is at a make-or-break point. Bulls and bears are clashing at this critical support. Will this be the start of a long-awaited reversal, or will we see a deeper breakdown? The coming weekly candles will be crucial. Smart traders will wait for clear confirmation — not just reaction. --- 🧲 Trading Strategy Ideas: Conservative Bulls: Wait for a weekly breakout above $0.0387 with volume confirmation. Aggressive Traders: Consider entry at support with tight stop-loss below $0.0225, aiming for $0.0512 short-term. Bearish Bias: Short after confirmed weekly close below support. #TRUUSDT #TrueFi #CryptoReversal #AltcoinAnalysis #SupportZone #TripleBottom #BreakoutSetup #WeeklyChart

Alpha-GoldFX

TRUUSDT is currently exhibiting a Falling Wedge Pattern, a well-known bullish formation that often signals the end of a downtrend and the beginning of a strong upward move. This pattern is characterized by descending trendlines that converge, showing reduced selling pressure and a potential shift in momentum. As TRU approaches the apex of this wedge with gradually narrowing price action, traders are closely watching for a breakout to the upside—typically a powerful signal that price could rally sharply from current levels. Volume remains healthy, which is a crucial factor when validating any breakout from a wedge formation. An uptick in volume upon breakout would serve as strong confirmation of bullish intent and increase the probability of TRUUSDT reaching its projected target. Historical breakouts from similar patterns have shown explosive gains, and in this case, the setup suggests a potential gain of 90% to 100% or more, especially if supported by broader market strength. Investor interest is steadily increasing in the TRU ecosystem, reflecting growing confidence in the project’s utility and future developments. As the token gains traction and technical indicators align in its favor, momentum traders and swing traders are identifying this as a high-potential opportunity. The structure of this wedge presents a low-risk, high-reward setup with clearly defined support and resistance levels. In summary, TRUUSDT’s falling wedge breakout scenario could be one of the more promising bullish setups currently unfolding. With strong volume dynamics, positive sentiment, and a clear pattern in play, it’s an excellent chart to keep on your radar in the coming days. ✅ Show your support by hitting the like button and ✅ Leaving a comment below! (What is You opinion about this Coin) Your feedback and engagement keep me inspired to share more insightful market analysis with you!

HamadaMark
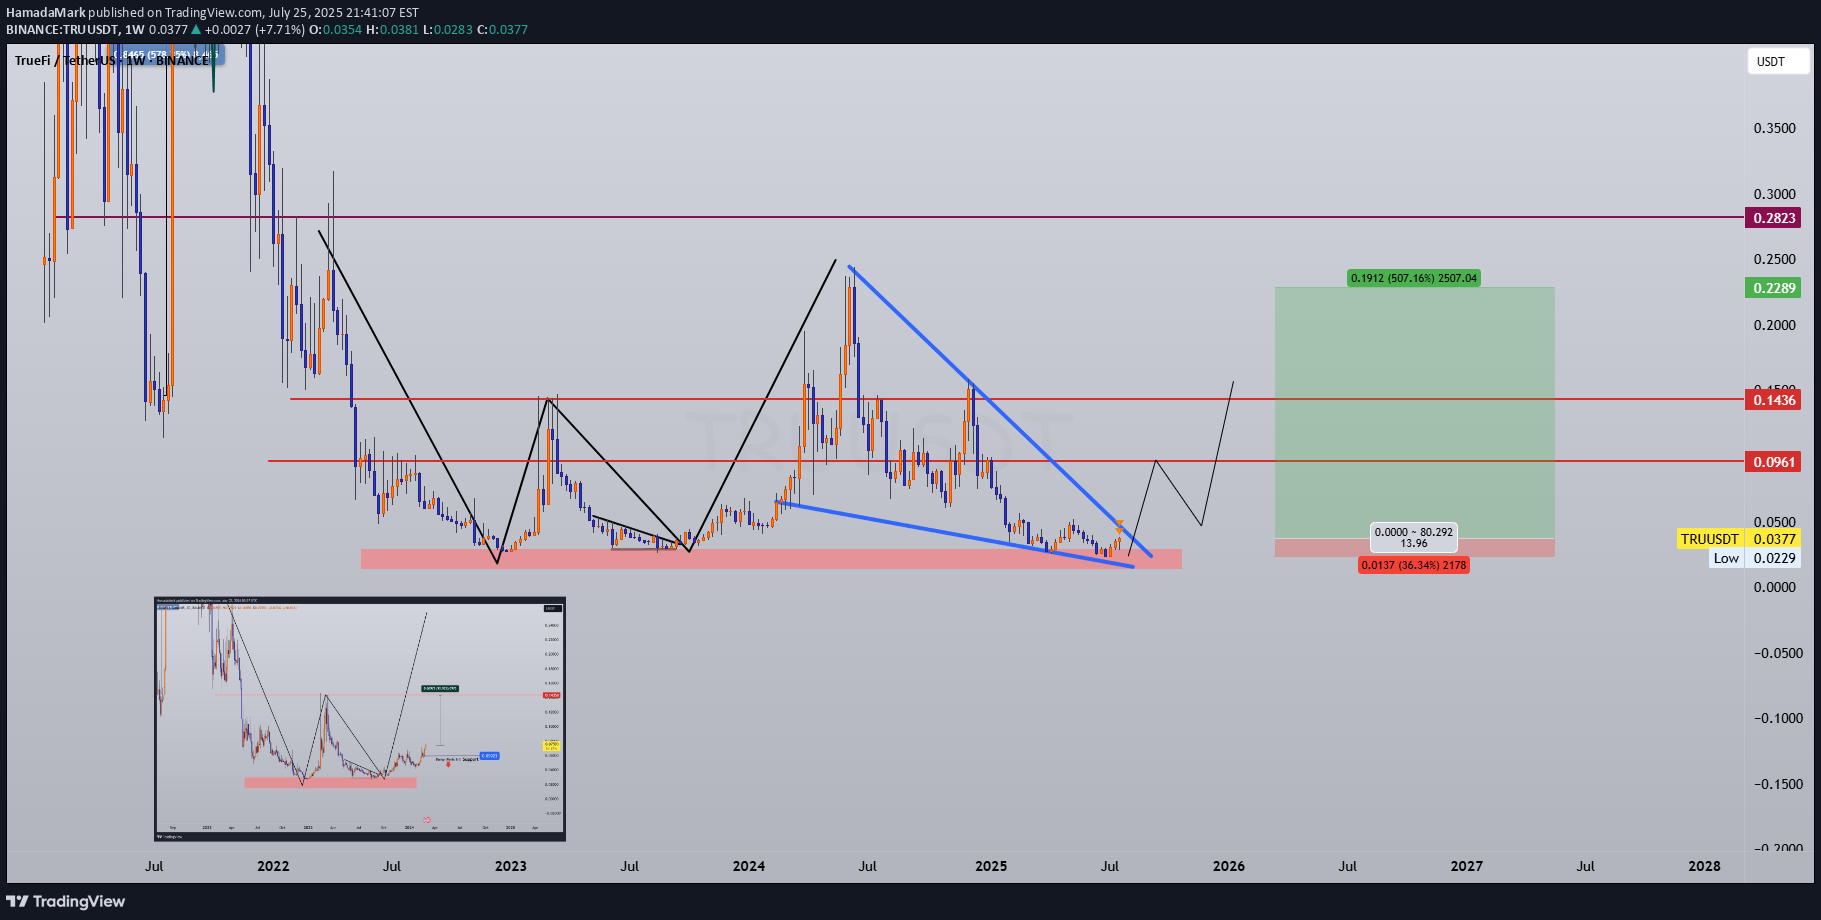
📌 Coin: TRU (TrueFi) 💰 Buy Levels: ✅ First Entry: $0.0378 ✅ Second Entry: $0.0325 ✅ Third Entry: $0.0270 🛑 Panic / SL Level: Weekly close below $0.0240 🧠 Fundamental Analysis (FA) – In Short *️⃣ Sector: DeFi / Real World Assets (RWA) Lending *️⃣ Use Case: TrueFi is a decentralized credit protocol focused on unsecured and real-world asset lending, serving institutions with on-chain transparency. *️⃣ Tech: Combines DeFi-native liquidity pools with off-chain credit assessment for borrowers. Offers tokenized credit portfolios, automated debt servicing, and risk scoring. *️⃣ Narrative Fit: Perfectly aligned with the RWA + on-chain credit markets narrative, TrueFi offers one of the few active RWA lending infrastructures in DeFi. *️⃣ Adoption: Partnered with large institutions including Archblock (formerly TrustToken), active in real-world treasury and asset-backed lending markets. *️⃣ Unique Angle: TrueFi pioneered on-chain uncollateralized lending — a rare use case bridging traditional finance (TradFi) with DeFi. 📊 Tokenomics & Market Data (As of July 2025) 🪙 Current Price: ~$0.034 🧾 Market Cap: ~$38M 🔢 Rank: ~Top 450 🧮 Circulating Supply: ~1.1B TRU 🔒 Max Supply: 1.45B TRU ⚙️ Token Use: Governance, staking, incentive alignment for underwriters and lenders 💡 Inflation: Fixed max supply, most emissions already circulated 🎯 Bull Market Target (Realistic) Target Range: $0.09 – $0.12 *️⃣ Based on revaluation of DeFi protocols aligned with RWA lending and increased institutional adoption. 🚀 Mega Bullish Target (Speculative Top) Target Range: $0.18 – $0.28+ *️⃣ If on-chain credit and RWA tokenization become core crypto narratives, TRU could be a top re-rated microcap in that sector. *️⃣ As one of the first RWA lending protocols with real integrations, it has potential to lead a sector-wide DeFi resurgence. ✅ Final Take 🧠 TRU stands out as one of the earliest movers in institutional RWA lending on-chain. Your $0.027–$0.0378 entries are deep within macro support, and the $0.024 SL offers clear protection against breakdown. Low market cap + strong narrative = explosive upside if RWA gains traction. we ask Allah reconcile and repay
CryptoAnalystSignal

#TRU The price is moving within a descending channel on the 1-hour frame and is expected to break and continue upward. We have a trend to stabilize above the 100 moving average once again. We have a downtrend on the RSI indicator that supports the upward break. We have a support area at the lower limit of the channel at 0.0285, acting as strong support from which the price can rebound. We have a major support area in green that pushed the price upward at 0.0280. Entry price: 0.0300 First target: 0.0314 Second target: 0.0328 Third target: 0.0350 To manage risk, don't forget stop loss and capital management. When you reach the first target, save some profits and then change the stop order to an entry order. For inquiries, please comment. Thank you.#TRU First target: 0.0314 Reached Second target: 0.0328 Reached Third target: 0.0350 Reached

Stoic-Trader
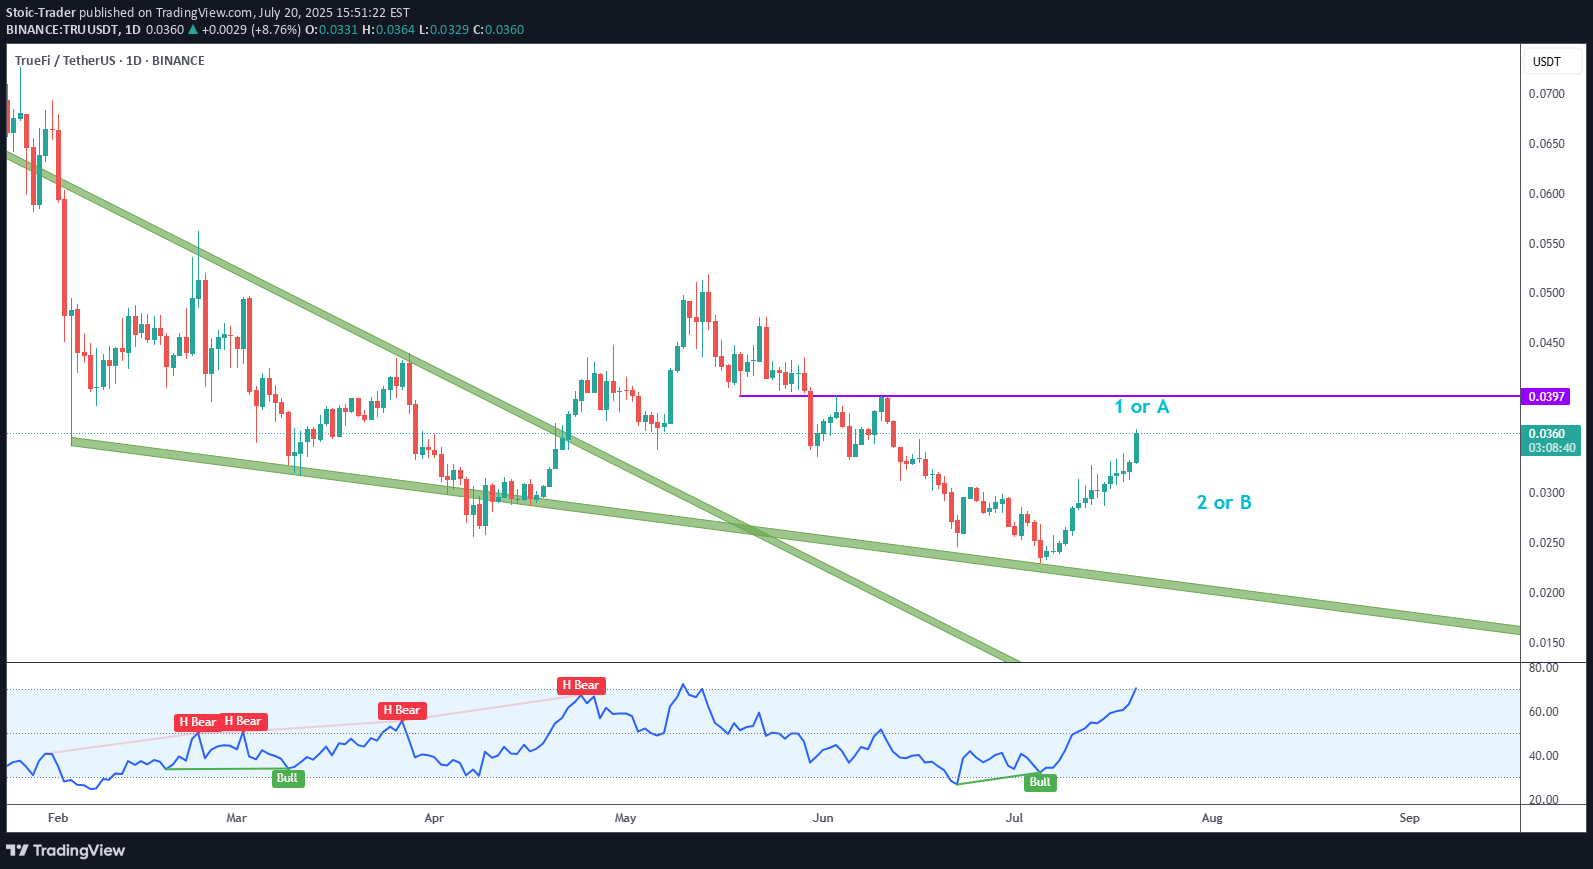
Truefi´s recent upside after touching the green descending trendline looks convincing, with a motive wave and bullish RSI divergence. I´m labeling this as wave 1/A. Right now price is overbought, so I´ll wait for wave 2/B pullback to look for long trades. Next key resistance zone is just below 0.04.

MasterAnanda
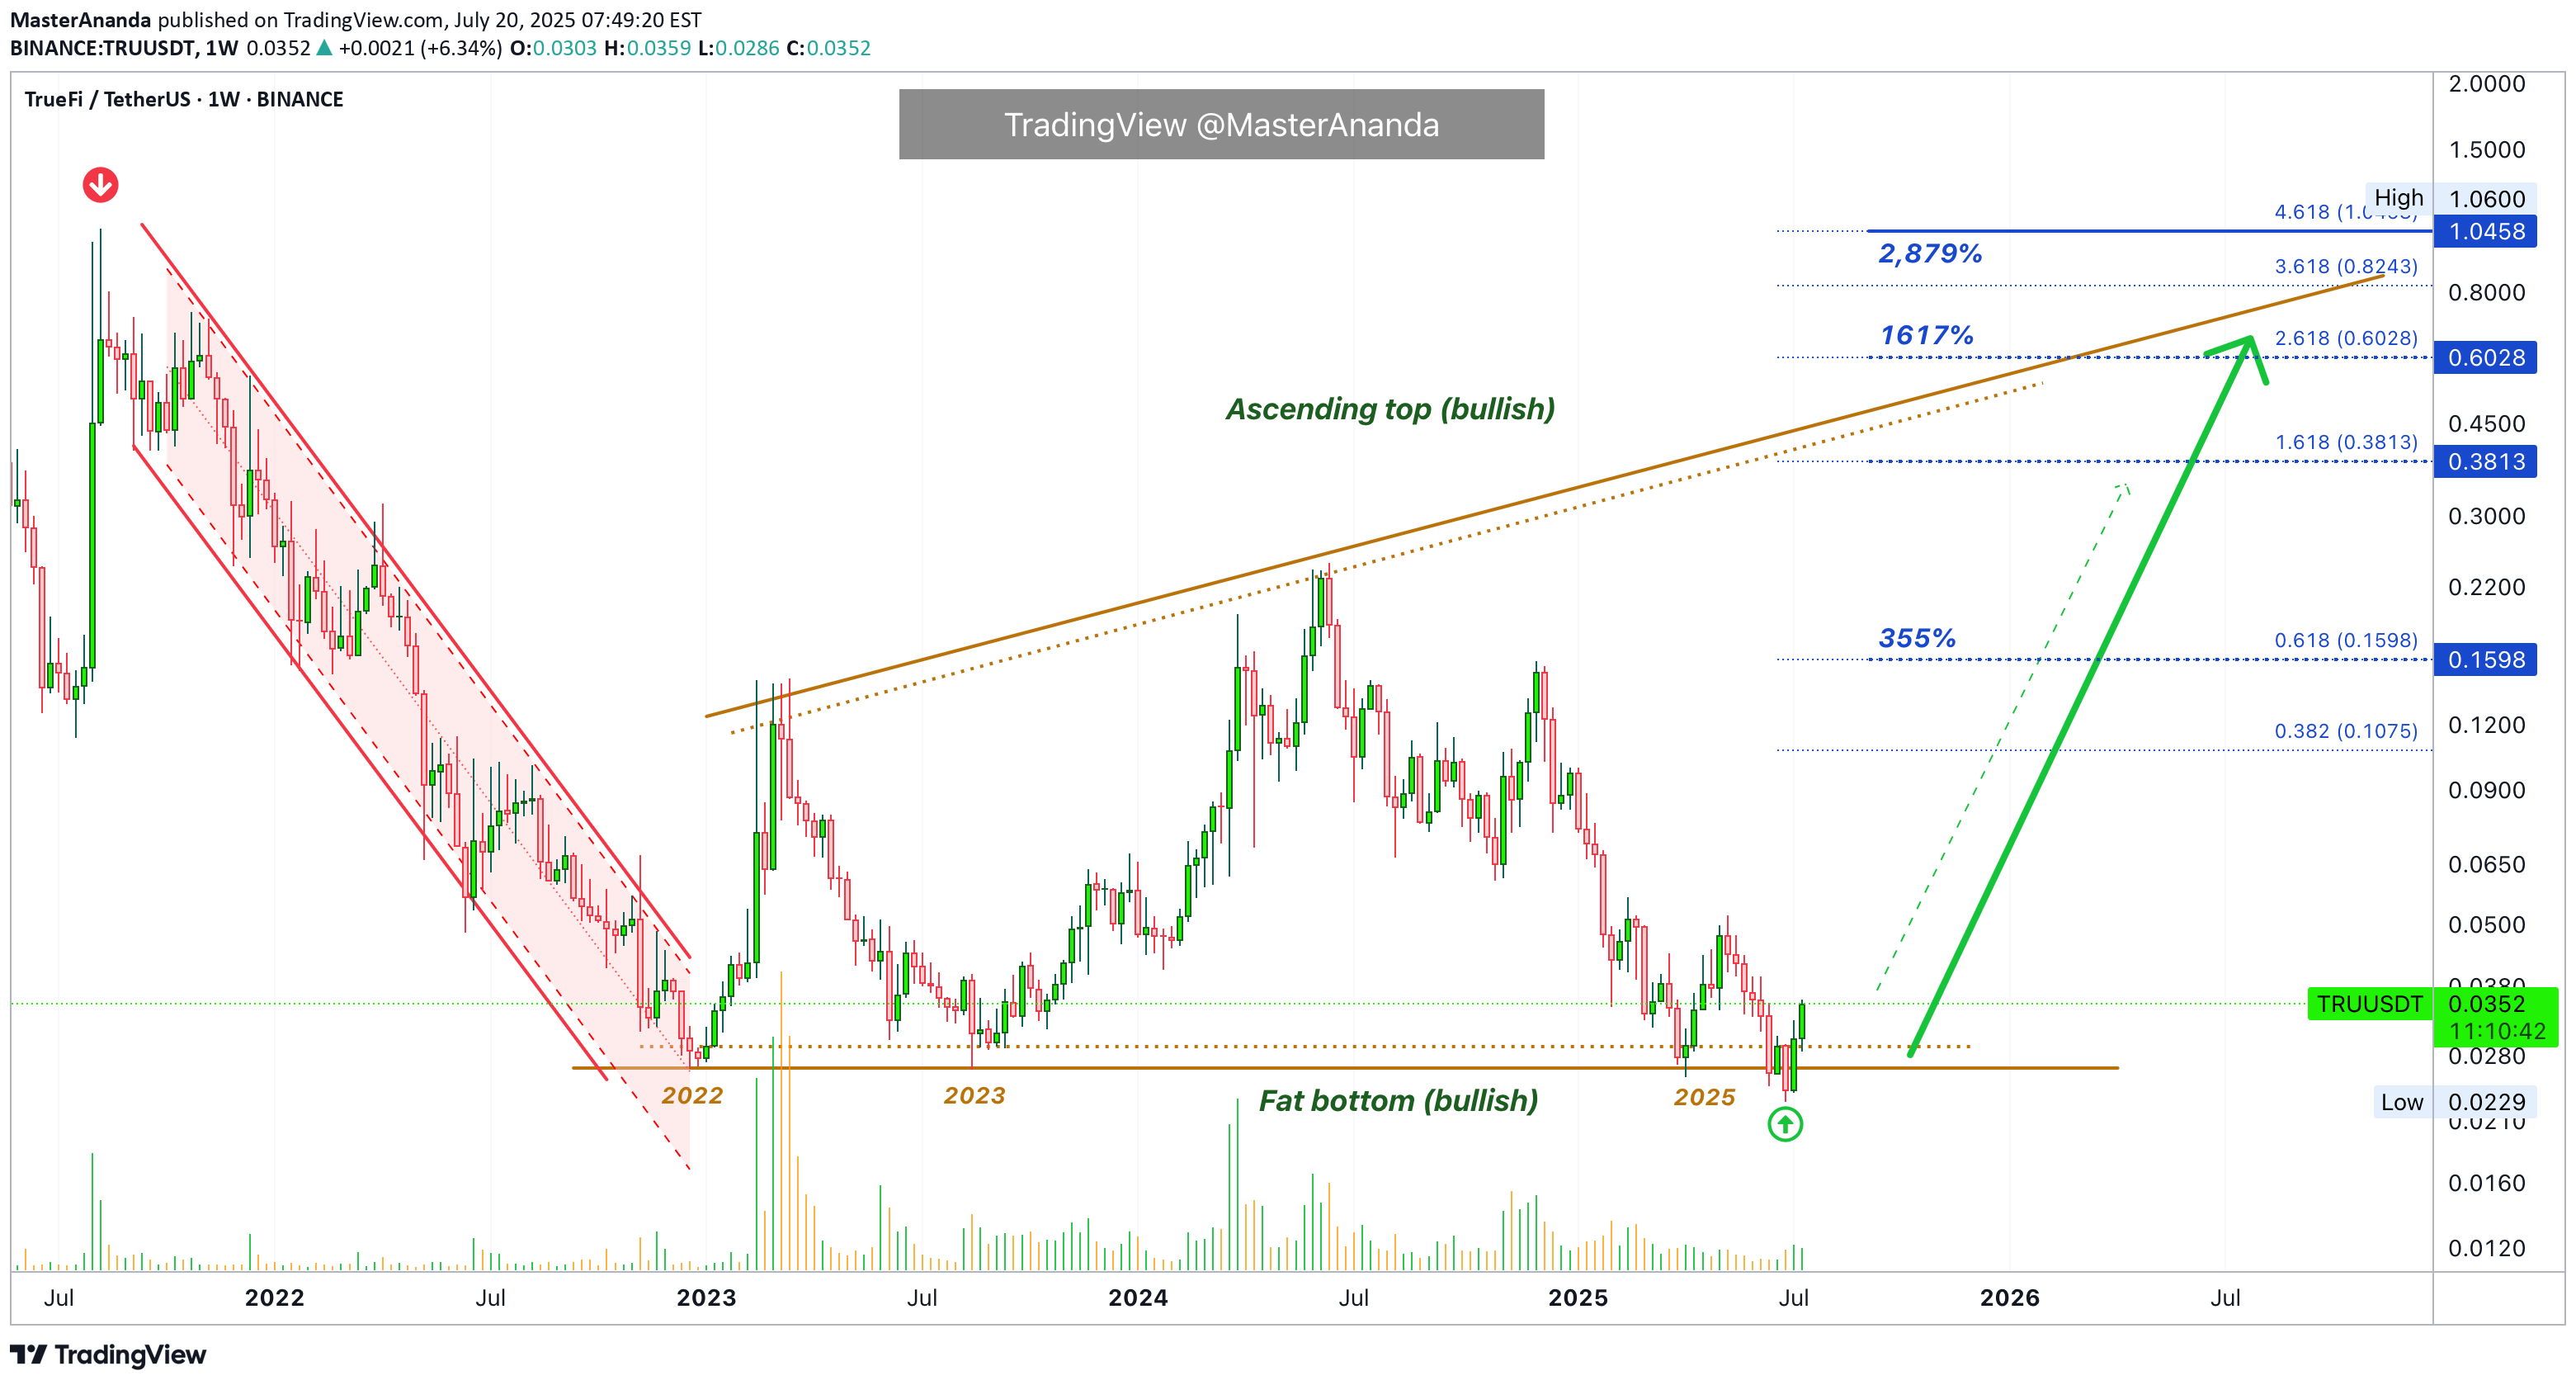
TrueFi is trading at bottom prices. Notice the big difference between this pair and the ones that are trading high, near resistance or at a new all-time high. This is the difference I want to point out to new buyers. If you are entering the market just now, you should be considering pairs like this one rather than the ones that are already pretty advanced. This is because the ones trading low/near support have more room available for growth, higher profits potential and very little risk. When prices are trading near the bottom, there isn't much room to go lower. When prices are trading high, even with marketwide bullish action, a correction can develop anytime. We look for pairs like this one to buy and hold. The second consideration is related to growth potential. While Bitcoin is awesome; Bitcoin is crypto; Bitcoin is great and is here to stay, it is already worth trillions of dollars. If everything goes amazing for Bitcoin, we might enjoy an additional 100% growth before the cycle ends. On an altcoin, in comparison, we can enjoy 1,000%, 2,000%, 3,000%, 5,000% or more. So you need to choose wisely. A whale can easily choose Bitcoin because of liquidity issues, accessibility, security, stability, accounting, long-term performance, etc. A tiny fish is better off with the altcoins market, they have more room for growth. Technical analysis The red channel reveals a downtrend, the previous bear-market. The flat bottom in the following years reveals a consolidation period, long-term. Not a downtrend but creating a base. From the bottom we grow. TRUUSDT is no longer bearish, moving down, instead it accumulated for years and now that this accumulation phase is over we are ready for massive growth. We witnessed first a downtrend, then sideways (consolidation) and now comes an uptrend. These are the only three ways in which the market can move. Down—neutral—up. The logical next step after a downtrend is always a sort of transition period, after this transition the uptrend starts. We will have an uptrend now, this is what we call a "bull market." Higher highs and higher lows." If you enjoy the content, you can always follow for more. It is easy and free and you get to receive updates every time I publish a new article. Thanks a lot for your continued support. Namaste.
Disclaimer
Any content and materials included in Sahmeto's website and official communication channels are a compilation of personal opinions and analyses and are not binding. They do not constitute any recommendation for buying, selling, entering or exiting the stock market and cryptocurrency market. Also, all news and analyses included in the website and channels are merely republished information from official and unofficial domestic and foreign sources, and it is obvious that users of the said content are responsible for following up and ensuring the authenticity and accuracy of the materials. Therefore, while disclaiming responsibility, it is declared that the responsibility for any decision-making, action, and potential profit and loss in the capital market and cryptocurrency market lies with the trader.