
Stoic-Trader
@t_Stoic-Trader

What symbols does the trader recommend buying?
Purchase History
پیام های تریدر
Filter
Stoic-Trader
BTC Correction targeting 100k?
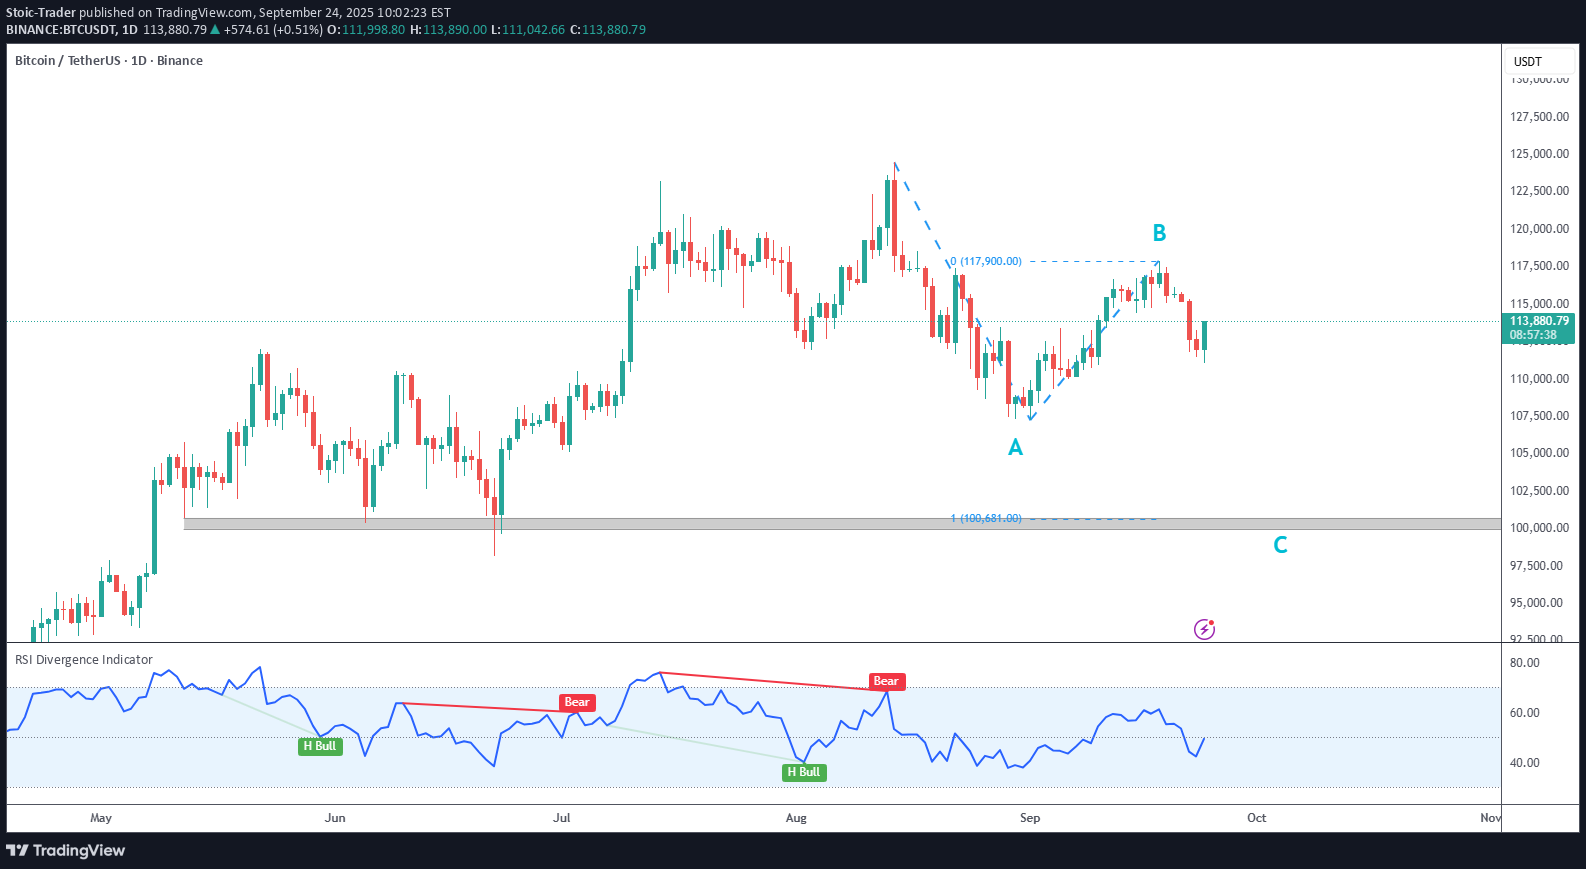
> Bitcoin is showing bearish RSI divergence on the August high, while the recent low shows no divergence, signaling potential weakness in momentum. > I´m interpreting the current structure as an ABC correction, which may still be unfolding. > The 100% Fibonacci extension aligns with the key psychological support at $100k, making it a high-probability target if the correction continues. > The $115k level could act as resistance, setting the stage for further downward legs.
Stoic-Trader
XRP/USDT: Wave 5
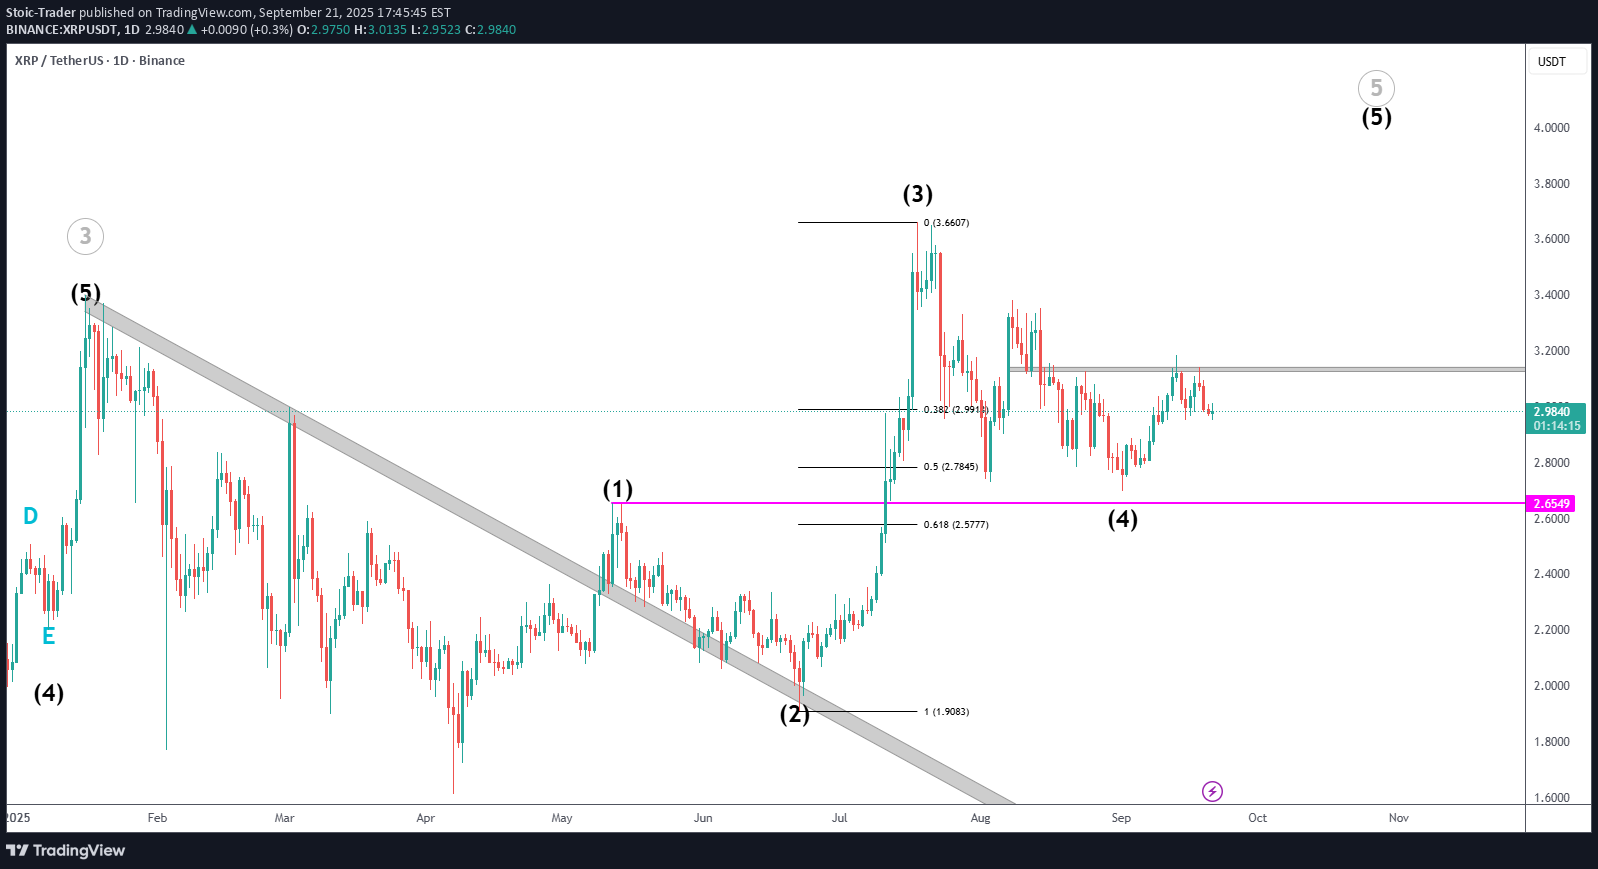
> Primary wave count: XRP is currently in black wave 5, with a target near $4.00 or higher. > Validation level: This count remains valid as long as price stays above wave 1 high at $2.6549. > Current resistance: Price is facing resistance at the $3.15 level (gray zone). > Breakout signal: A move above $3.15 would signal strong bullish momentum.
Stoic-Trader
HBAR: Head & Shoulders

Head and Shoulders breakdown confirmed: HBAR broke below the neckline on the 4H chart, now retesting the former support as resistance. Bearish retest in progress: The neckline (green level) is acting as resistance, reinforcing the potential for continued downside. First target in sight: A drop toward the 100% measured move extension projects a target at 0.19675. Deeper decline possible: If momentum builds, the move could extend toward the red supply zone near the psychological level of 0.1500. Bias remains bearish below the neckline: As long as price holds under the retest zone, short setups remain favored on lower timeframes.
Stoic-Trader
BTC/USDT: Wave V warming up
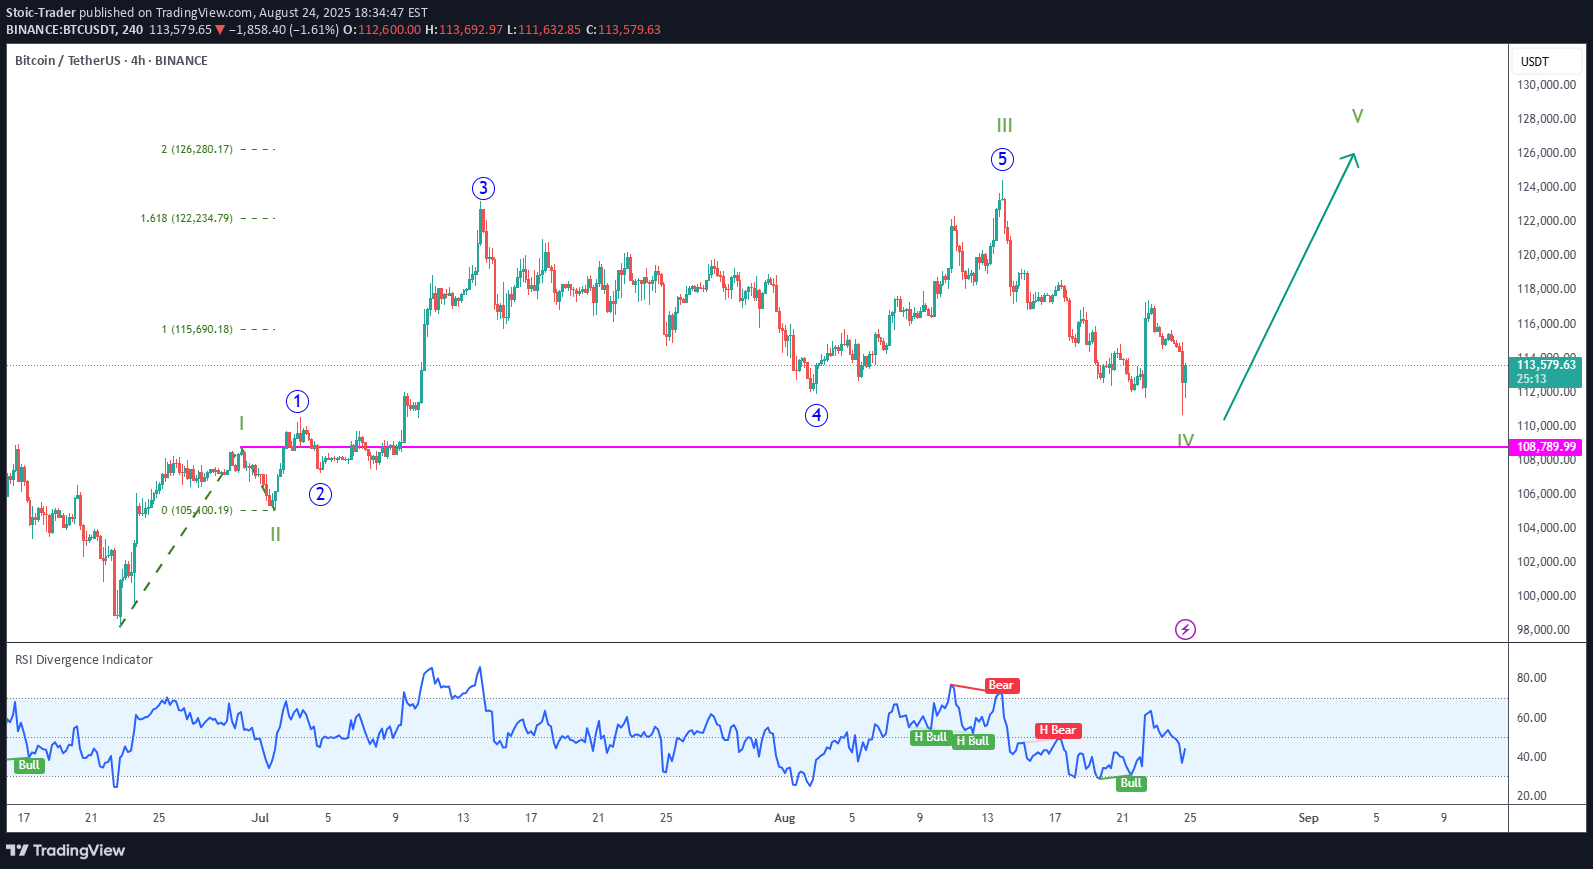
> Wave count structure: Current analysis places BTC in green wave V, with wave IV confirmed as valid as long as price stays above 108,790. > RSI support: Presence of bullish RSI divergence reinforces the case for wave IV completion and the start of a new impulsive leg higher. > Key invalidation level: A break below 108,790 would invalidate this count and suggest a deeper correction or alternate structure is in play. > Target projection: If the current wave V unfolds as expected, the bullish target is a new all-time high above 124,000. > Setup bias: As long as BTC holds above support and RSI maintains divergence, traders may consider buying pullbacks with stops below 108,790 in anticipation of trend continuation.
Stoic-Trader
LQTY Upside continuation
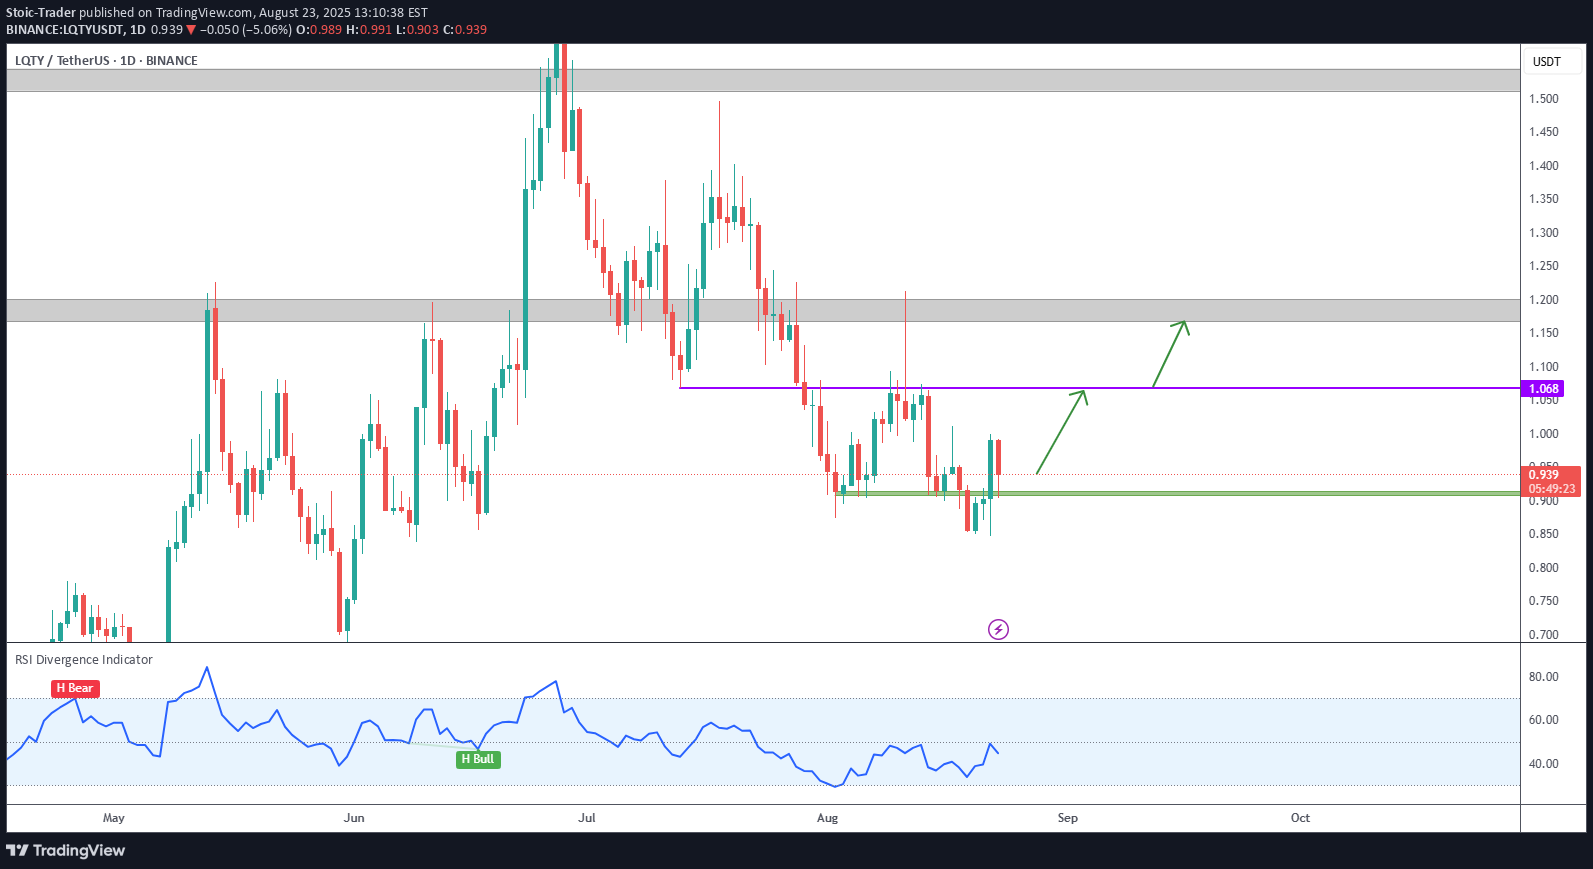
>> Bullish RSI divergence: RSI is rising while price made a lower low—this suggests a potential reversal from the recent downtrend. >> Support zone holding: Price has rejected the $0.910–$0.920 support multiple times, reinforcing the area as a base for a potential upward move. >> Entry setup: Current structure offers a clear long opportunity with manageable risk, supported by both RSI and price action. >> Target 1: Initial upside target lies at the $1.068 resistance (purple line), a key level tested multiple times before breakdown. >> Target 2: If momentum continues, second target is the $1.18–$1.20 resistance zone (gray band), where prior rallies have topped out.
Stoic-Trader
ETH/USDT: Final stages of Wave 3
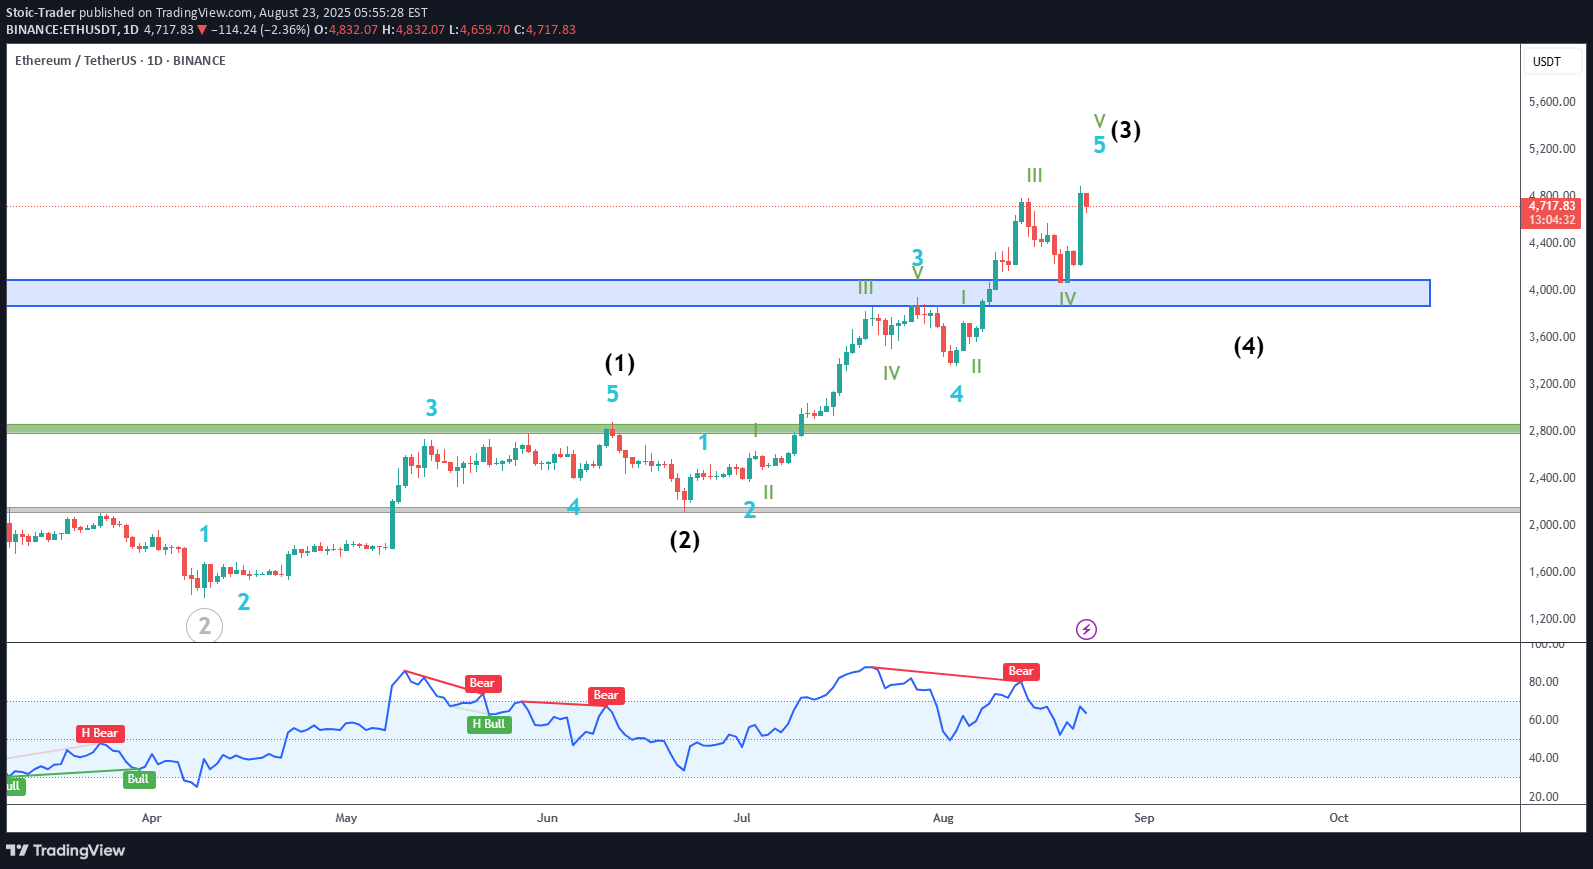
> Wave structure: ETH appears to be completing black wave (3), with signs pointing to an imminent wave (4) corrective move. > RSI warning: Bearish RSI divergence suggests weakening momentum—typical before a wave (4) pullback. > Wave (4) target zone: Correction likely into $3,800–$4,000, aligning with previous structure and acting as a potential accumulation zone. > Strategy: Wait for a pullback into the blue zone to accumulate on weakness, aiming for a breakout toward black wave (5).
Stoic-Trader
CRV Still Correcting
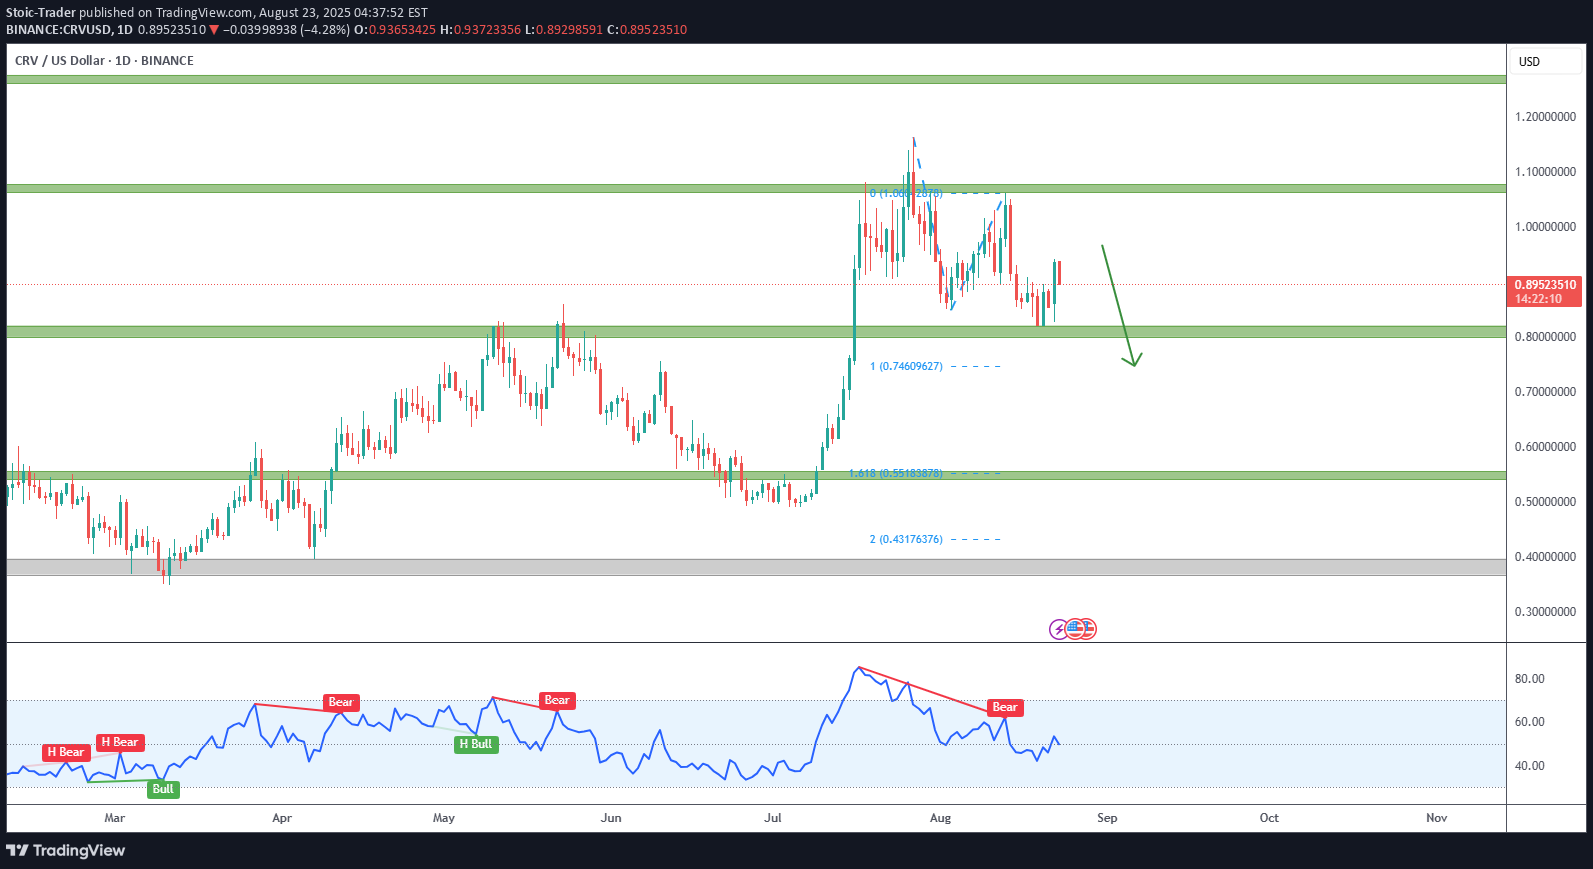
I don´t see the short pump generated by Powell´s speech as a major momentum change catalyst. Bearish divergence on RSI: In early August, RSI formed lower highs while price pushed to higher highs—signaling fading bullish momentum. RSI has continued to drift lower since, confirming weakness. No bullish divergence at recent lows: Recent drops toward the $0.80 support were not accompanied by RSI divergence. Both price and RSI made equal or lower lows, indicating no hidden buying strength. 100% Fibonacci extension target: The 100% extension of the previous bearish leg points to $0.746 as a likely next downside target if support fails. Strong resistance overhead: Price has been rejected three times from the $1.00–$1.05 zone, marking it as a key supply area. Bears retain control unless bulls break and sustain above this level.
Stoic-Trader
MANA/USDT: Expecting a retest of support
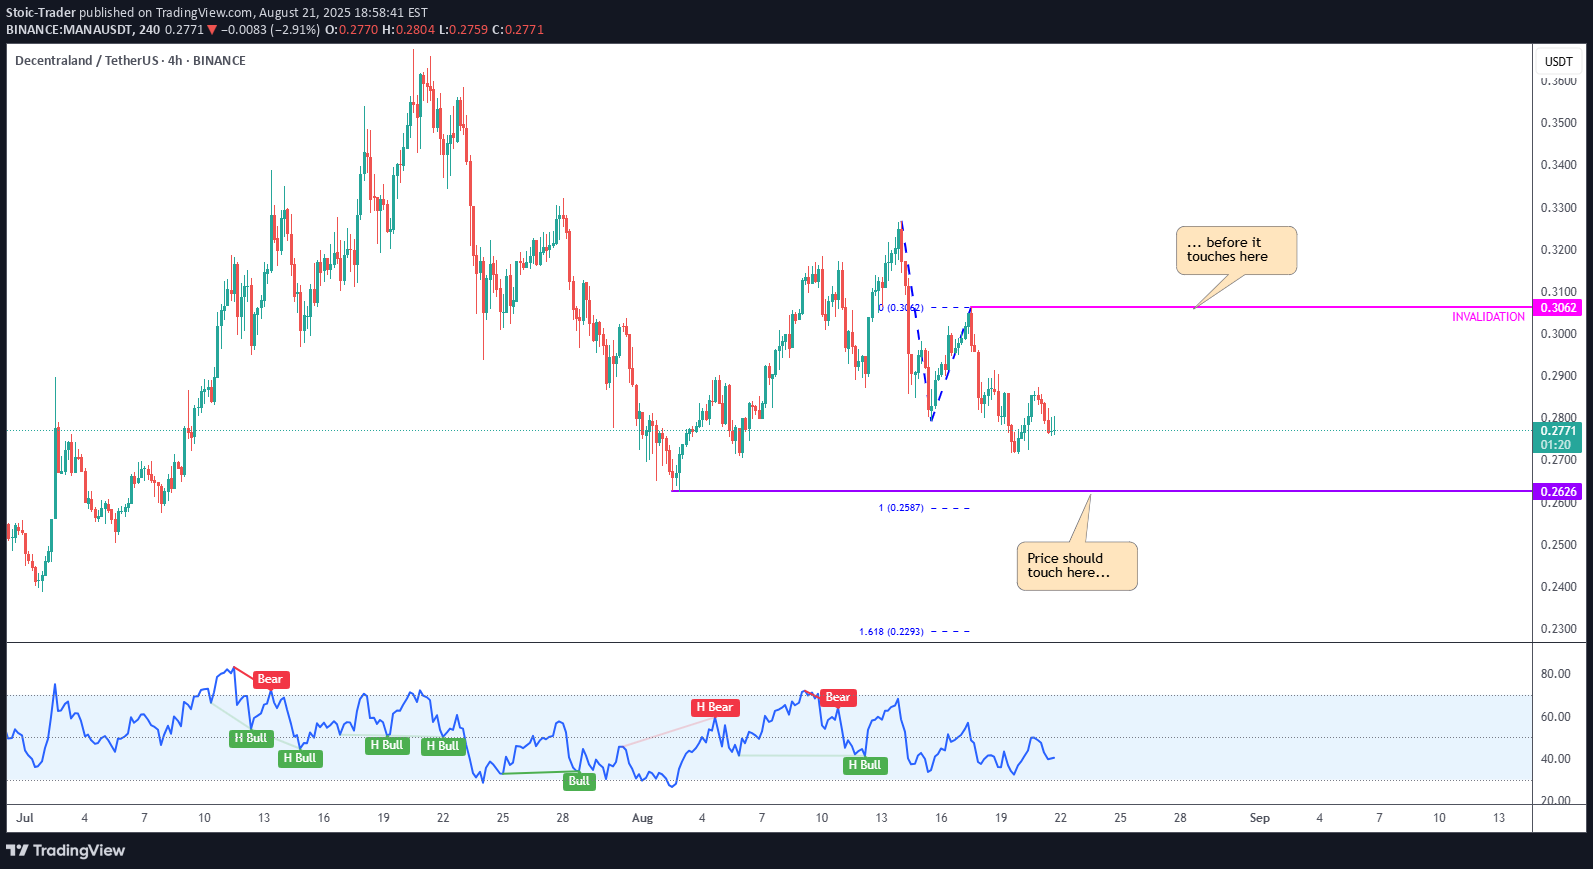
MANA remains in a downtrend, with no clear signs of reversal yet. Further downside is expected, targeting a retest of 0.2626 before a possible higher high above 0.3062. No bullish RSI divergence appeared on the August low, reducing the chances of an immediate recovery. Bearish RSI divergence was present on the August high, reinforcing the bearish outlook. A potential 100% extension points to 0.2587 as a strong downside projection level.
Stoic-Trader
AVAX/USDT: Expect further downside
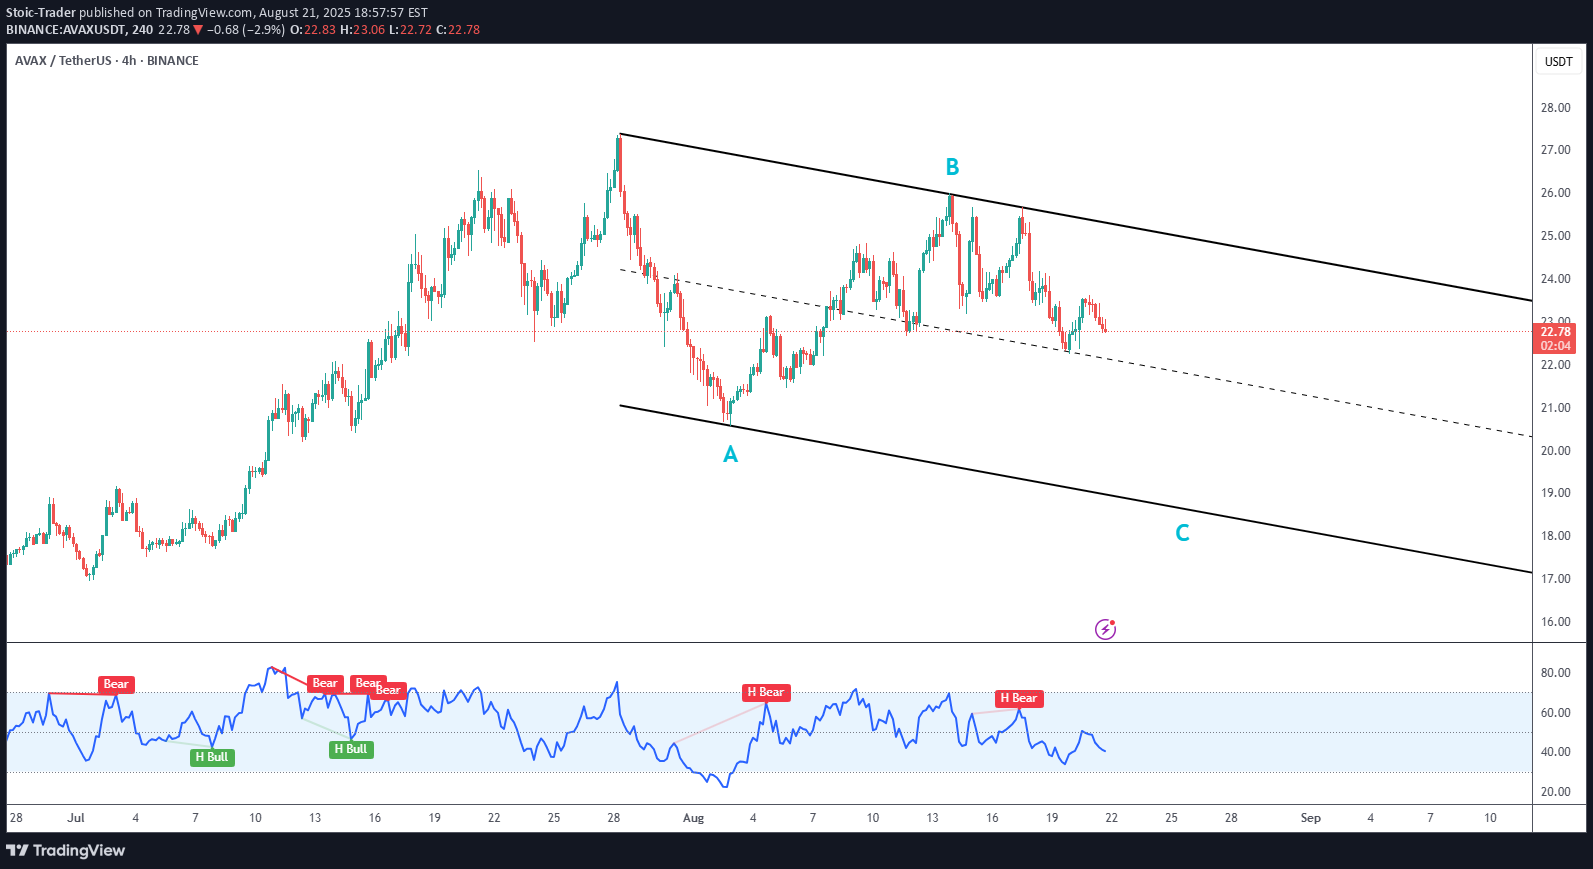
Trend structure: Price is moving within a descending channel, forming an A–B–C corrective structure. Momentum: RSI shows multiple hidden bearish divergences, supporting continuation of the downtrend. Channel targets: Midline near 21.0 (already tested), and lower bound between 17.0–17.5 as the primary downside objective. Confirmation: Channel structure has held since early August, with repeated hidden RSI divergences and price rejection at 25.0. Bias: Downtrend continuation is expected until price hits channel support. Key levels: Bearish outlook is valid while price remains below 25.0. A break below 21.0 could trigger a sharp move toward 17.5.
Stoic-Trader
DYDX : Further downside expected

▶️ DYDX remains stuck inside the black descending channel, and the recent breakout attempt was just a fakeout. ▶️ On the 4H chart, there are no clear signs of a reversal, so the recent upside move appears to be corrective. ▶️ The yellow zone, marked by a confluence of Fibonacci levels and mid-range resistance, is a key area to monitor for potential downside reversals on lower timeframes. ▶️ If a reversal plays out, the first target would be a retest of the 0.5200 low.
Disclaimer
Any content and materials included in Sahmeto's website and official communication channels are a compilation of personal opinions and analyses and are not binding. They do not constitute any recommendation for buying, selling, entering or exiting the stock market and cryptocurrency market. Also, all news and analyses included in the website and channels are merely republished information from official and unofficial domestic and foreign sources, and it is obvious that users of the said content are responsible for following up and ensuring the authenticity and accuracy of the materials. Therefore, while disclaiming responsibility, it is declared that the responsibility for any decision-making, action, and potential profit and loss in the capital market and cryptocurrency market lies with the trader.