
SYN
Synapse
| تریدر | نوع سیگنال | حد سود/ضرر | زمان انتشار | مشاهده پیام |
|---|---|---|---|---|
No results found. | ||||
Price Chart of Synapse
سود 3 Months :
سیگنالهای Synapse
Filter
Sort messages by
Trader Type
Time Frame

behdark
SYN Analysis (4H)
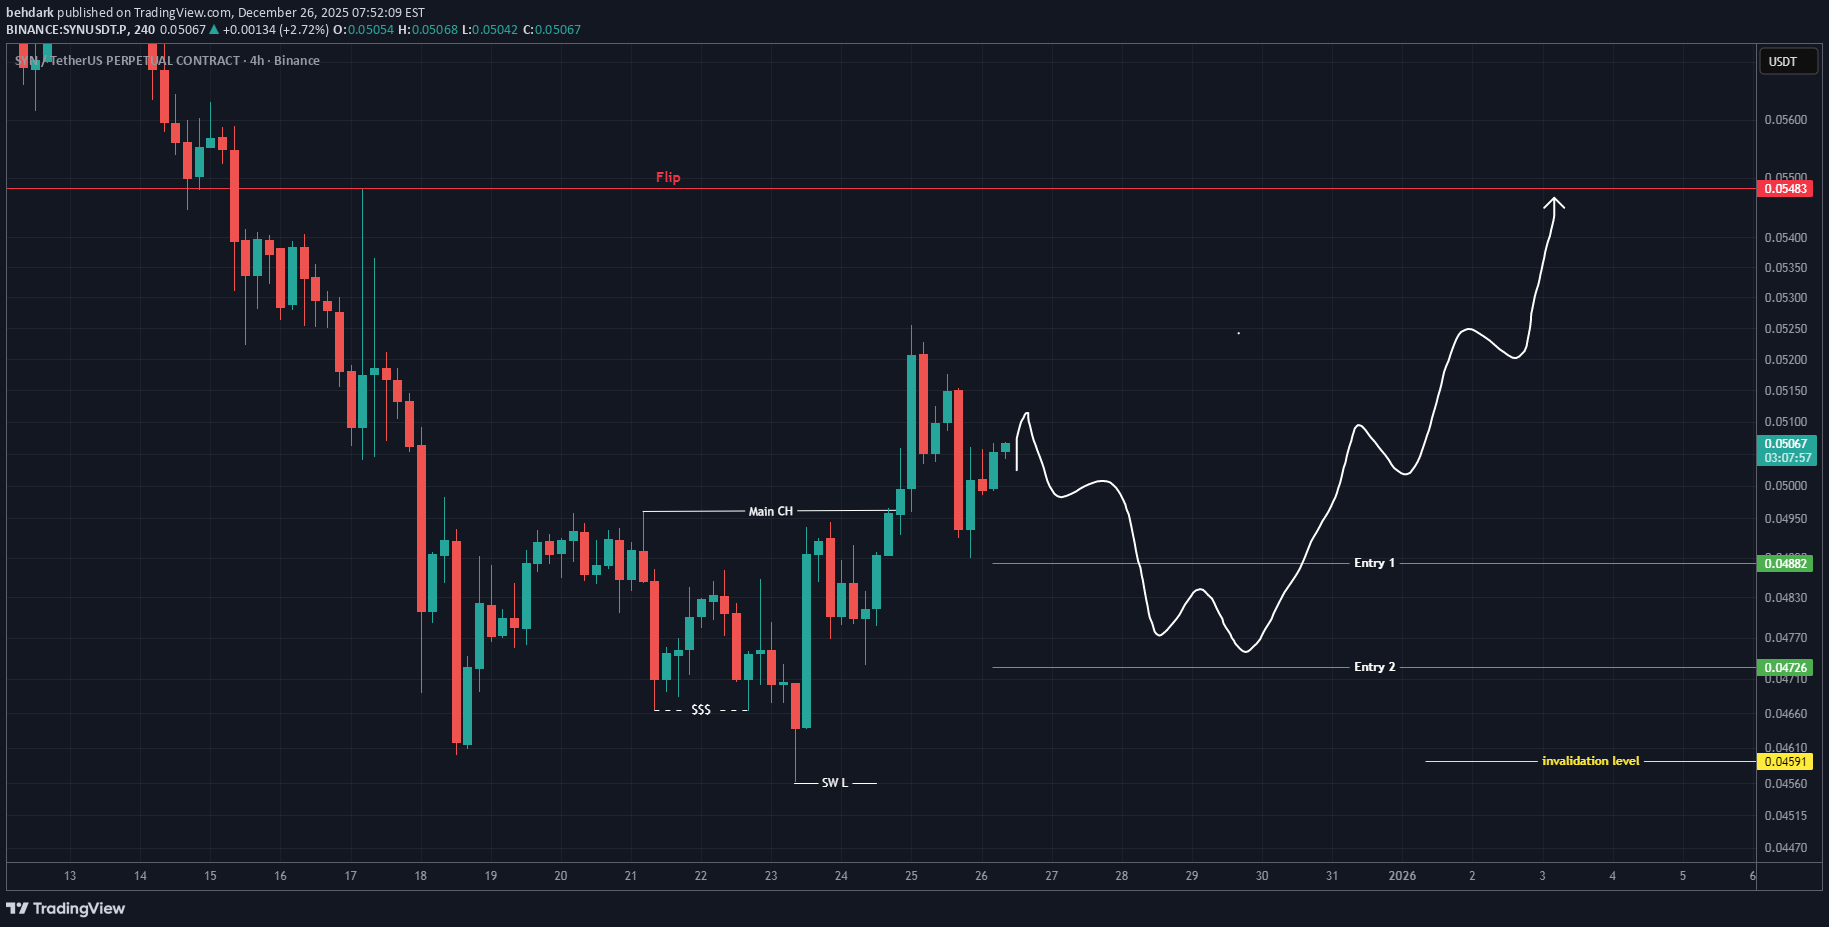
Considering the sweep of the liquidity pool, a strong CH, and the creation of higher lows, the price structure appears bullish. Therefore, we are looking for a long/buy position in the demand zones. We have two entry points, and if the price pulls back, we will enter the position. The targets are marked on the chart. A daily candle closing below the invalidation level will invalidate this analysis. For risk management, please don't forget stop loss and capital management When we reach the first target, save some profit and then change the stop to entry Comment if you have any questions Thank You

Alpha-GoldFX
SYNUSDT Forming Falling Wedge
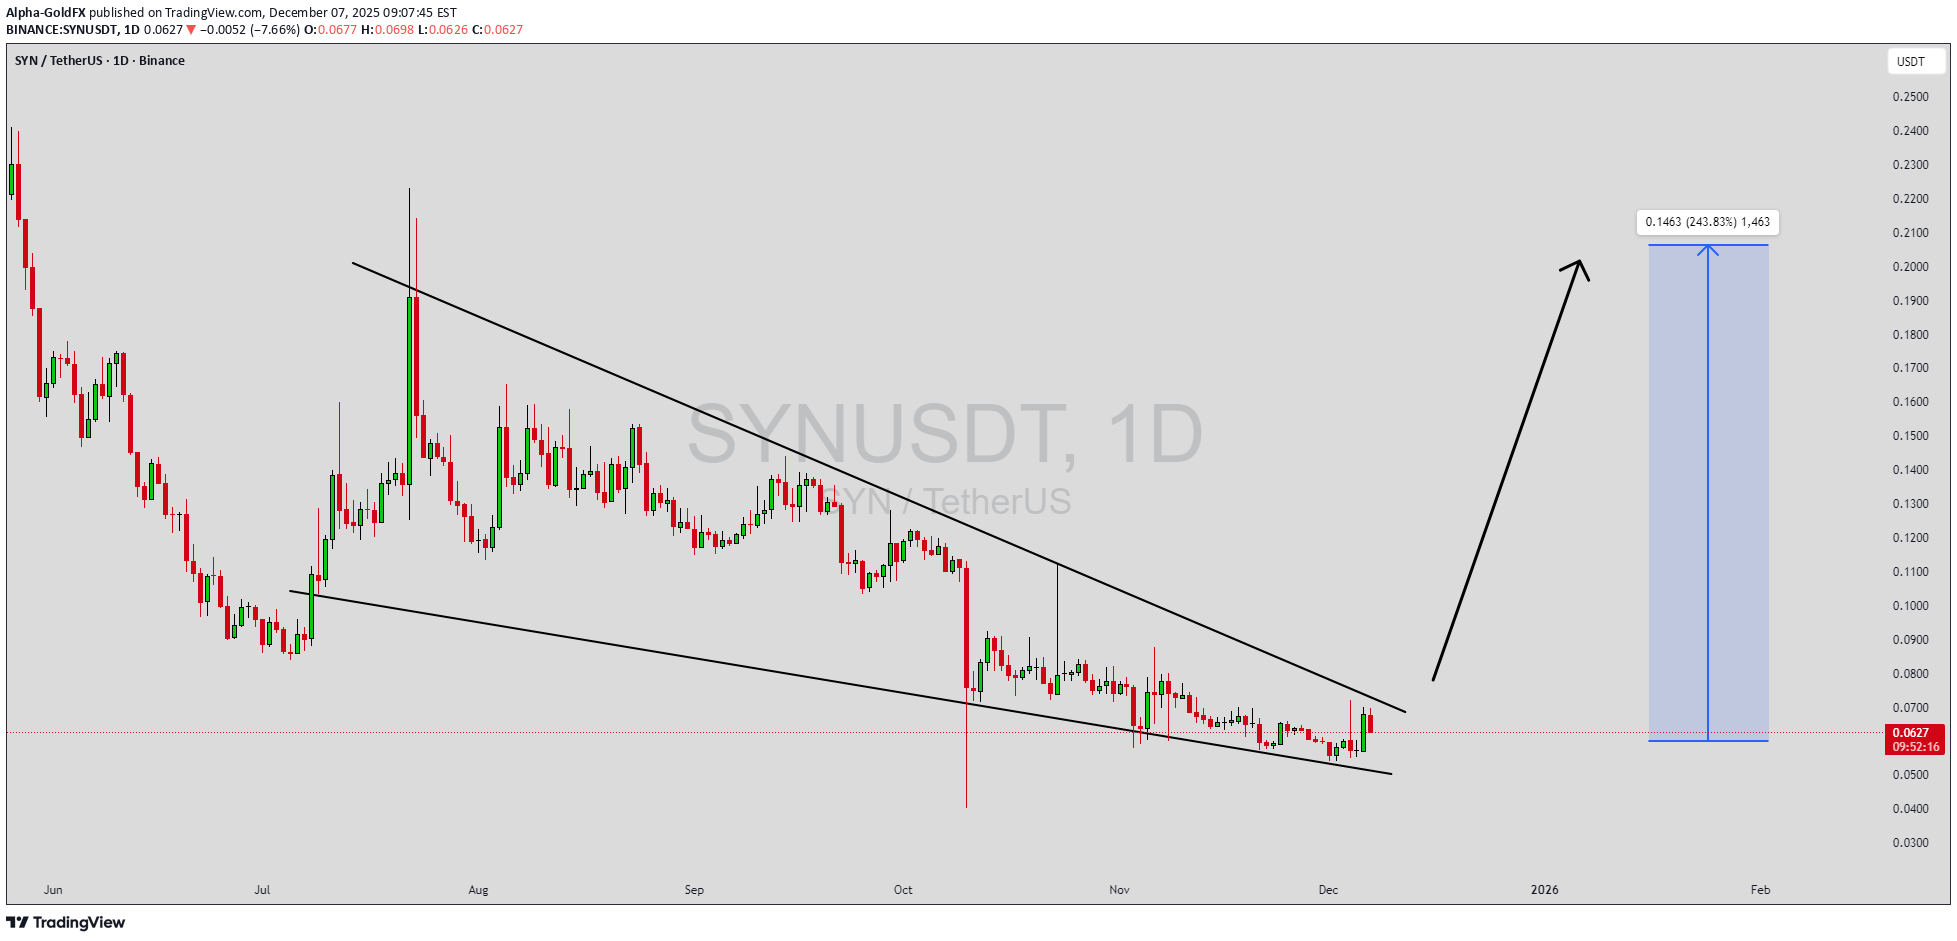
SYNUSDT is forming a clear falling wedge pattern, a classic bullish reversal signal that often indicates an upcoming breakout. The price has been consolidating within a narrowing range, suggesting that selling pressure is weakening while buyers are beginning to regain control. With consistent volume confirming accumulation at lower levels, the setup hints at a potential bullish breakout soon. The projected move could lead to an impressive gain of around 190% to 200% once the price breaks above the wedge resistance. This falling wedge pattern is typically seen at the end of downtrends or corrective phases, and it represents a potential shift in market sentiment from bearish to bullish. Traders closely watching SYNUSDT are noting the strengthening momentum as it nears a breakout zone. The good trading volume adds confidence to this pattern, showing that market participants are positioning early in anticipation of a reversal. Investors’ growing interest in SYNUSDT reflects rising confidence in the project’s long-term fundamentals and current technical strength. If the breakout confirms with sustained volume, this could mark the start of a fresh bullish leg. Traders might find this a valuable setup for medium-term gains, especially as the wedge pattern completes and buying momentum accelerates. ✅ Show your support by hitting the like button and ✅ Leaving a comment below! (What is your opinion about this Coin?) Your feedback and engagement keep me inspired to share more insightful market analysis with you!

Bithereum_io
SYNUSDT 1D
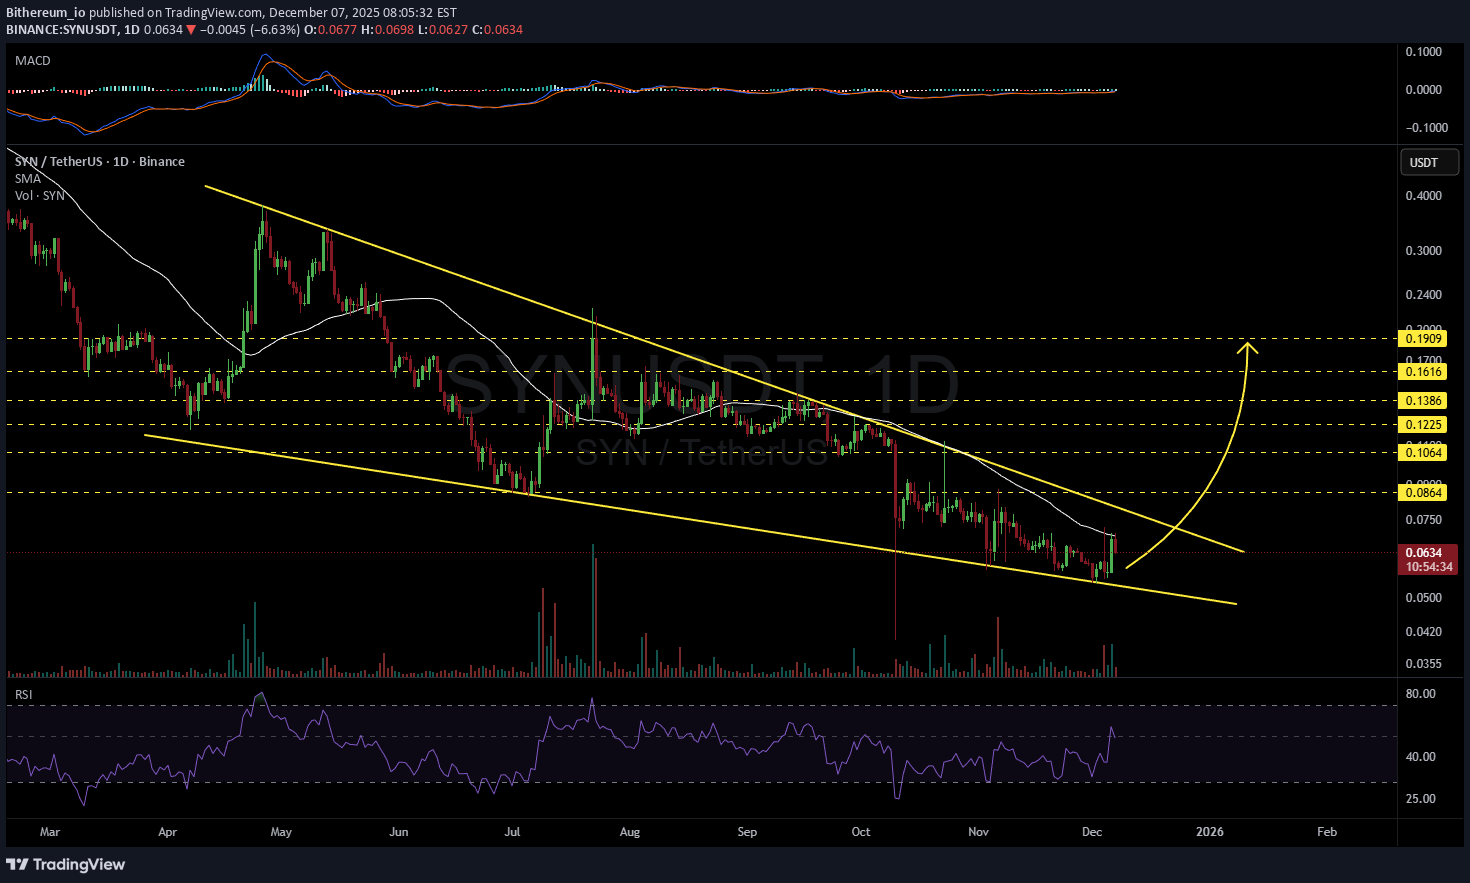
#SYN is moving inside a falling wedge on the daily chart. It has been rejected from the daily SMA50 and may retest the wedge support line. In case of a bounce from the support and a breakout above the pattern, the potential targets are: 🎯 $0.0864 🎯 $0.1064 🎯 $0.1225 🎯 $0.1386 🎯 $0.1616 🎯 $0.1909 ❌ Invalidation: a daily candle closing below the wedge. ⚠️ Always remember to use a tight stop-loss and maintain proper risk management.

vipsy6
تحلیل تکنیکال سهم SYN: سطوح خرید کلیدی و اهداف قیمتی (با نمودار)

Key buying levels for SYN is given on the chart. Possible targets are also given. NFA DYOR.
Bithereum_io
SYNUSDT 1D

Consider buying some #SYN here and near the support zone. In case of a breakout above the descending resistance and the daily SMA100, the potential targets are: 🎯 $0.1284 🎯 $0.1558 🎯 $0.1780 🎯 $0.2002 🎯 $0.2318 🎯 $0.2720 ⚠️ Always remember to use a tight stop-loss and follow proper risk management.

BitcoinGalaxy


Captain-MAO
SYN/USDT – Bullish Structure & Key Reversal Zone

is forming a clean bullish structure, with the first leg of the reversal starting from the $0.12 zone, which acted as a key pivot level. A recent liquidity sweep below $0.12 has now been fully reclaimed, suggesting strong buyer presence and a confirmed reversal signal. With price stabilizing above this reclaimed zone, SYN is showing early signs of building momentum for the next leg higher. Holding above $0.12 may pave the way for continuation and potential trend acceleration.

Innotrade_AJ
SYNUSDT: Breaking Long-Term Downtrend, Poised for a Major Rally?

Firstly, our Algo-based indicators are used to create this analysis. Follow me so you don't miss, Boost and leave your comments if you profited with our posts, so we may continue: This daily chart for SYNUSDT showcases a significant technical development as the price appears to be breaking out of a multi-month descending channel, signaling a potential major trend reversal. Analysis: Descending Channel Breakout: The price has been confined within a clear descending channel for most of the year. The recent price action shows a decisive push above the upper boundary of this channel. It is currently consolidating right above this broken trendline, which is a classic "breakout-and-retest" pattern. Key Support: The current price is finding support at the 23.6% Fibonacci retracement level (around $0.1212). A successful hold above this level would reinforce the bullish breakout. Momentum Indicator: The Innotrade MC Signal at the bottom provides strong confluence. The indicator is sharply rising from the oversold "BUY" zone in a pattern labeled "V-Band Rising," which suggests a powerful burst of bullish momentum from a bottom. Price Projection and Targets: The illustrated price path anticipates a strong upward move following this retest phase. The first major area of resistance to watch is the zone between the 61.8% Fib level (0.2147) 𝑎 𝑛 𝑑 𝑡 ℎ 𝑒 78.6, (0.2147). This area also contains a previous order block (LSOB) and the EMA 200. Target 1: is explicitly marked at $0.2777. Higher targets based on Fibonacci extensions are noted at $0.5709 and above for the longer term. Strategy: Position : Long (Buy) Entry: The current price level, retesting the broken channel trendline (around $0.12 - $0.14), presents a strategic entry point. Targets: The initial primary target is $0.2777, with further long-term potential if bullish momentum is sustained. Conclusion: The combination of a breakout from a long-term bearish structure, a successful retest of support, and powerful momentum indicators suggests that SYNUSDT could be at the beginning of a new, significant uptrend. The current price offers a favorable risk-to-reward entry for a move towards the identified targets. Disclaimer: This analysis is for educational purposes only and should not be considered financial advice. Always conduct your own research and manage risk appropriately.
Alpha-GoldFX
SYNUSDT Forming Falling Wedge
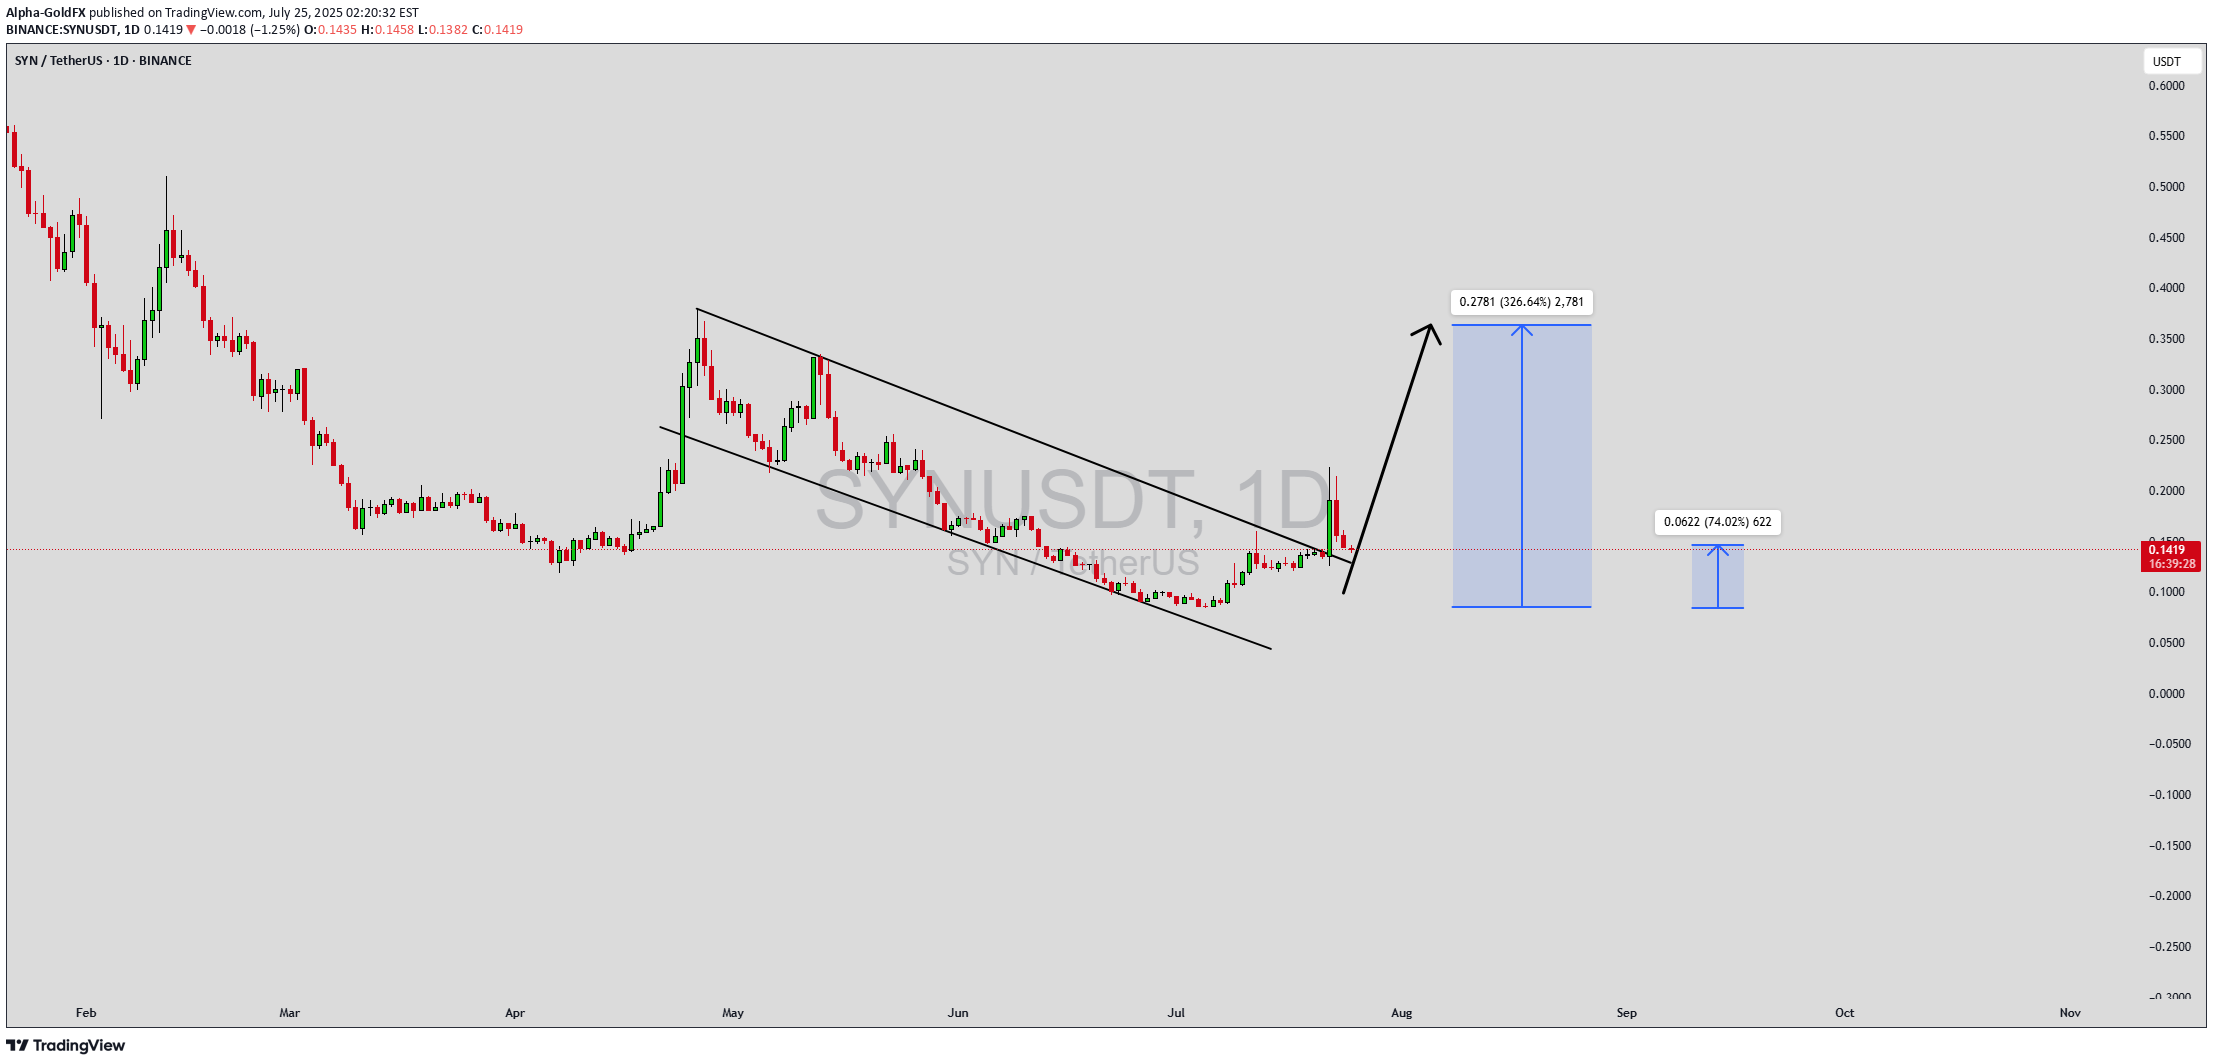
SYNUSDT is currently exhibiting a falling wedge pattern, a classically bullish structure that often precedes a breakout to the upside. This setup forms when price action contracts between two downward-sloping trend lines, indicating a slowing of selling momentum and the potential for a strong reversal. As SYNUSDT trades within this narrowing range, increasing investor interest and a notable uptick in volume suggest that a breakout could be on the horizon. A falling wedge pattern, when supported by good volume, often signals accumulation by smart money ahead of a bullish reversal. With SYN (Synapse) being a prominent player in the cross-chain interoperability and bridging space, the project continues to attract both retail and institutional attention. The expected gain of 290% to 300% aligns with previous breakout behaviors seen from similar wedge patterns in SYN’s trading history. As the crypto market gradually recovers from recent volatility, assets with solid use cases and active development teams are likely to outperform—and SYN fits that profile. Technical indicators such as RSI and MACD are showing early signs of a reversal, supporting the bullish bias. A confirmed breakout above the upper trendline with a sustained volume increase could trigger a swift rally, reclaiming previous resistance zones and offering traders an attractive risk-to-reward ratio. The 4H and daily charts suggest momentum is building, which makes this a key watchlist candidate in the short term. With its real-world utility in DeFi infrastructure and increasing partnerships, SYN is becoming a cornerstone for multichain liquidity transfers. SYNUSDT may be poised for a meaningful upward move if this falling wedge pattern completes successfully. ✅ Show your support by hitting the like button and ✅ Leaving a comment below! (What is You opinion about this Coin) Your feedback and engagement keep me inspired to share more insightful market analysis with you!

UmutTrades
SYNUSDT: Mid-Term Analysis
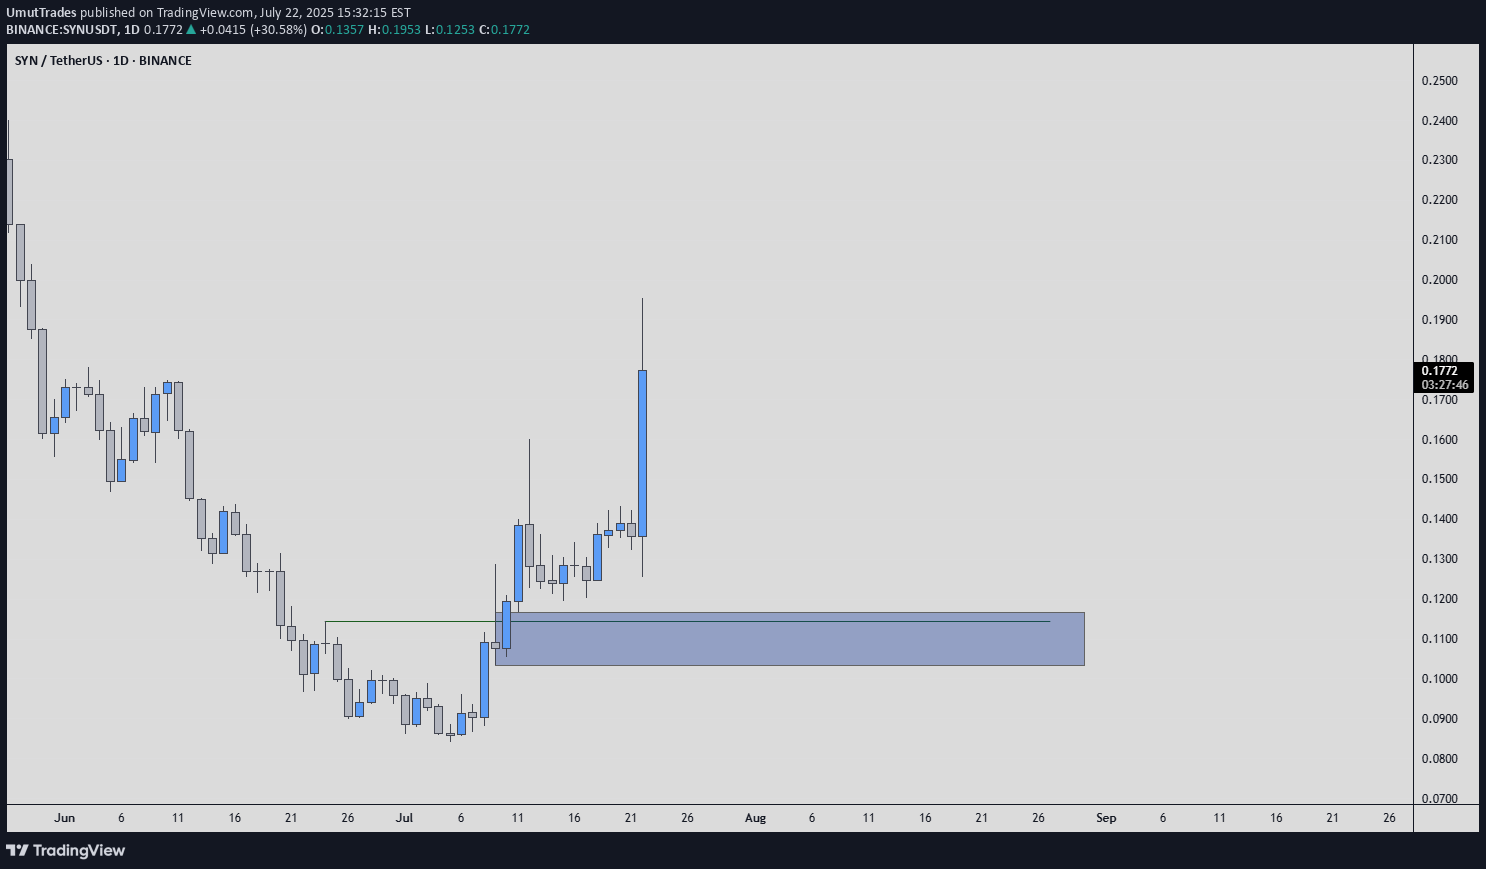
Price is rising strongly. The blue box is a fair price to join as a buyer if the market gives it. I’m not chasing high prices. If price returns to my blue box, I’ll watch for: ✅ Footprint absorption ✅ CDV support ✅ Structure reclaim If these align, I’ll consider a long with clear risk. If not, I’ll wait. The right price, or no trade. 📌I keep my charts clean and simple because I believe clarity leads to better decisions. 📌My approach is built on years of experience and a solid track record. I don’t claim to know it all but I’m confident in my ability to spot high-probability setups. 📌If you would like to learn how to use the heatmap, cumulative volume delta and volume footprint techniques that I use below to determine very accurate demand regions, you can send me a private message. I help anyone who wants it completely free of charge. 🔑I have a long list of my proven technique below: 🎯 ZENUSDT.P: Patience & Profitability | %230 Reaction from the Sniper Entry 🐶 DOGEUSDT.P: Next Move 🎨 RENDERUSDT.P: Opportunity of the Month 💎 ETHUSDT.P: Where to Retrace 🟢 BNBUSDT.P: Potential Surge 📊 BTC Dominance: Reaction Zone 🌊 WAVESUSDT.P: Demand Zone Potential 🟣 UNIUSDT.P: Long-Term Trade 🔵 XRPUSDT.P: Entry Zones 🔗 LINKUSDT.P: Follow The River 📈 BTCUSDT.P: Two Key Demand Zones 🟩 POLUSDT: Bullish Momentum 🌟 PENDLEUSDT.P: Where Opportunity Meets Precision 🔥 BTCUSDT.P: Liquidation of Highly Leveraged Longs 🌊 SOLUSDT.P: SOL's Dip - Your Opportunity 🐸 1000PEPEUSDT.P: Prime Bounce Zone Unlocked 🚀 ETHUSDT.P: Set to Explode - Don't Miss This Game Changer 🤖 IQUSDT: Smart Plan ⚡️ PONDUSDT: A Trade Not Taken Is Better Than a Losing One 💼 STMXUSDT: 2 Buying Areas 🐢 TURBOUSDT: Buy Zones and Buyer Presence 🌍 ICPUSDT.P: Massive Upside Potential | Check the Trade Update For Seeing Results 🟠 IDEXUSDT: Spot Buy Area | %26 Profit if You Trade with MSB 📌 USUALUSDT: Buyers Are Active + %70 Profit in Total 🌟 FORTHUSDT: Sniper Entry +%26 Reaction 🐳 QKCUSDT: Sniper Entry +%57 Reaction 📊 BTC.D: Retest of Key Area Highly Likely 📊 XNOUSDT %80 Reaction with a Simple Blue Box! 📊 BELUSDT Amazing %120 Reaction! 📊 Simple Red Box, Extraordinary Results 📊 TIAUSDT | Still No Buyers—Maintaining a Bearish Outlook 📊 OGNUSDT | One of Today’s Highest Volume Gainers – +32.44% 📊 TRXUSDT - I Do My Thing Again 📊 FLOKIUSDT - +%100 From Blue Box! 📊 SFP/USDT - Perfect Entry %80 Profit! 📊 [https://www.tradingview.com/chart/AAVEUSDT/RZ4eezbi-AAVEUSDT-Analysis-Retracement-Opportunity/]AAVEUSDT - WE DID IT AGAIN! I stopped adding to the list because it's kinda tiring to add 5-10 charts in every move but you can check my profile and see that it goes on..Great profit!
Disclaimer
Any content and materials included in Sahmeto's website and official communication channels are a compilation of personal opinions and analyses and are not binding. They do not constitute any recommendation for buying, selling, entering or exiting the stock market and cryptocurrency market. Also, all news and analyses included in the website and channels are merely republished information from official and unofficial domestic and foreign sources, and it is obvious that users of the said content are responsible for following up and ensuring the authenticity and accuracy of the materials. Therefore, while disclaiming responsibility, it is declared that the responsibility for any decision-making, action, and potential profit and loss in the capital market and cryptocurrency market lies with the trader.