
Innotrade_AJ
@t_Innotrade_AJ

What symbols does the trader recommend buying?
Purchase History
پیام های تریدر
Filter
Innotrade_AJ
Uranus Retrograde and BTC Analysis - September 5th, 2025
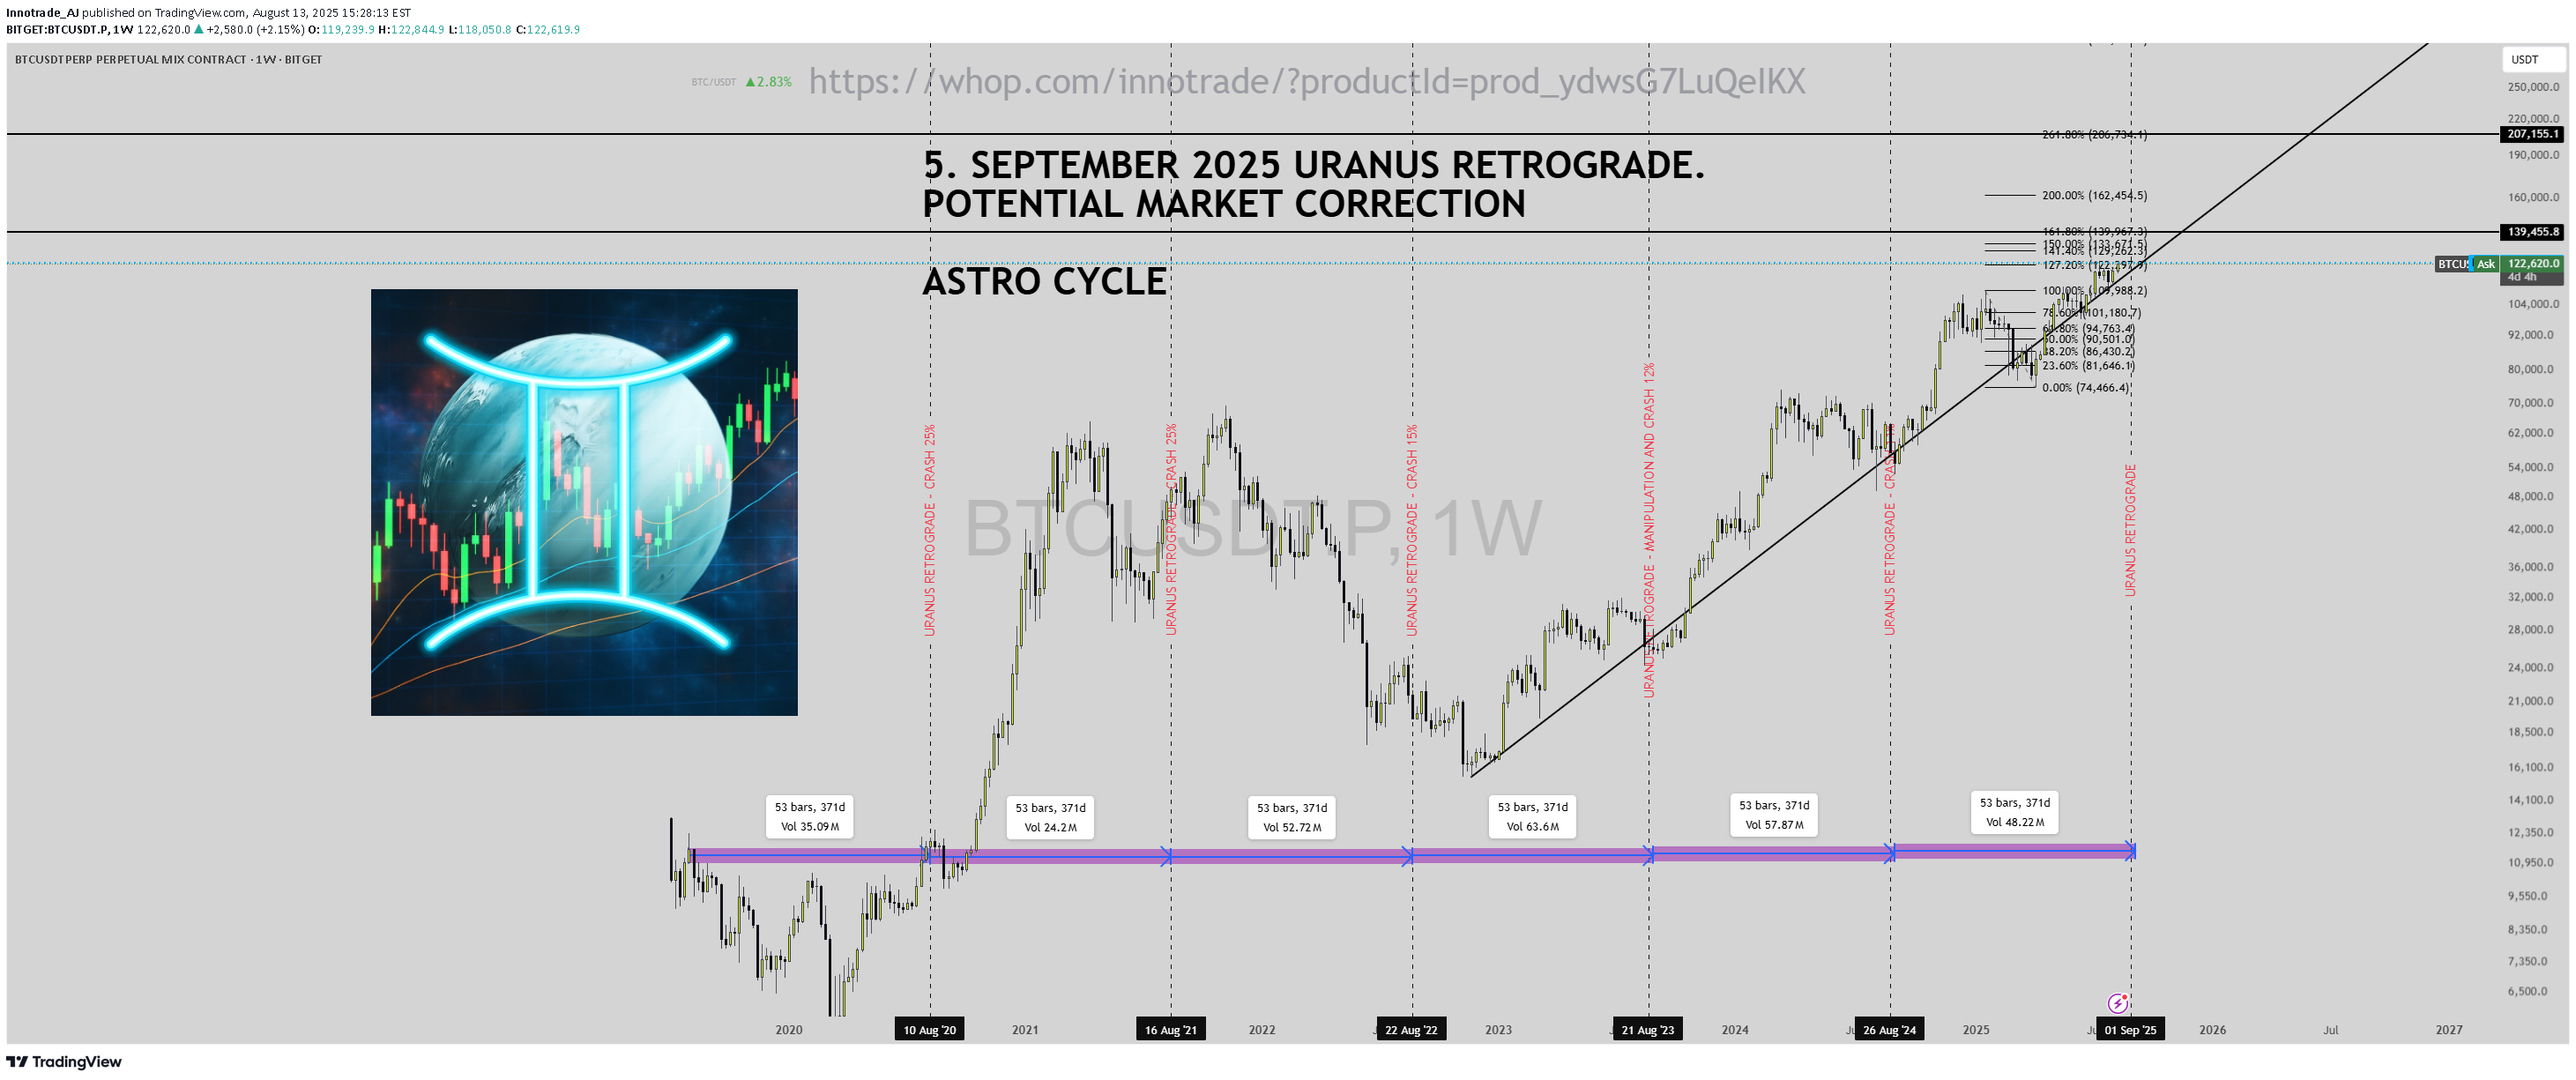
The Uranus retrograde, starting September 5, 2025, at 1°25′ Gemini and ending February 4, 2026, at 27°22′ Taurus, may signal a potential market correction. Historical data from 2020-2024 shows correlations between retrograde phases and price volatility. Key Dates and Observations 2020: Aug 15 - Jan 14, 2021 (10°41′ to 6°43′ Taurus) 2021: Aug 19 - Jan 18, 2022 (14°47′ to 10°49′ Taurus) 2022: Aug 24 - Jan 22, 2023 (18°55′ to 14°56′ Taurus) 2023: Aug 28 - Jan 27, 2024 (23°04′ to 19°05′ Taurus) 2024: Sep 1 - Jan 30, 2025 (27°15′ to 23°15′ Taurus) 2025: Sep 5 - Feb 4, 2026 (1°25′ Gemini to 27°22′ Taurus) Past retrogrades have coincided with notable price dips and recoveries, suggesting a similar trend in 2025. Technical Levels Astro-Technical Insight Uranus in Gemini may bring unexpected shifts. Combine this with moving averages and volume analysis for a holistic view. The chart indicates a potential pullback post-September 5—keep an eye on volume spikes. Community Input What are your predictions? Does astrology influence your trading? Drop your ideas below!
Innotrade_AJ
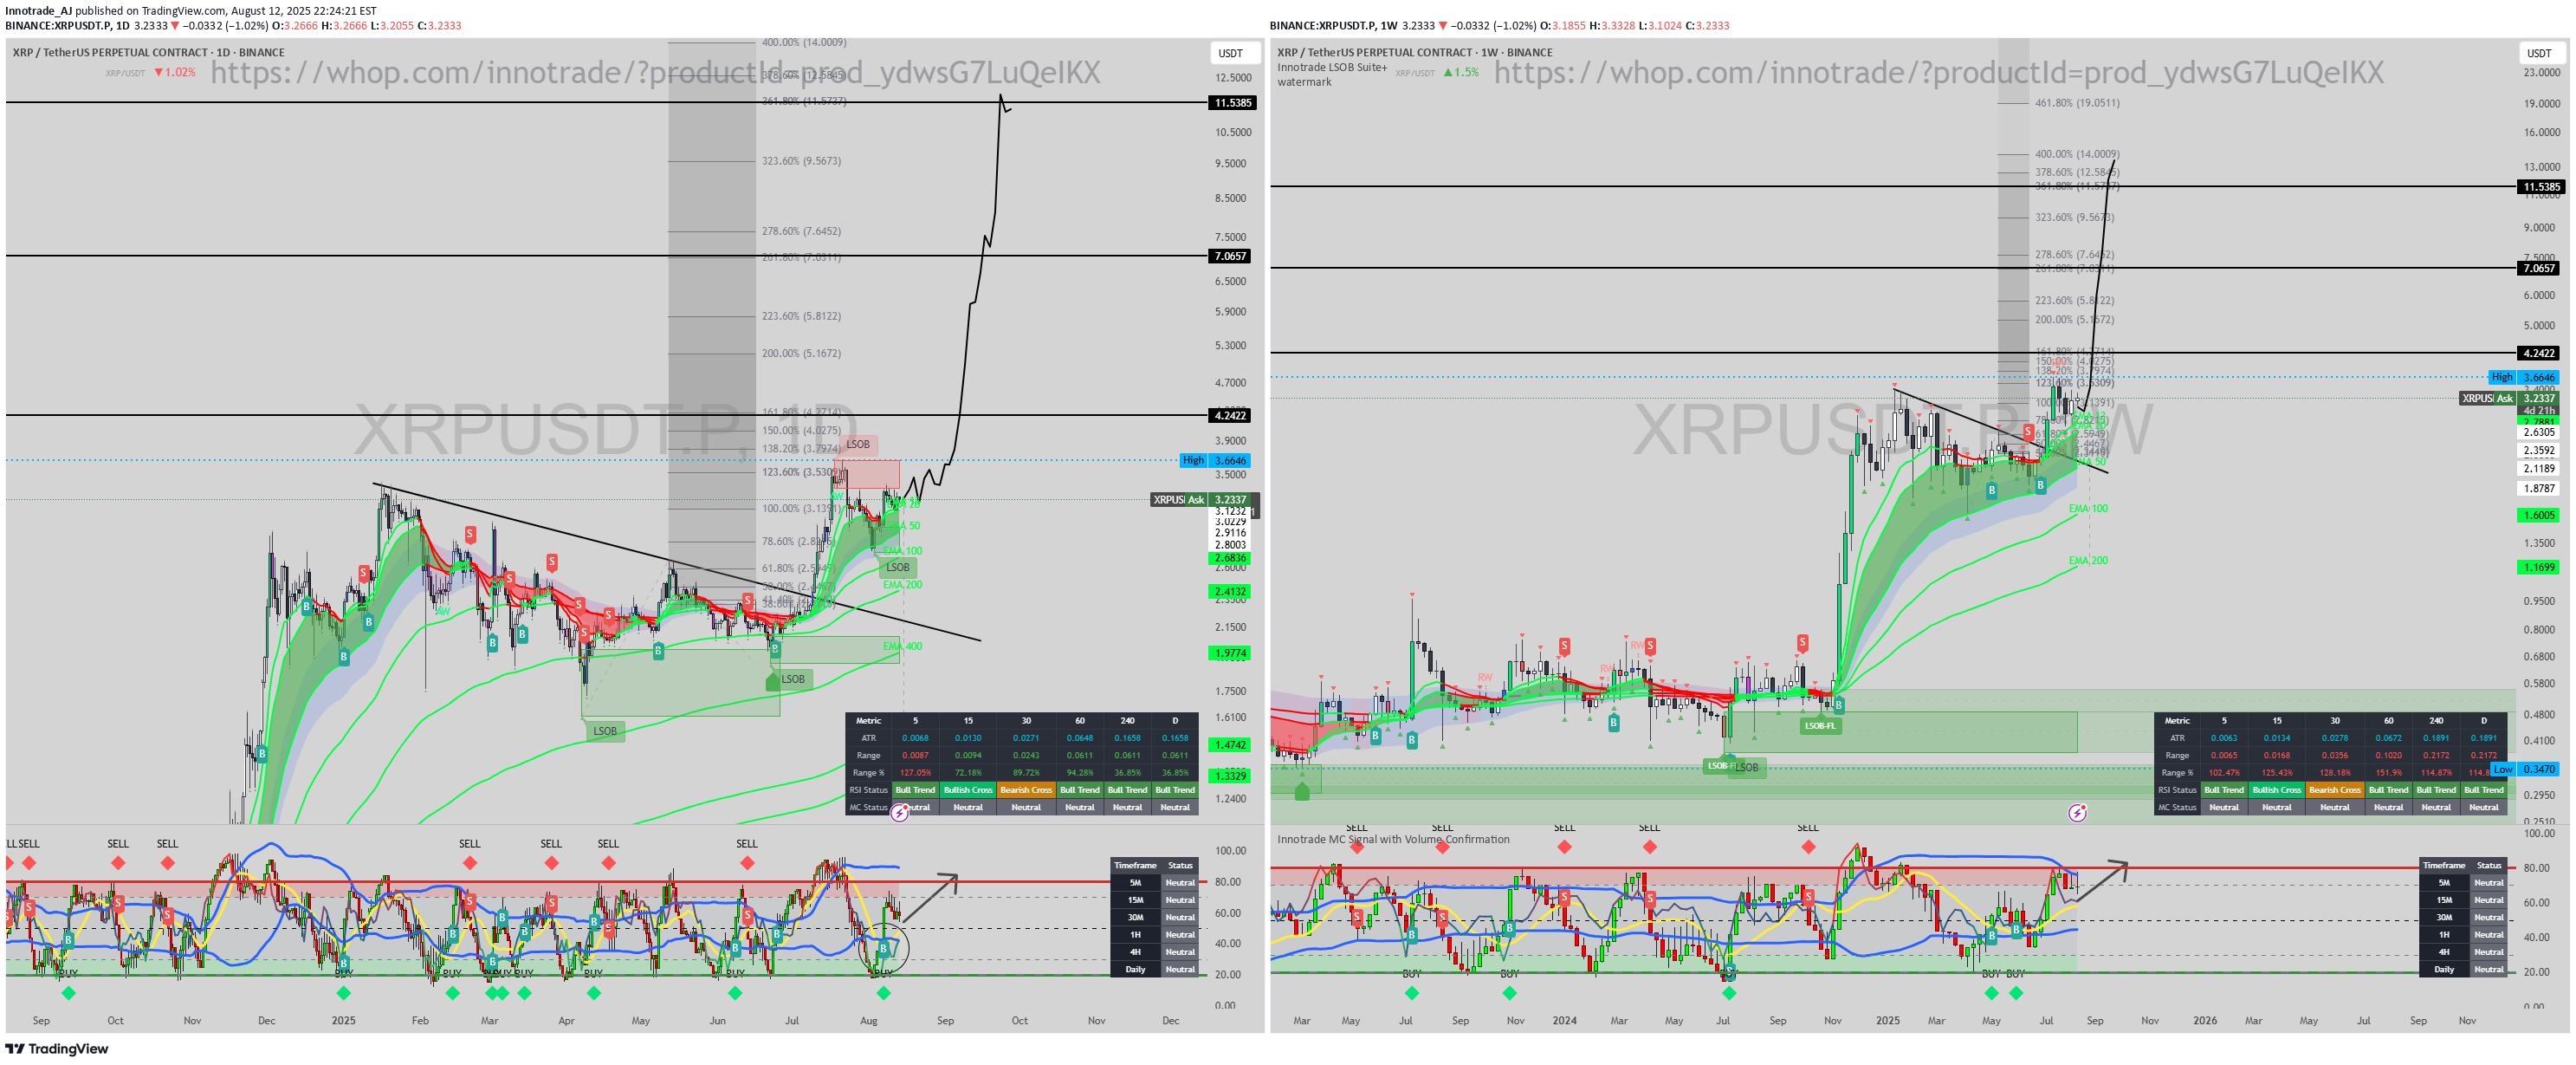
XRP RALLY BEGINS "THE CALM BEFORE THE STORM"
Innotrade_AJ
TIA/USDT: Bullish Patterns Emerge at Key Resistance
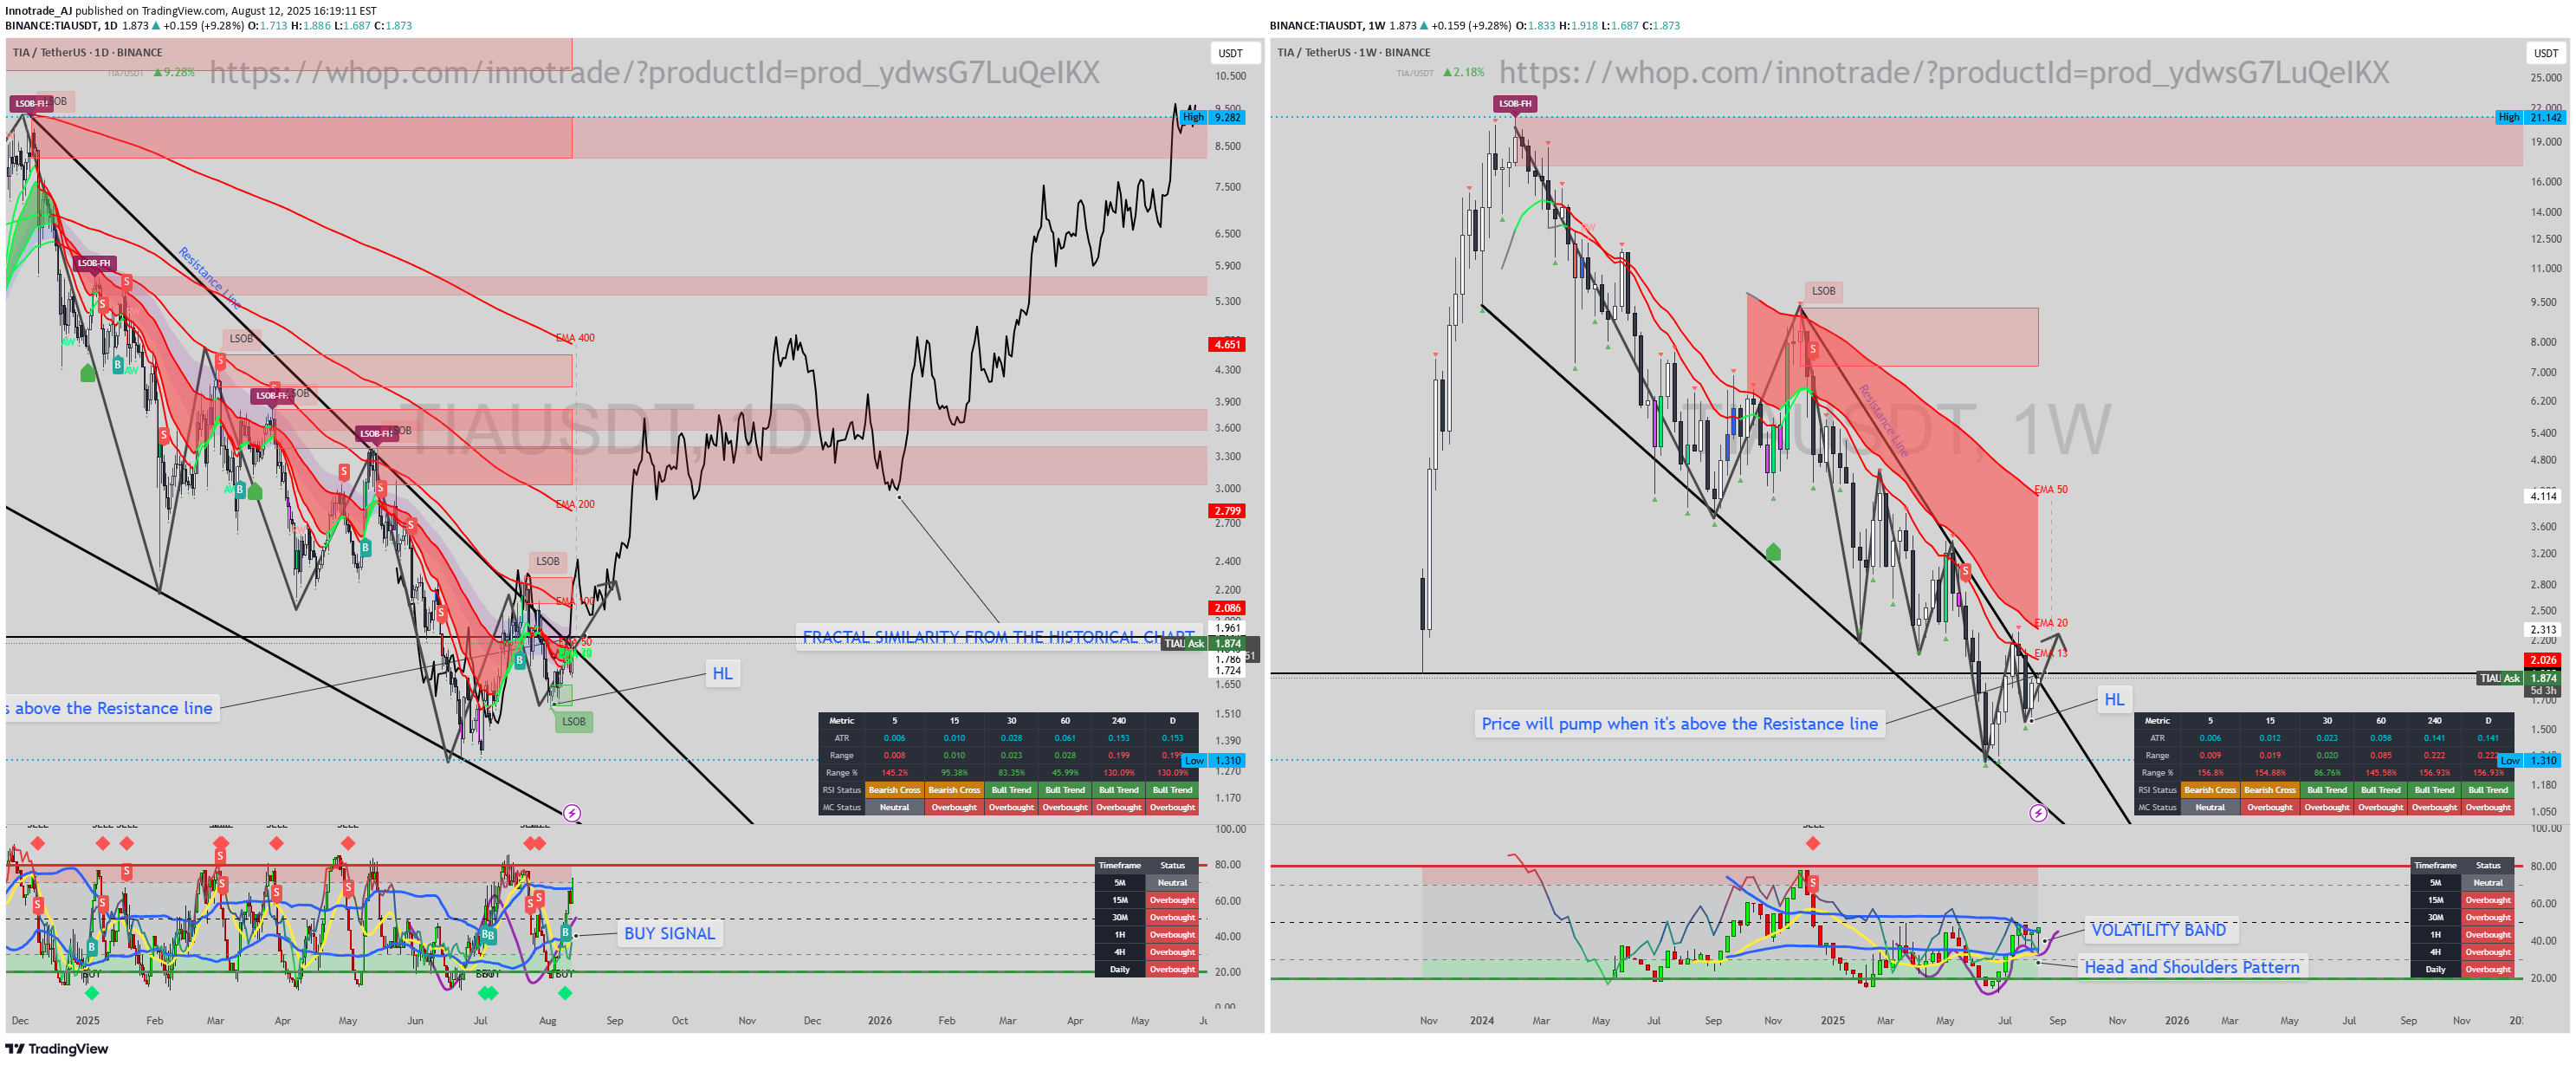
SUBSCRIBE, BOOST AND COMMENT IN ORDER TO GET HIGH QUALITY TECHNICAL ANALYSIS. Firstly, our Algo-based indicators are used to create this analysis. Daily (1D) & Weekly (1W) Analysis: TIA/USDT has been in a sustained downtrend, but price is now tightening within a classic bullish pattern, suggesting a significant move may be imminent. Key Observations: Bullish Wedge: The price is consolidating within a large falling wedge, a strong bullish reversal pattern. A breakout to the upside is the confirmation we're watching for. Primary Trigger: A decisive break and hold above the wedge's descending resistance line is the critical signal for a bullish reversal. Analysis suggests a significant price pump could follow. Bullish Divergence & Signals: On the daily chart, a clear "BUY SIGNAL" has been triggered on the momentum indicator. The weekly indicator shows a potential inverse Head and Shoulders pattern developing, adding weight to the reversal case in our Market Cycle Orderflow indcator. Fractal Projection: Historical fractal analysis projects a highly bullish path for TIA if it successfully breaks the current downtrend structure. Conclusion: The combination of a bullish falling wedge, a daily buy signal, and a potential weekly bottoming pattern strongly indicates a reversal may be near. The key confirmation remains a breakout above the wedge's resistance. Until then, this is a prime chart to watch.
Innotrade_AJ
RENDER - SHORT TERM 7-9$, MIDDLE TERM 21$ AND LONG TERM 200$

SUBSCRIBE, BOOST AND COMMENT IN ORDER TO GET HIGH QUALITY TECHNICAL ANALYSIS. Firstly, our Algo-based indicators are used to create this analysis. RENDER FOR 200$ NEXT YEAR? YOU MIGHT NOT BELIEVE, BUT IT'S THE NATURE OF FRACTALS.
Innotrade_AJ
RSR/USDT: Bullish Momentum Building on Multiple Timeframes

BEFORE WE BEGINN SUBSCRIBE, BOOST AND COMMENT OUR HIGH QUALITY ANALYSIS. Firstly, our Algo-based indicators are used to create this analysis. This analysis takes a look at the RSR/USDT pair on both the daily (1D) and weekly (1W) charts, revealing a confluence of bullish signals that suggest potential for significant upward movement. Weekly (1W) Chart Analysis: The weekly chart for RSR/USDT is showing strong signs of a bullish reversal and continuation. A key feature is the "Liquidity Sweep OrderBlock with a B-Buy signal" located in the lower price region. This indicates that a significant level where sell-side liquidity was resting has been swept, and buyers have since stepped in with force. The price is currently respecting a supportive trendline and has broken out of a bearish trend. The indicator below the main chart, labeled "Innotrade MC Signal with Volume Confirmation," shows a "BUY" signal, with the reading "Above 50 and Volatility Band- Bullish." This suggests that momentum is in favor of the bulls and is supported by volume. Additionally, the multi-timeframe status table indicates "Overbought" conditions on most timeframes, which, while sometimes a precursor to a pullback, in this context of a strong breakout can also signify strong buying pressure. Daily (1D) Chart Analysis: The daily chart reinforces the bullish sentiment seen on the weekly timeframe. The price appears to be in an uptrend, holding above several key moving averages (EMA 100, 200, 400, 800, 1000). We can observe multiple "B" (Buy) signals as the price interacts with key support levels and moving averages. Similar to the weekly chart, the daily chart shows an indicator table where the RSI Status is a "Bull Trend" across most timeframes from 15 minutes to daily, and the MC Status is "Overbought." This widespread bullish and overbought reading suggests a strong, sustained buying interest in the short to medium term. Synthesis and Outlook: Both the weekly and daily charts for RSR/USDT are aligning to paint a bullish picture. The weekly chart provides the macro view of a potential trend reversal, confirmed by a liquidity sweep and strong momentum indicators. The daily chart offers a more granular look, showing consistent buying pressure and respect for key technical support levels. The combination of these factors suggests that RSR/USDT is positioned for further upside. Traders might consider looking for entry opportunities on minor pullbacks, with an eye on the higher price levels suggested by the ascending channel on the weekly chart. Disclaimer: This is not financial advice. The analysis is for educational purposes only. Please conduct your own research before making any trading decisions.
Innotrade_AJ
FUNUSDT (FunFair/TetherUS) preparing for PUMP
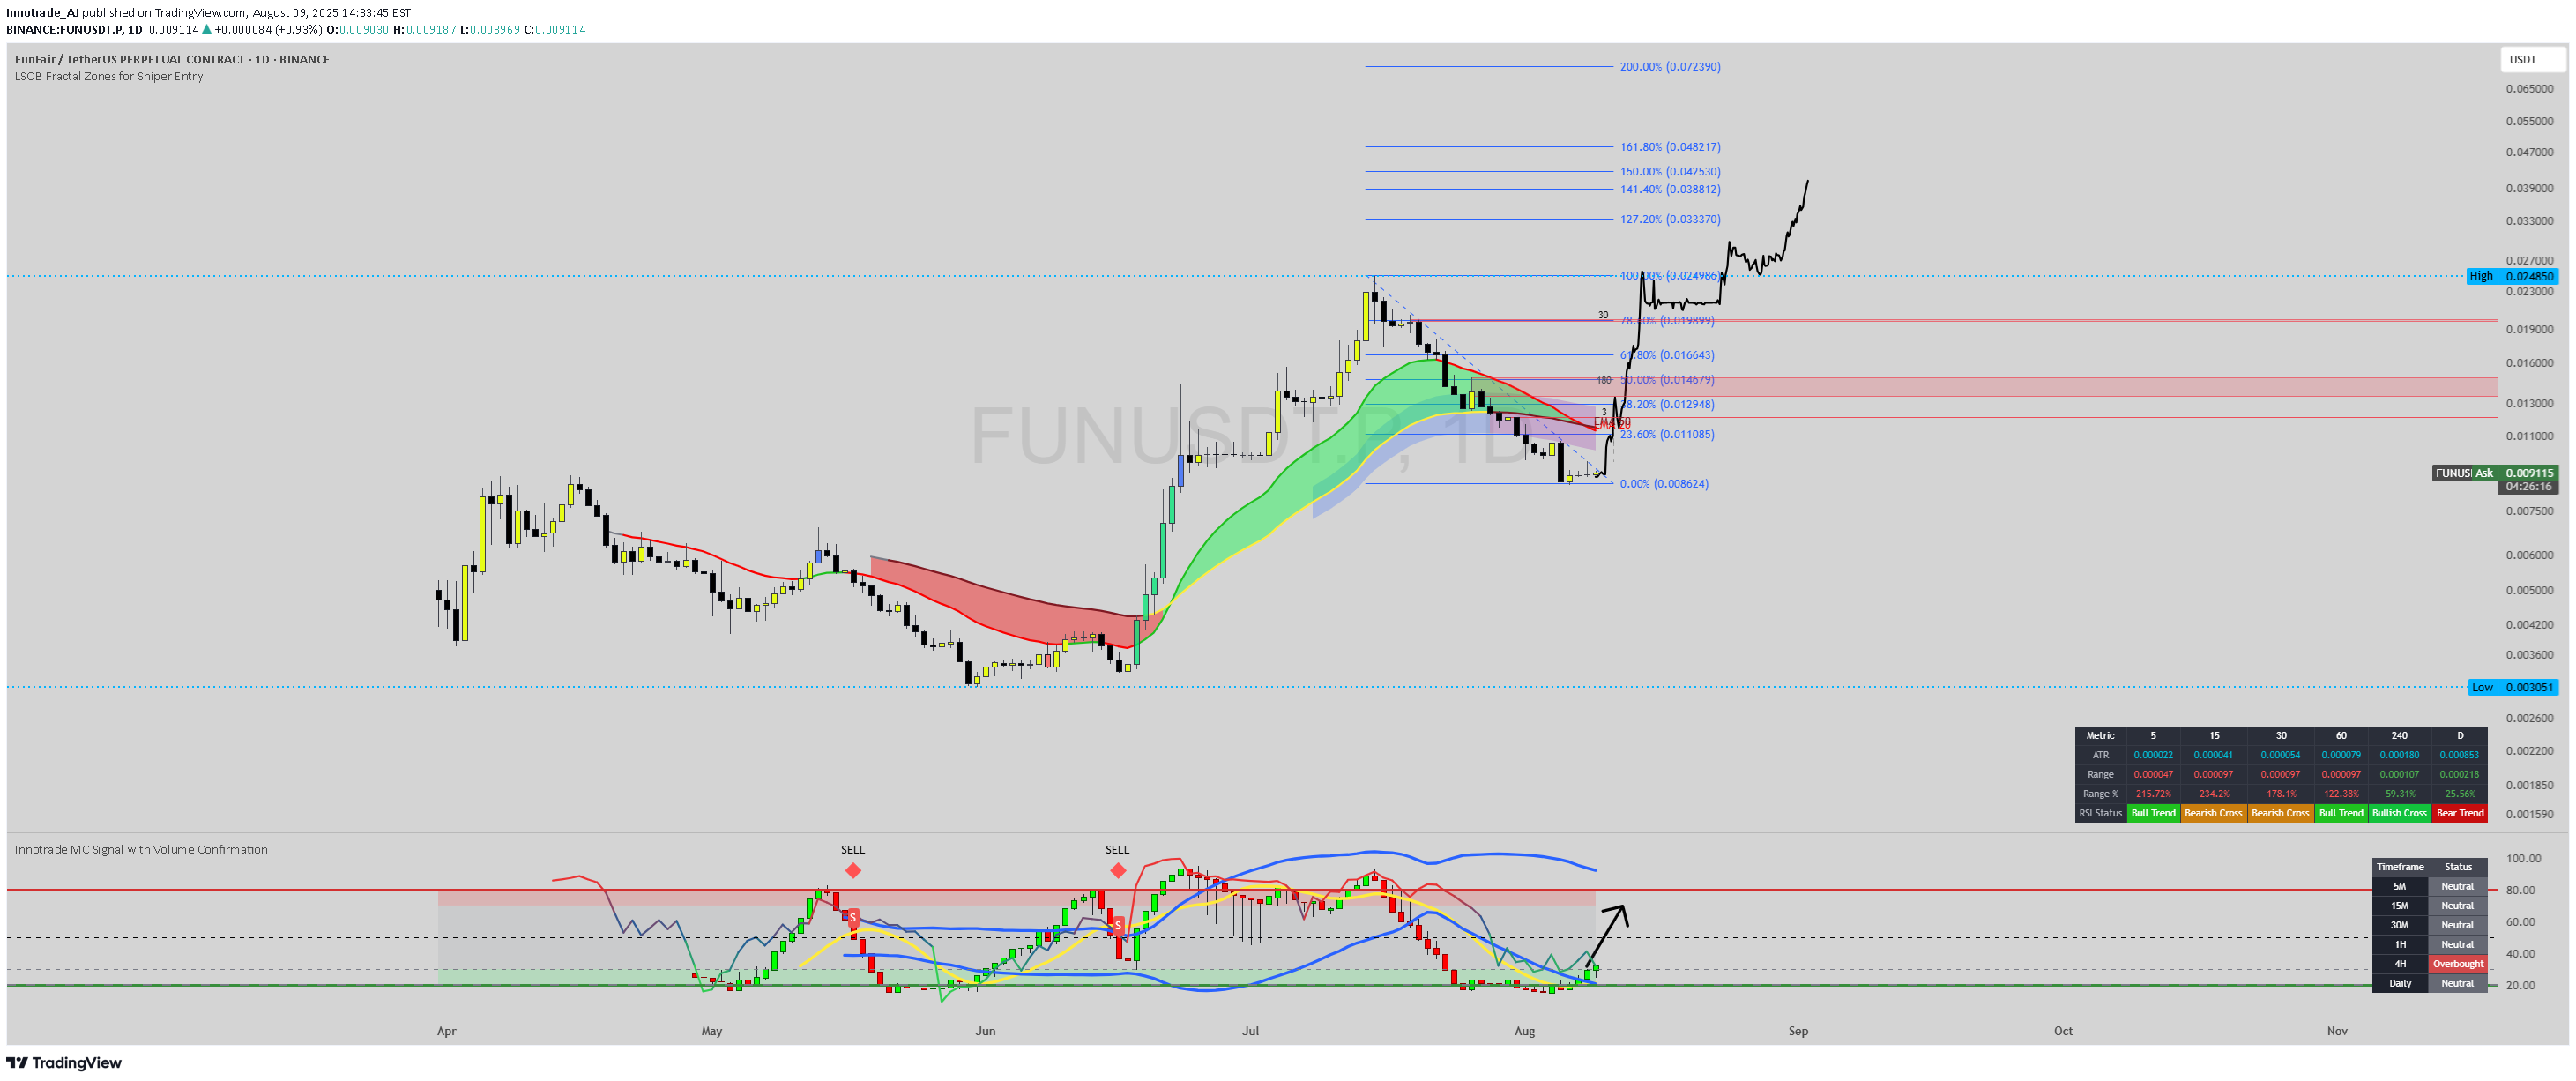
Firstly, our Algo-based indicators are used to create this analysis. Follow me so you don't miss, Boost and leave your comments if you profited with our posts, so we may continue: This daily chart for FUNUSDT (FunFair/TetherUS) suggests that a significant correction has found a floor, and the asset is now positioned for a strong bullish reversal with substantial upside potential. Market Structure Shift: The chart illustrates a classic reversal pattern. After a steep decline from the peak at approximately $0.02485, the price has entered a consolidation phase at a critical support level. The projected path, indicated by the hand-drawn pink line, represents an anticipated "Change of Character" (Choch) from bearish to bullish as the price is expected to start forming higher highs and higher lows. Other traders have also noted that FUNUSDT is showing signs of a potential bullish reversal. Support and Bottoming Formation: The price is finding strong support at the $0.008624 level, which corresponds to the 0.00% Fibonacci retracement level of the prior major uptrend. This level is acting as the definitive bottom in this analysis. The price action consolidating above this low suggests an accumulation phase is underway. Indicator Confluence: * The primary chart indicator, the LSQB Fractal Zones for Sniper Entry, shows the price holding within the green-colored band. In systems like this, fractal-based indicators identify potential reversal points.The green zone acts as a dynamic support area, signaling that the underlying trend is either bullish or attempting a bullish reversal. * The lower indicator, Innotrade MC Signal with Volume Confirmation, is showing its signal line moving up from the lower boundary (green zone), which typically represents oversold conditions. [4] A black arrow points upwards, suggesting an impending or recently triggered buy signal and a buildup of bullish momentum. This custom indicator is designed to identify high-probability reversals by blending momentum oscillators and confirming them with volume and volatility analysis. Price Projection and Targets: The drawn pink line illustrates the expected trajectory for the price, anticipating a powerful rally from the current support. The key objectives are based on Fibonacci extension levels, which are used to project potential targets in a new trend: Strategy: Position: Long (Buy) Entry: The analysis identifies the current price area around the $0.008624 - $0.009129 zone as a "sniper entry" or strategic buying opportunity. Targets: The primary targets for this bullish move are 0.024986 0.024986 0.033370, and potentially higher towards $0.048217. Conclusion: With the price stabilizing at a key Fibonacci support level, a bottoming formation in place, and bullish signals from the custom indicators, FUNUSDT presents a compelling bullish reversal setup. The current price level is highlighted as an ideal entry point to capitalize on a potential new uptrend with significant room for growth. Disclaimer: This analysis is based on the provided trading chart and is for educational purposes only. It should not be considered financial advice. Always conduct your own research and manage risk appropriately. Crypto markets are known for their volatility.
Innotrade_AJ
SYNUSDT: Breaking Long-Term Downtrend, Poised for a Major Rally?

Firstly, our Algo-based indicators are used to create this analysis. Follow me so you don't miss, Boost and leave your comments if you profited with our posts, so we may continue: This daily chart for SYNUSDT showcases a significant technical development as the price appears to be breaking out of a multi-month descending channel, signaling a potential major trend reversal. Analysis: Descending Channel Breakout: The price has been confined within a clear descending channel for most of the year. The recent price action shows a decisive push above the upper boundary of this channel. It is currently consolidating right above this broken trendline, which is a classic "breakout-and-retest" pattern. Key Support: The current price is finding support at the 23.6% Fibonacci retracement level (around $0.1212). A successful hold above this level would reinforce the bullish breakout. Momentum Indicator: The Innotrade MC Signal at the bottom provides strong confluence. The indicator is sharply rising from the oversold "BUY" zone in a pattern labeled "V-Band Rising," which suggests a powerful burst of bullish momentum from a bottom. Price Projection and Targets: The illustrated price path anticipates a strong upward move following this retest phase. The first major area of resistance to watch is the zone between the 61.8% Fib level (0.2147) 𝑎 𝑛 𝑑 𝑡 ℎ 𝑒 78.6, (0.2147). This area also contains a previous order block (LSOB) and the EMA 200. Target 1: is explicitly marked at $0.2777. Higher targets based on Fibonacci extensions are noted at $0.5709 and above for the longer term. Strategy: Position : Long (Buy) Entry: The current price level, retesting the broken channel trendline (around $0.12 - $0.14), presents a strategic entry point. Targets: The initial primary target is $0.2777, with further long-term potential if bullish momentum is sustained. Conclusion: The combination of a breakout from a long-term bearish structure, a successful retest of support, and powerful momentum indicators suggests that SYNUSDT could be at the beginning of a new, significant uptrend. The current price offers a favorable risk-to-reward entry for a move towards the identified targets. Disclaimer: This analysis is for educational purposes only and should not be considered financial advice. Always conduct your own research and manage risk appropriately.
Innotrade_AJ
RPL/USDT Enters Prime Buy Zone: Accumulation Before Next Leg Up?

Firstly, our Algo-based indicators are used to create this analysis. Please Follow, Boost and leave your comments if you profited with our posts, so we may continue: This 4-hour chart for RPL/USDT highlights a key support area that could serve as a launchpad for the next bullish impulse. Analysis: Corrective Pullback: After a strong rally that peaked near $8.72, the price has entered a corrective phase, pulling back to a significant area of interest. The "BUY ZONE": A critical support zone has been identified between $6.48 and $6.80. This area represents a confluence of technical support: Horizontal Structure: It aligns with a previous support/resistance level, where price has reacted multiple times. Moving Averages: The price is currently testing the EMA 200 and is hovering just above the longer-term EMA 800, both of which often act as dynamic support during uptrends. Indicator Confirmation: The custom indicator at the bottom of the chart shows the price has dipped into the oversold "BUY" territory, and a fresh "B" (Buy) signal has just appeared. This suggests that selling pressure is exhausting and buyers are beginning to step in. Price Projection: The drawn black line illustrates a potential scenario where the price consolidates and accumulates within the "BUY ZONE." This period of sideways action would build a base before a strong continuation of the primary uptrend, targeting a retest and potential break of the recent high at $8.72. Strategy: Idea: Look for buying opportunities within the defined support zone. Entry: The area between $6.48 and $6.80 is the designated "BUY ZONE." Traders might look for signs of consolidation or bullish price action within this range to initiate long positions. Target: The initial target would be the recent high of $8.72. Conclusion: The current price action presents a classic dip-buying opportunity. The confluence of structural support, key moving averages, and a bullish indicator signal in the "BUY ZONE" suggests a high probability of a bullish reversal. Accumulation in this zone could fuel the next significant move upwards for RPL. Disclaimer: This analysis is for educational purposes only and should not be considered financial advice. Always conduct your own research and manage risk appropriately.
Innotrade_AJ
CVX/USDT: Long-Term Breakout Signals Massive Upside Potential

Firstly, our Algo-based indicators are used to create this analysis: DON'T MISS US. FOLLOW US, COMMENT AND BOOST. This weekly chart for CVX/USDT reveals a major bullish breakout from a long-term pattern, suggesting that the asset may be in the early stages of a significant new uptrend. Analysis: Descending Channel Breakout: For over two years, CVX has been trading within a clear descending channel. Recently, the price has decisively broken out of this channel to the upside, signaling a major shift from a bearish to a bullish market structure. Pullback and Reentry: Following the initial powerful breakout, the price executed a healthy pullback. It found support right around the key 50% Fibonacci retracement level (approximately $4.262). The chart notes this area as a potential "REENTRY" point, especially with the formation of a "W-Pattern" (double bottom) on a smaller timeframe, which is a classic bullish reversal signal. Confirmation Indicators: The Innotrade MC Signal indicator at the bottom shows multiple "BUY" signals in the recent accumulation zone and the indicator line is now trending upwards, suggesting building momentum. The RSI status confirms a "Bull Trend" on the daily and weekly timeframes, supporting a long-term bullish outlook. Price Targets: Based on Fibonacci extension levels from the recent major swing, several targets are identified: TP 1: $12.243 (aligns with the 127.20% extension and a previous key resistance level). TP 2: $19.726 (aligns with the 161.80% extension). Long-Term Projection: The aggressive black line projects a potential move towards the 2022 highs, indicating massive long-term potential if the bullish momentum continues. Strategy: Position: Long (Buy) Entry: The current price level around $4.30 - $5.00 is highlighted as a strategic reentry zone following the successful pullback. Targets: The primary targets are 12.243 ∗ ∗ a n d ∗ ∗ 12.243∗∗and∗∗ 19.726. Conclusion: The breakout from a multi-year descending channel, combined with a successful retest of key support and confirming indicator signals, presents a compelling long-term bullish case for CVX. The current price level offers a strategic entry for a potential multi-hundred percent move towards the identified price targets. Disclaimer: This analysis is for educational purposes only and should not be considered financial advice. Always conduct your own research and manage risk appropriately.
Innotrade_AJ
MAGIC LONG

Firstly, our Algo-based indicators are used to create this analysis:
Disclaimer
Any content and materials included in Sahmeto's website and official communication channels are a compilation of personal opinions and analyses and are not binding. They do not constitute any recommendation for buying, selling, entering or exiting the stock market and cryptocurrency market. Also, all news and analyses included in the website and channels are merely republished information from official and unofficial domestic and foreign sources, and it is obvious that users of the said content are responsible for following up and ensuring the authenticity and accuracy of the materials. Therefore, while disclaiming responsibility, it is declared that the responsibility for any decision-making, action, and potential profit and loss in the capital market and cryptocurrency market lies with the trader.