
STRK
Starknet
| تریدر | نوع سیگنال | حد سود/ضرر | زمان انتشار | مشاهده پیام |
|---|---|---|---|---|
 minno91Rank: 5198 | فروش | حد سود: تعیین نشده حد ضرر: تعیین نشده | 11/21/2025 | |
فروش | حد سود: تعیین نشده حد ضرر: تعیین نشده | 18 hour ago |

Price Chart of Starknet
سود 3 Months :
سیگنالهای Starknet
Filter
Sort messages by
Trader Type
Time Frame

استارکنت (STRK): آیا زمان ورود به این فرصت بزرگ لایه 2 فرا رسیده است؟
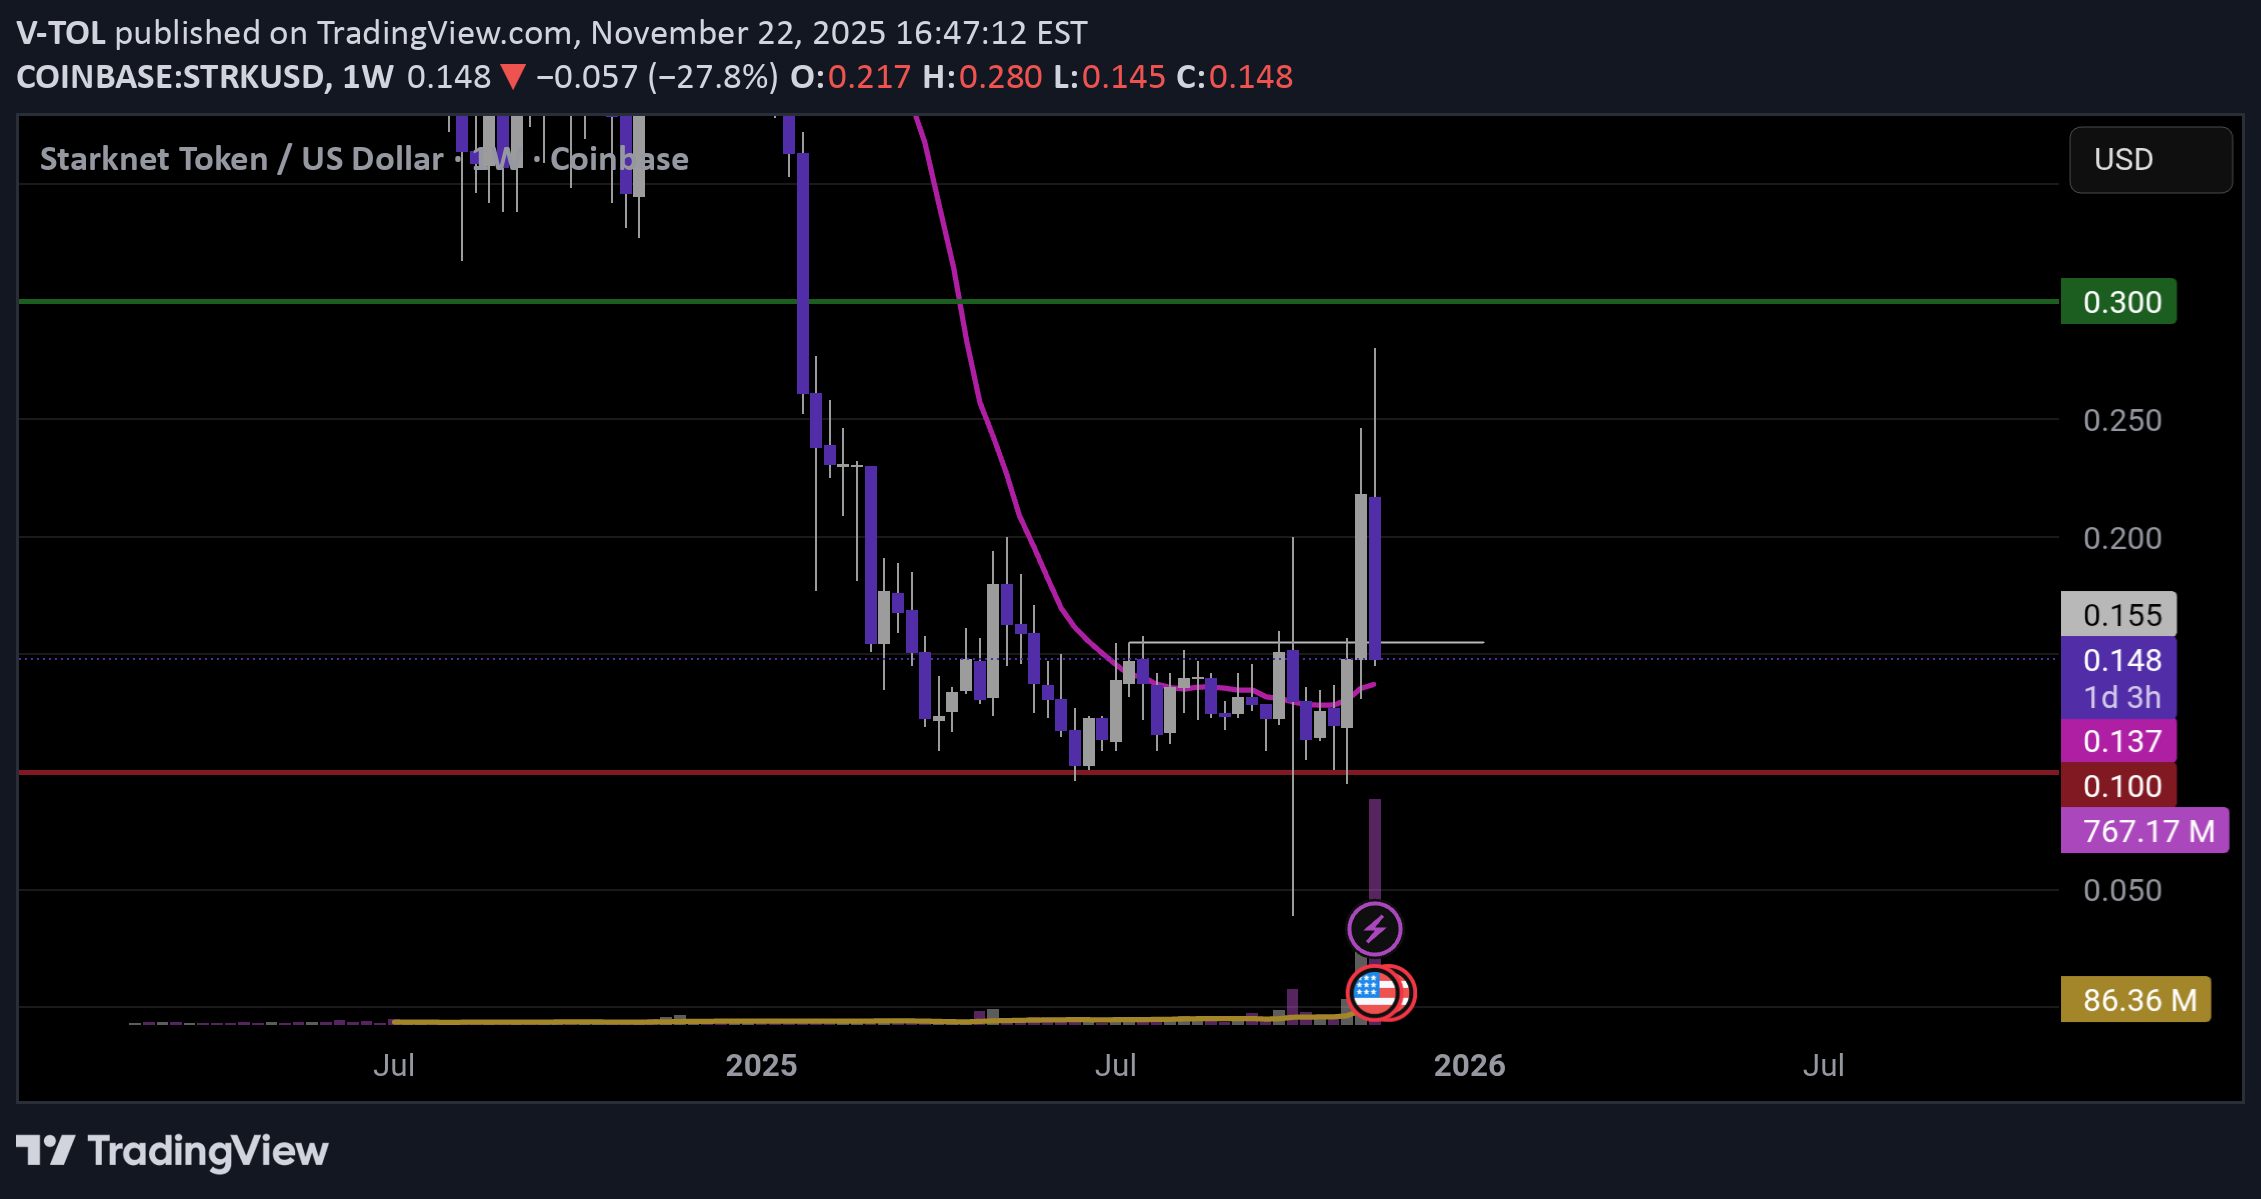
Starknet (STRK) is the native token of a Layer 2 solution on Ethereum based on zk-rollups, designed to scale the network while maintaining security and decentralization. The project aims to significantly increase speed and reduce transaction costs, making it one of the most interesting ecosystems in the L2 space. On the weekly chart, STRK seems to have completed its initial strong distribution phase and is now building a base between $0.11 and $0.15. The increase in volume suggests, in my opinion, a possible trend change. If the price manages to stabilize above $0.15, I consider a move toward $0.30 to be realistic. A key stop level for this setup is $0.10.
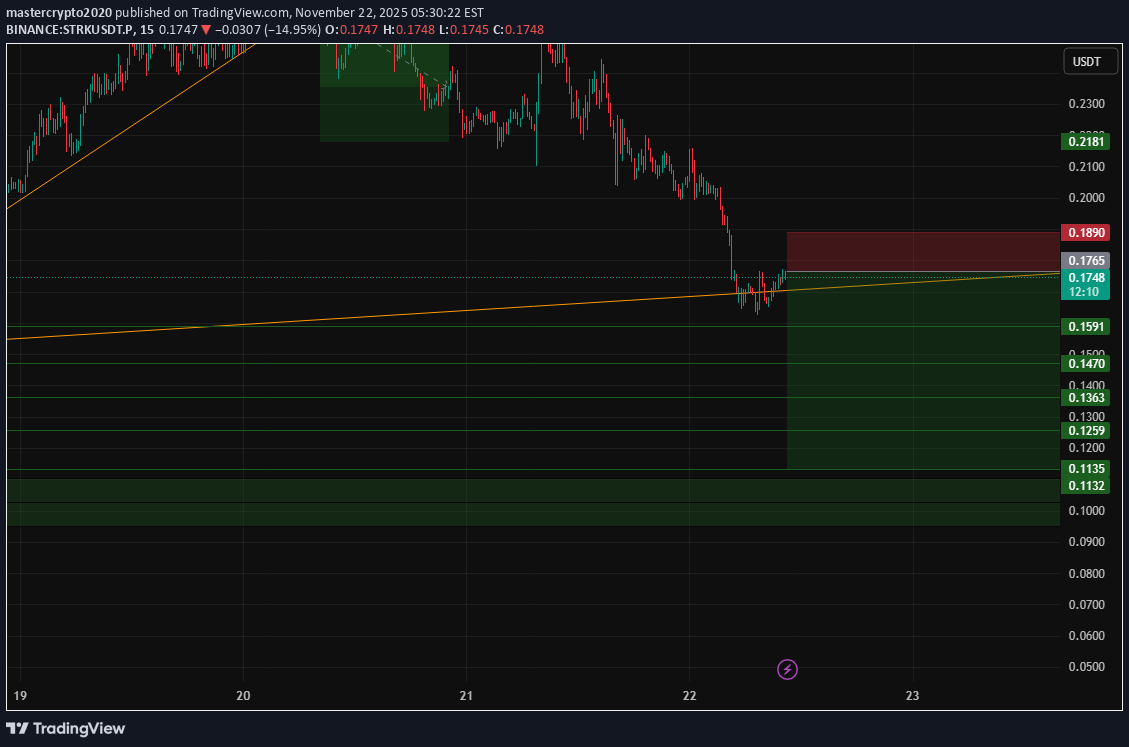
سیگنال فروش فوری استارک (STRK/USDT): فرصت کسب سود با اهرم 5X!

--- 📢 Official Trade Signal – STRK/USDT 📉 Position Type: SHORT 💰 Entry Price: 0.1766 --- 🎯 Take-Profit Targets (Partial Exits) TP1 = 0.1591 TP2 = 0.1470 TP3 = 0.1363 TP4 = 0.1259 TP5 = 0.1135 TP6 = — --- 🛑 Stop-Loss: 0.1845 📊 Timeframe: — ⚖️ Risk/Reward Ratio: 7.87 💥 Suggested Leverage: 5× – 3× --- 🧠 Technical Analysis Summary STRK is showing clear bearish momentum after rejection from the 0.18+ supply zone. Price structure confirms a shift toward a downtrend, with strong selling pressure dominating the chart. Bearish confirmations supporting this SHORT setup: Sharp rejection from resistance around 0.182–0.184 Breakdown below intraday support levels Momentum indicators showing heavy selling volume Lower highs forming across multiple timeframes TP levels align with liquidity gaps and untested demand areas The targets at 0.1591 and 0.1470 are key downside liquidity pools where market makers typically drive price. --- ⚙️ Trade Management Rules ✔️ Take partial profit at TP1 ✔️ Move Stop-Loss to Break-Even once TP1 is reached ✔️ Continue trailing SL as price approaches TP2–TP5 ✔️ Do NOT re-enter if SL at 0.1845 gets hit ✔️ Follow strict position sizing and risk management --- ⚠️ Important Risk-Management Note When TP1 hits, immediately move SL to Entry Price (Break-Even). This locks in a risk-free trade. ❗ If price reverses later and hits BE, it is not a loss — it is correct risk management. 🔐 Capital protection is always the top priority for professional traders. --- 📌 TradingView Hashtags #STRKUSDT #STRK #CryptoSignal #ShortSetup #TechnicalAnalysis #TradingView #FuturesTrading #Altcoins #ProSignal -
سیگنال فروش فوری STRK/USDT: آماده سقوط به زیر ۰.۱۶!
--- 📢 Official Trade Signal – STRK/USDT 📉 Position Type: SHORT 💰 Entry Price: 0.1766 --- 🎯 Take-Profit Targets (Partial Exits) TP1 = 0.1591 TP2 = 0.1470 TP3 = 0.1363 TP4 = 0.1259 TP5 = 0.1135 TP6 = — --- 🛑 Stop-Loss: 0.1895 📊 Timeframe: — ⚖️ Risk/Reward Ratio: 7.87 💥 Suggested Leverage: 5× – 3× --- 🧠 Technical Analysis Summary STRK is showing strong bearish pressure after failing to hold above the 0.18 resistance zone. The market structure has shifted downward, with lower highs forming and momentum clearly favoring sellers. Key confirmations for the SHORT setup: Breakdown of key support near 0.17 Increasing selling volume around resistance re-tests Clear bearish trend continuation pattern Liquidity gaps below price indicating downside potential toward 0.159 – 0.136 Momentum indicators showing declining strength and bearish divergence The listed targets align with major demand zones, liquidity pockets, and historical reaction levels. --- ⚙️ Trade Management Rules ✔️ Take partial profit at TP1 ✔️ Move Stop-Loss to Break-Even once TP1 is hit ✔️ Trail SL lower as price approaches TP2–TP5 ✔️ Do not re-enter if stop-loss is hit at 0.1845 ✔️ Stick to the planned risk — no overleveraging --- ⚠️ Important Risk-Management Note When price touches TP1, immediately move the SL to the Entry Price. This is a standard professional rule to eliminate risk. ❗ If the price pulls back and closes the position at break-even after TP1, this does not count as a losing trade — it means the setup was managed safely. 🔐 Always protect capital first. Profit comes after risk is controlled. --- 📌 TradingView Hashtags #STRKUSDT #STRK #CryptoSignal #ShortSetup #TechnicalAnalysis #FuturesTrading #Altcoins #TradingView #ProSignal #ScalpSetup ---
minno91
افت شدید قیمت استارک (STRK)؟ تحلیل بازار ترسناک و نقاط حساس پیش رو

The entire crypto market right now = pure fear mode. Everyone’s sweating, charts are crying, and STRK was holding on like a brave little soldier… until today. Now it finally said: “Alright boys, I’m tired, I’m going down too.” I’m expecting another push to the downside, because this whole move looks like one big emotional flashout — the kind where market makers drag us lower just to check if we still have feelings. 🔎 What to watch: •How deep can this flush really go? •Where’s the real liquidity? •Will STRK bounce or commit to the full gymnastic dive? Let’s see — volatility today is high, fear everywhere, so manage this smartly. ⸻ ⚠️ Risk & money management ON Don’t get liquidated today, please. STRK doesn’t deserve your entire account. 😅 Good luck traders — may the flashout be gentle. 🚀💀1.5 RR done - let's move SL to BE

Cryptojobs
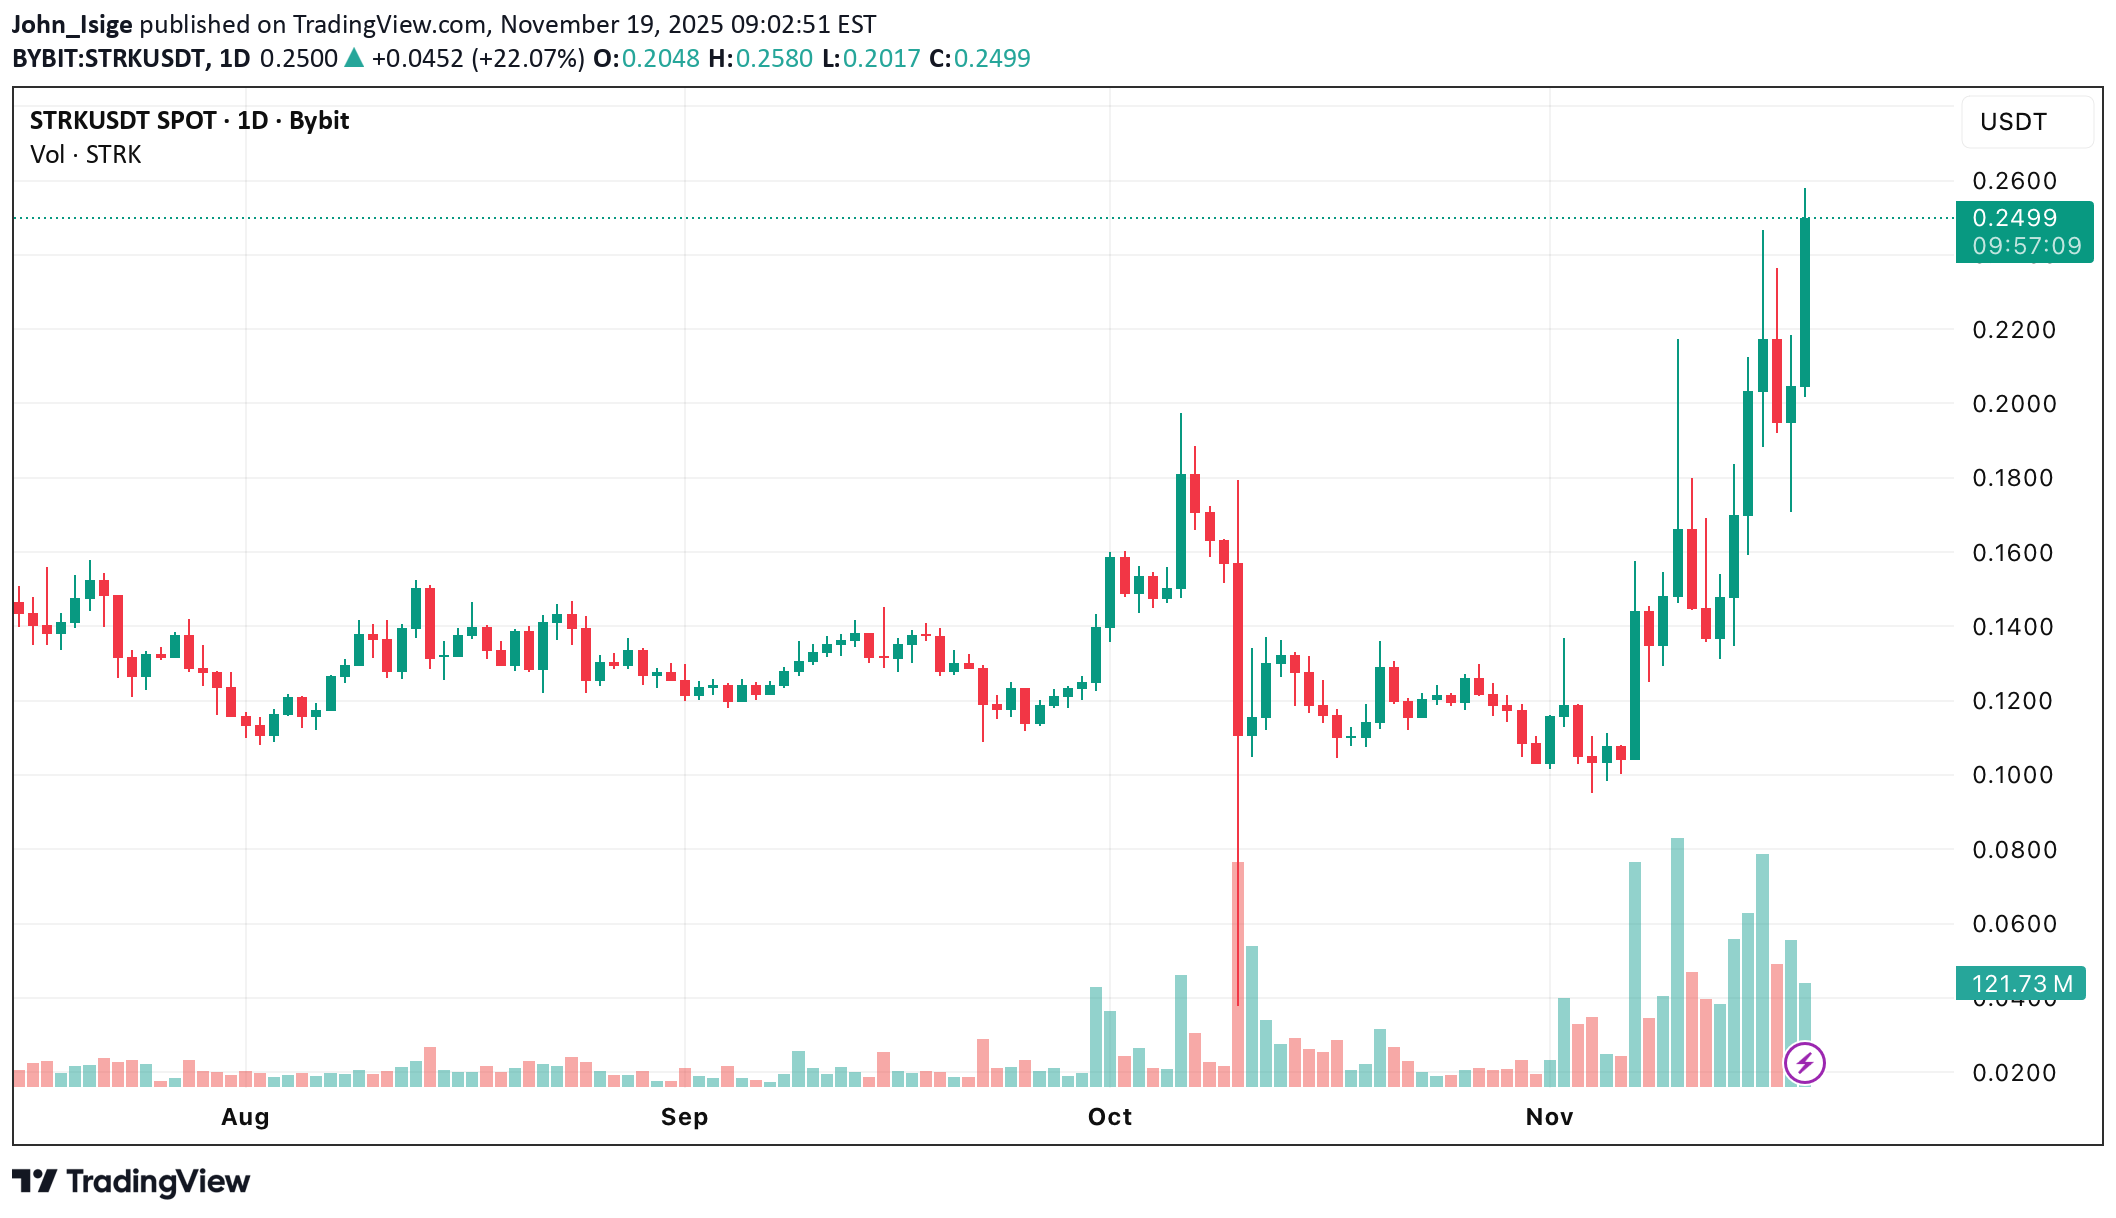
سکه STRK منفجر شد: تحلیل جدید و پیشبینی صعود تا ۰.۳۵۰ دلار!
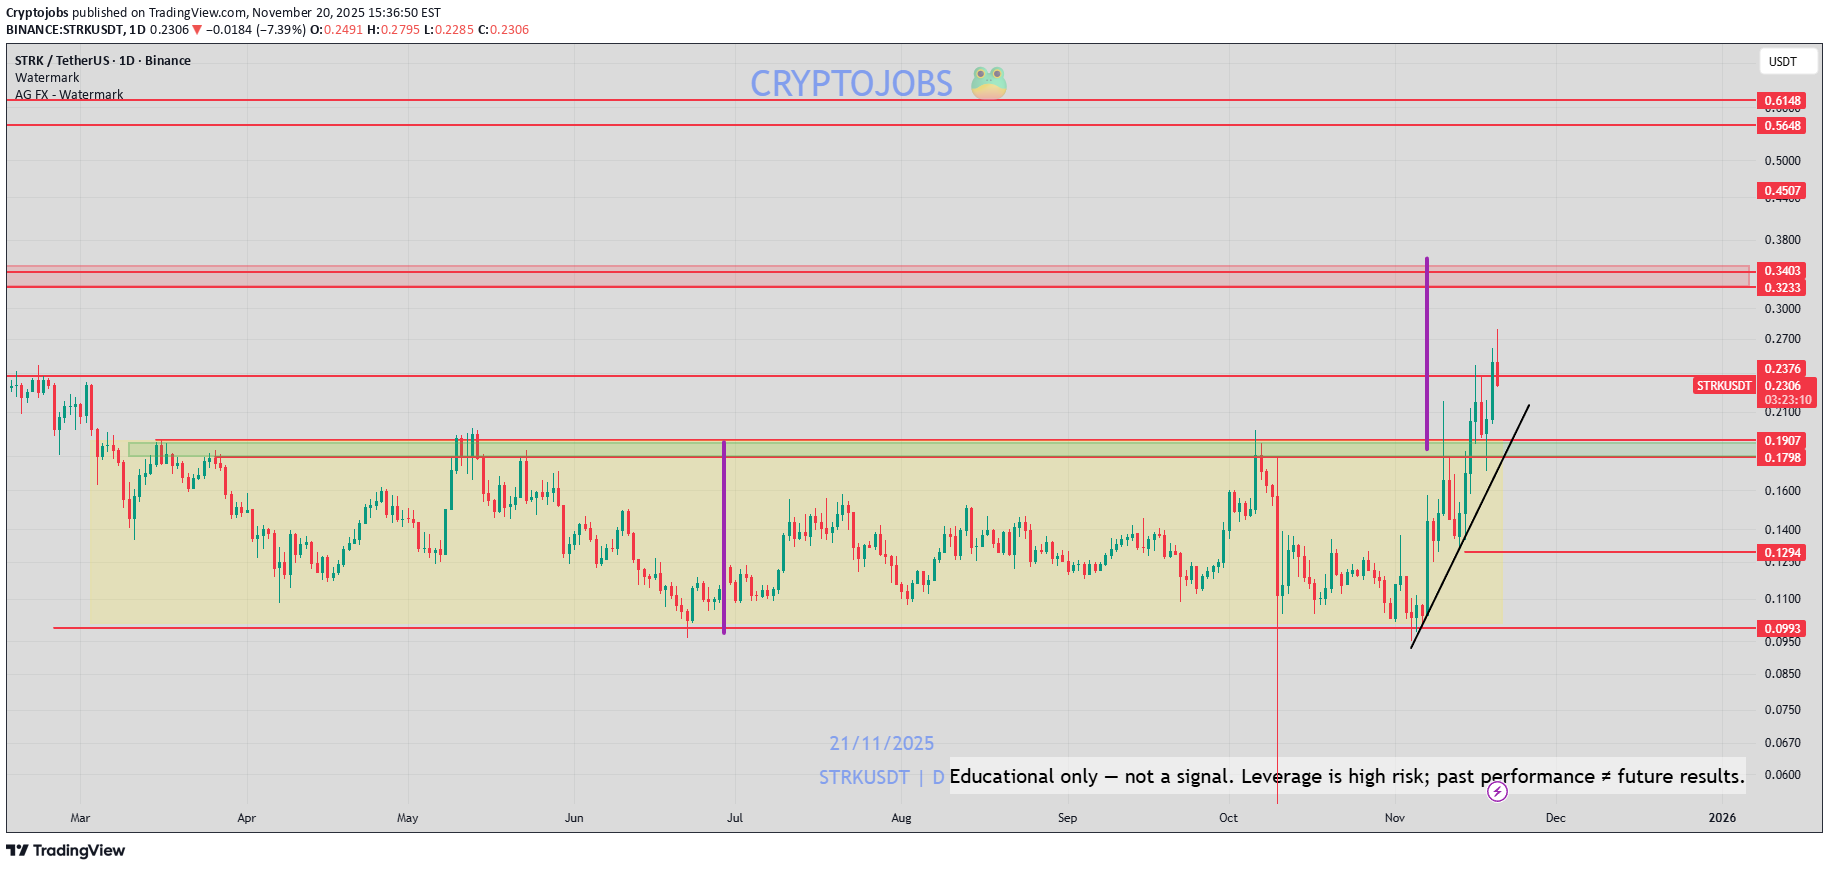
STRK - following my lines, solid PA 📈 +110% up fvrom the 0.1300$ zone I gave you!! 🔥 0.340 - 0.350$ is gonna be see I think, momentum is strong, and rember, price is moving above the 265 days RANGE breakout!
سیگنال فروش فوری STRK/USDT: ورود در ۰.۲۵۸۸ و تارگتهای هیجانانگیز!
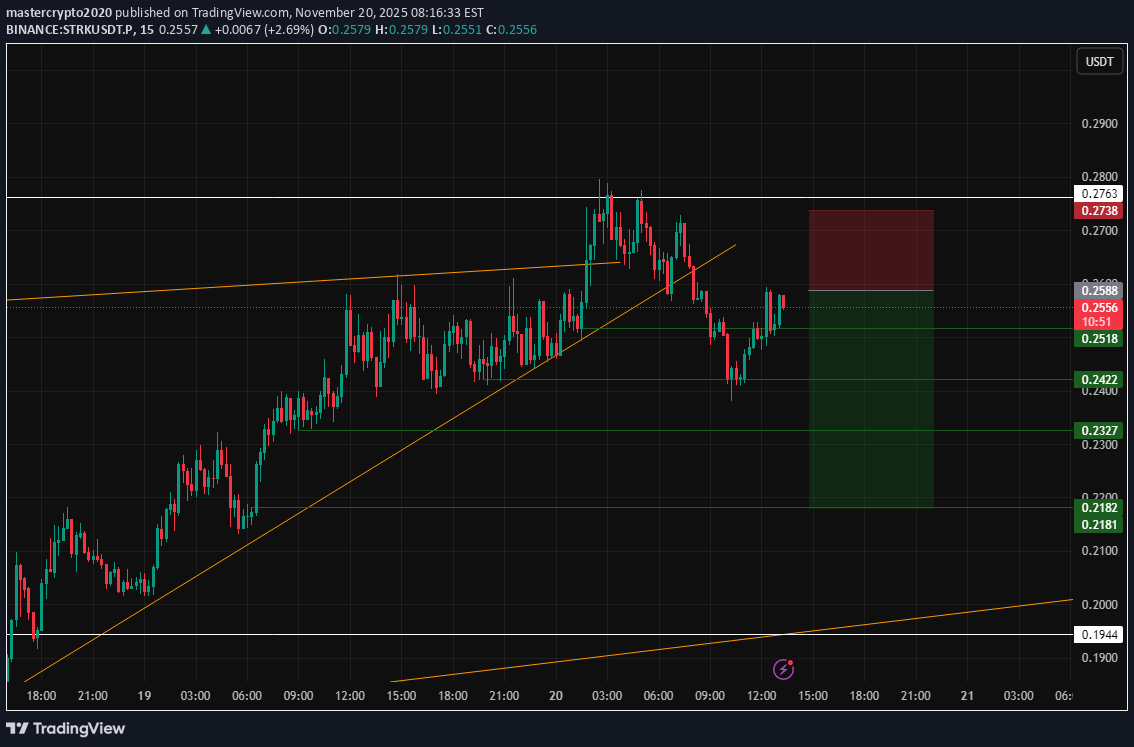
Sir📢 Signal 🔹 :Strk.USDT 📉 Trade Type:short 💰 Entry Point:. 0.2588 🎯 Targets (with withdrawal management): ▫️ TP1=0.2518 ▫️ TP2=0.2422 ▫️ TP3 =0.2327 TP4=0.2182 TP5= TP6= 🛑 Stop Loss= 0.2740 📊 Timeframe: ⚖️ R/R: 📌 Recommended Leverage:.5 or 10 ⚠️ Money Management Required Please log in after checking the chart

Elimzo
ایده سرمایهگذاری STRK: چرا استارکنت و حریم خصوصی، موتور محرک رشد بعدی بازار کریپتو هستند؟
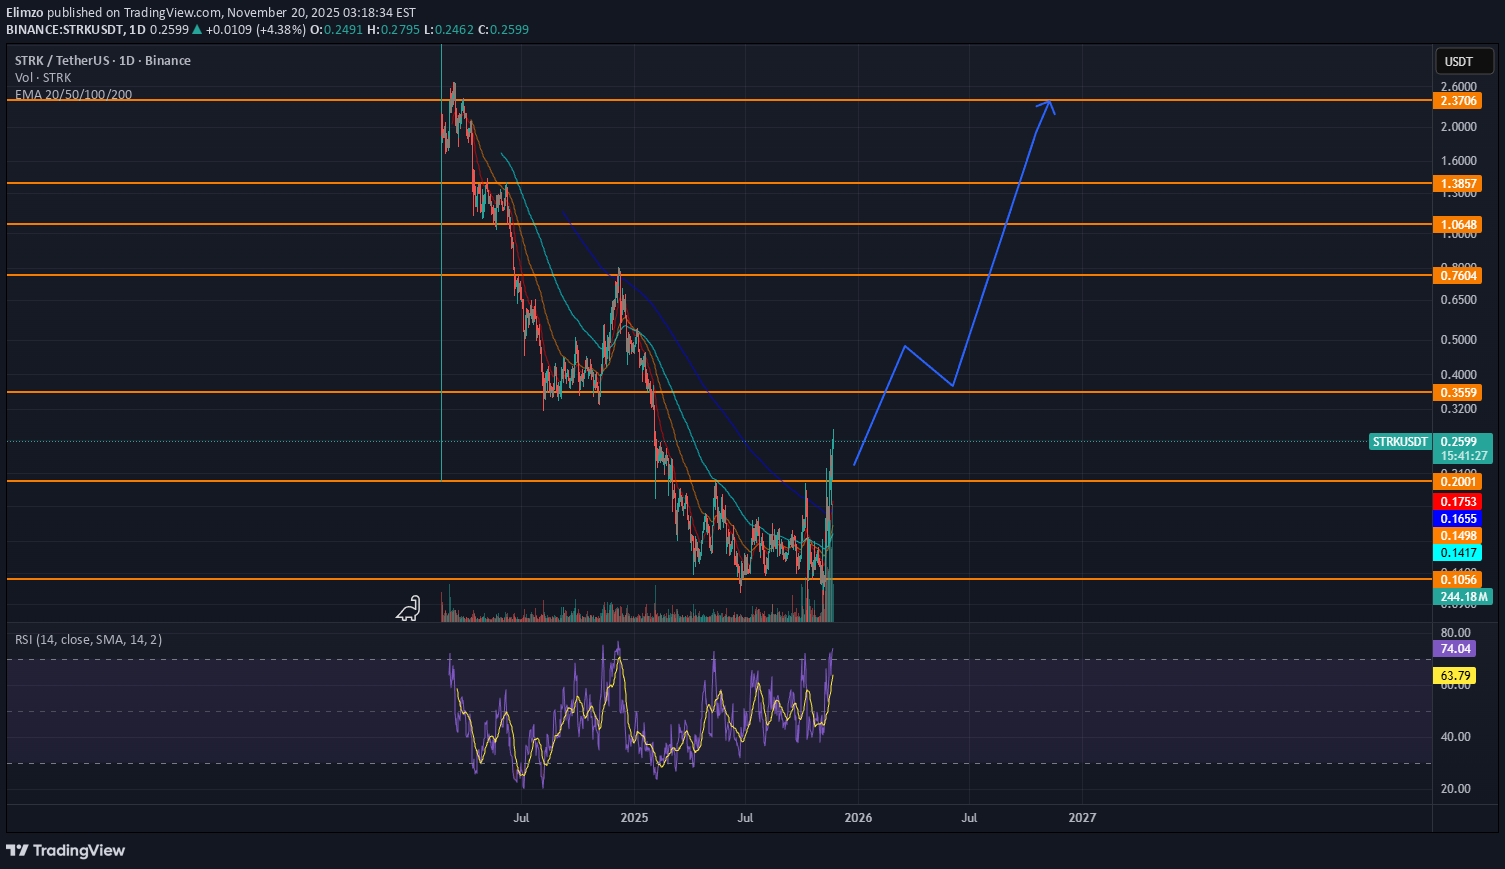
Privacy is back at the center of the crypto narrative - everyone is pushing the topic, including Vitalik Buterin. People are simply tired of shining their addresses and balances. Against this background, interest in Starknet, which now cooperates with ZEC, has sharply increased on Twitter. 20% of the total coin supply is already in staking. The price has consolidated above the upper limit of the accumulation range of $ 0.10-$0.16 and is gradually approaching the main resistance zone of $ 0.34-$0.52, which previously acted as support. The main sellers are sitting below $0.52 and are gradually capitulating on the price increase, dropping positions to breakeven or a small plus (most portfolios are in deep red) bSmooth growth with pullbacks is an ideal scenario for price recovery, in which, when fixed above $ 0.52, the main push will begin without unnecessary passengers.

DragonCaoB
سیگنال فروش داغ: ترید نزولی استراتژیک با ریسک به ریوارد عالی (STRK)
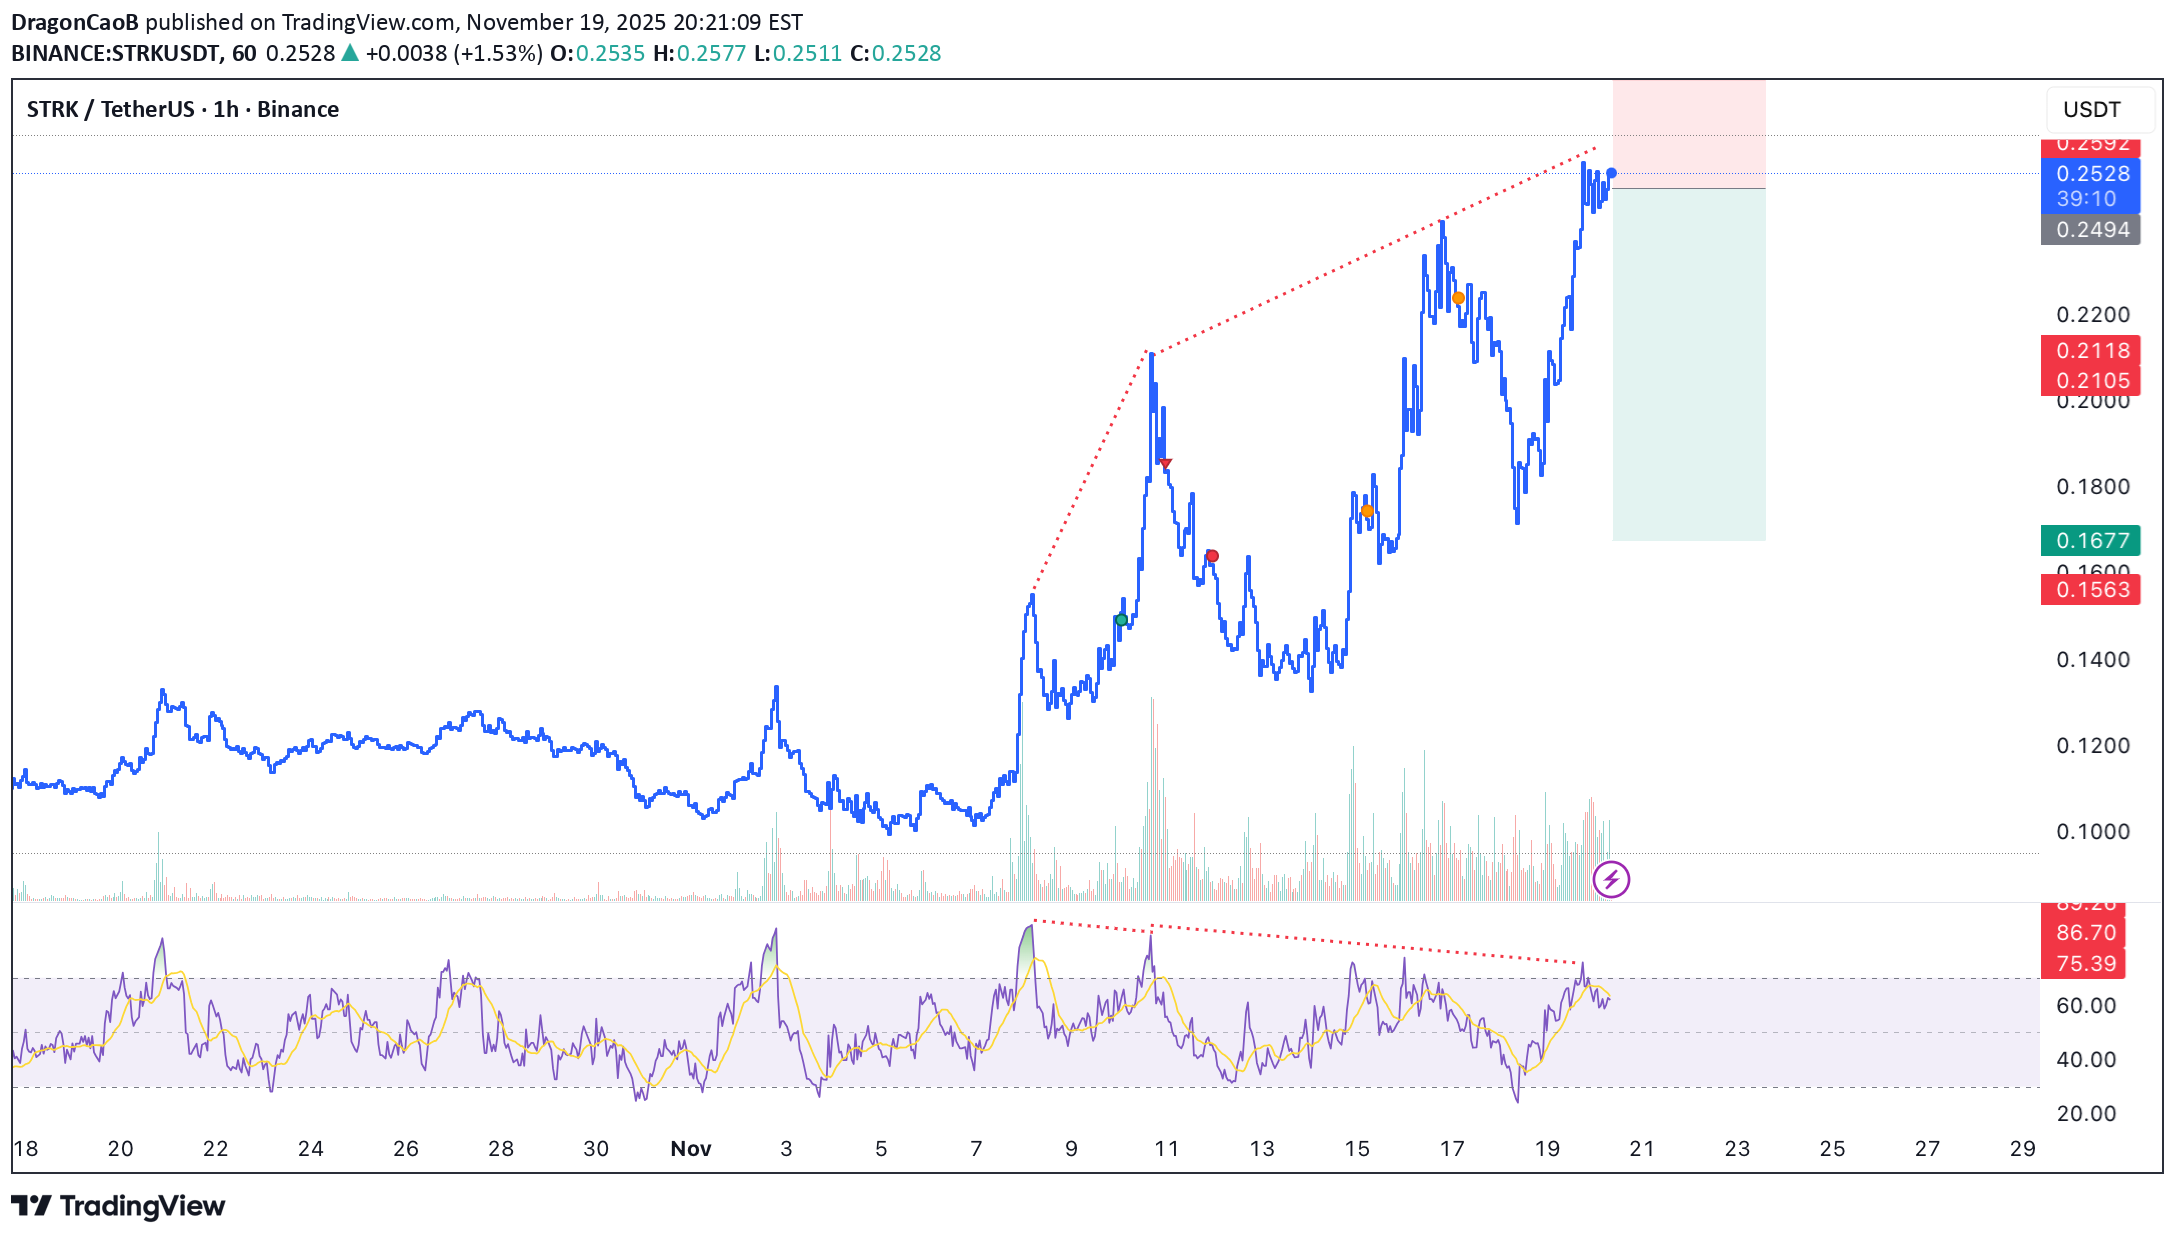
🐻 Scalp SHORT – STRK RSI is extremely overbought on the 1h timeframe, accompanied by two clear bearish divergences, signaling weakening bullish momentum. Price has repeatedly failed to break major resistance, confirming selling pressure is taking control and a downside correction is highly probable. 🎯 Trade Setup: TP: 0.1678 SL: 3.28 RR: 1 : 5.12 A clean short setup: strong bearish divergence, failed breakout attempts, and clear correction signals.

استارکنت (STRK): آیا شکست ۰.۲۴۶۷ قیمت را به کجا میبرد؟
Starknet (STRK) continues its strong rebound after broad market sell-offs, maintaining a clean short-term uptrend. Price action remains constructive, holding firmly above the 20-day EMA (0.2074) and forming higher highs and higher lows — a classic bullish structure. Over the past 24 hours, STRK traded between 0.2321–0.2459, with the latest close at 0.2417, well above yesterday’s 0.1911. Rising volume supports the move, while market cap is now $1.09B. Key Technical Signals •Price above 20-EMA → trend intact •RSI (61) → bullish momentum without overbought stress •Momentum histogram → strengthening positive impulse •Bollinger width at 0.064 → volatility rising but controlled Immediate resistance sits at 0.2393–0.2467, and this zone is the key trigger for the next trend leg. ⸻ Scenario Outlook (TradingView Style) 🔵 Neutral Scenario (40%) •Range: 0.205 – 0.260 •Trigger: RSI stays between 50–65, price consolidates above EMA-20 •Invalidation: 0.195 •Key Levels: •EMA-20 at 0.2074 •Upper Bollinger at 0.2440 •Fibonacci support at 0.1560 Neutral bias holds as long as STRK respects 0.2074 and volatility remains stable (<150M volume). ⸻ 🟢 Bullish Scenario (35%) •Target: 0.247 – 0.350 •Trigger: •Breakout above 0.2467 •Daily candle closes above key resistance •Volume >150M •RSI pushes above 70 •Invalidation: 0.20 •Long-term reference: ATH at 4.41 USD A clean break of 0.2467 could ignite momentum toward 0.30–0.35. ⸻ 🔴 Bearish Scenario (25%) •Target: 0.12 – 0.20 •Trigger: •Drop below EMA-20 (0.2074) •RSI dips under 50 •Breakdown below 0.1560 Fibonacci •Invalidation: 0.26 •Key Levels: •Lower Bollinger at 0.1796 •Fib support 0.1560 Below 0.195, pressure increases sharply and sellers regain control. ⸻ Short-Term Outlook The structure remains bullish above 0.2074, and a breakout above 0.2467 will likely attract new buyers and unlock upside toward 0.30–0.35. Below 0.195, the trend weakens and risk shifts toward 0.1560.

SpecuVisionary
تحلیل STRK: الگوی انباشت «وایکوف» کامل شد؛ آماده جهش به ۰.۴۵ دلار؟
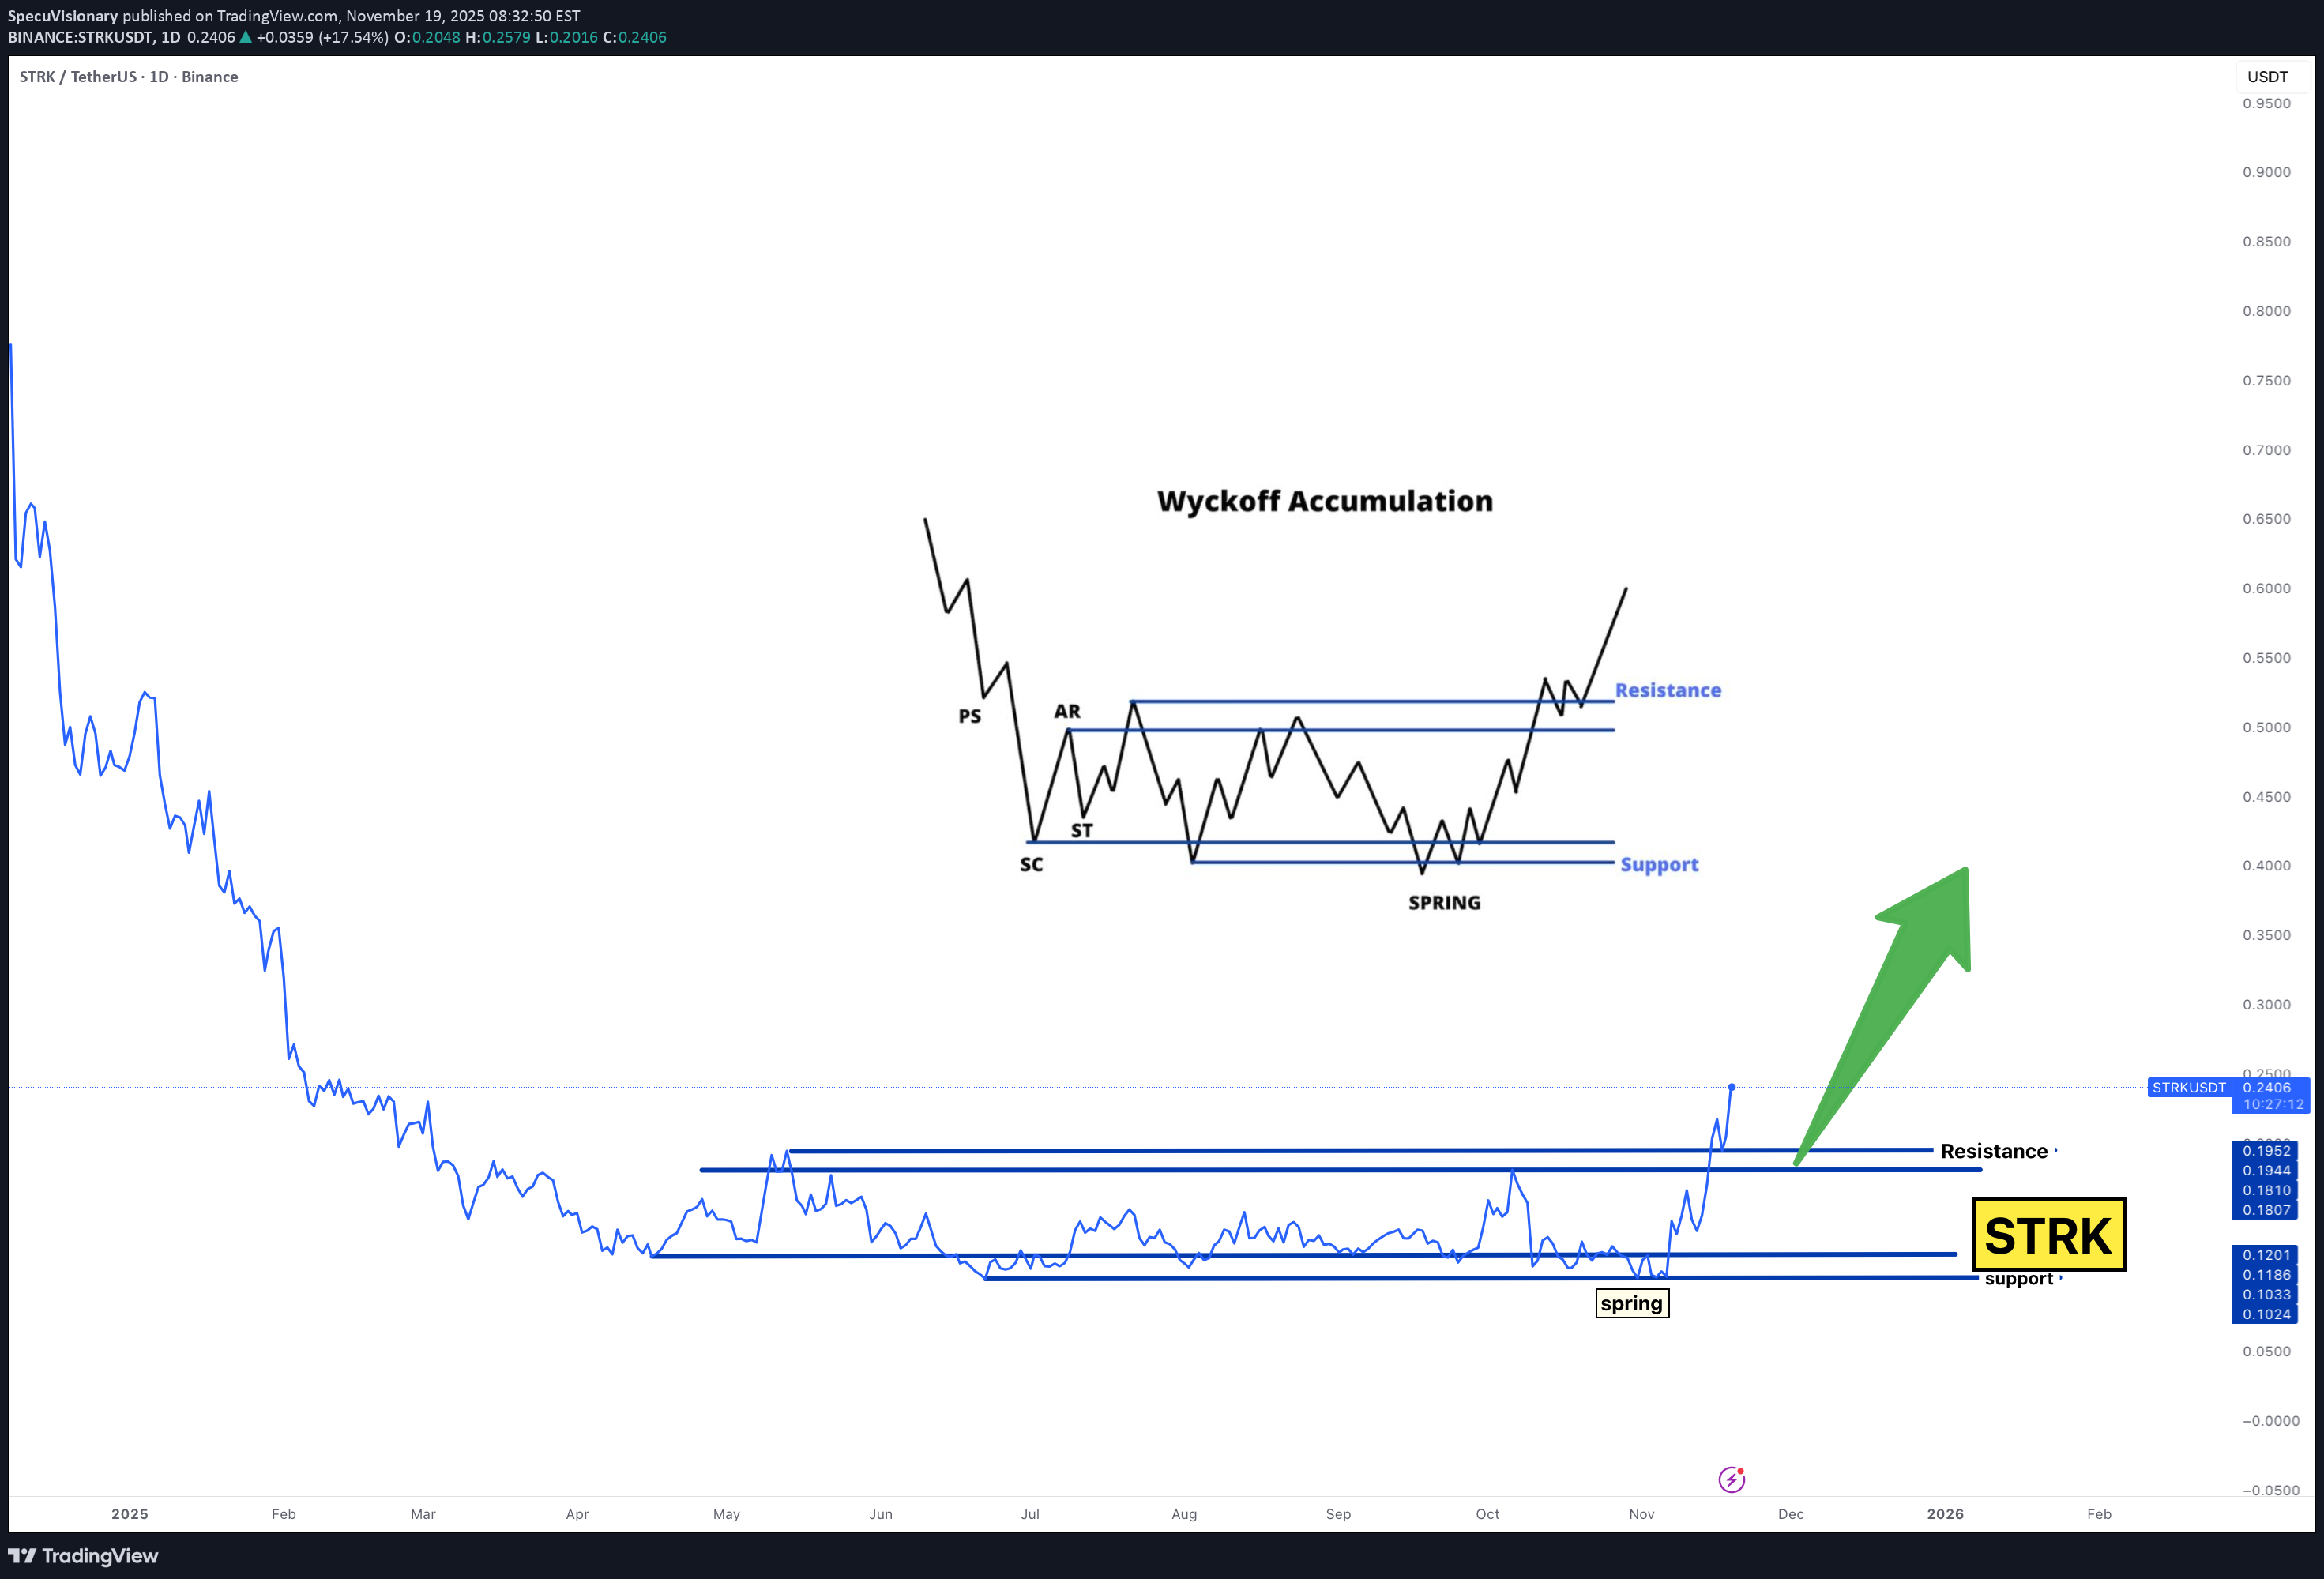
The chart literally looks like it was copied straight from the textbook: Selling Climax → ST → Spring → Breakout Perfect reclaim of the entire range Volume kicking in right at resistance Composite Operator behavior all over this This is the kind of setup most traders only recognize after the markup begins. If this plays out: 📌 $0.25 → $0.34 → $0.45+ That’s the path. Not a guarantee — just a pattern the market has respected for over 100 years. This is why you study structure. This is why you watch accumulation ranges. STRK is waking up. STRK #Wyckoff
Disclaimer
Any content and materials included in Sahmeto's website and official communication channels are a compilation of personal opinions and analyses and are not binding. They do not constitute any recommendation for buying, selling, entering or exiting the stock market and cryptocurrency market. Also, all news and analyses included in the website and channels are merely republished information from official and unofficial domestic and foreign sources, and it is obvious that users of the said content are responsible for following up and ensuring the authenticity and accuracy of the materials. Therefore, while disclaiming responsibility, it is declared that the responsibility for any decision-making, action, and potential profit and loss in the capital market and cryptocurrency market lies with the trader.