
SpecuVisionary
@t_SpecuVisionary

What symbols does the trader recommend buying?
Purchase History
پیام های تریدر
Filter
SpecuVisionary
تحلیل STRK: الگوی انباشت «وایکوف» کامل شد؛ آماده جهش به ۰.۴۵ دلار؟
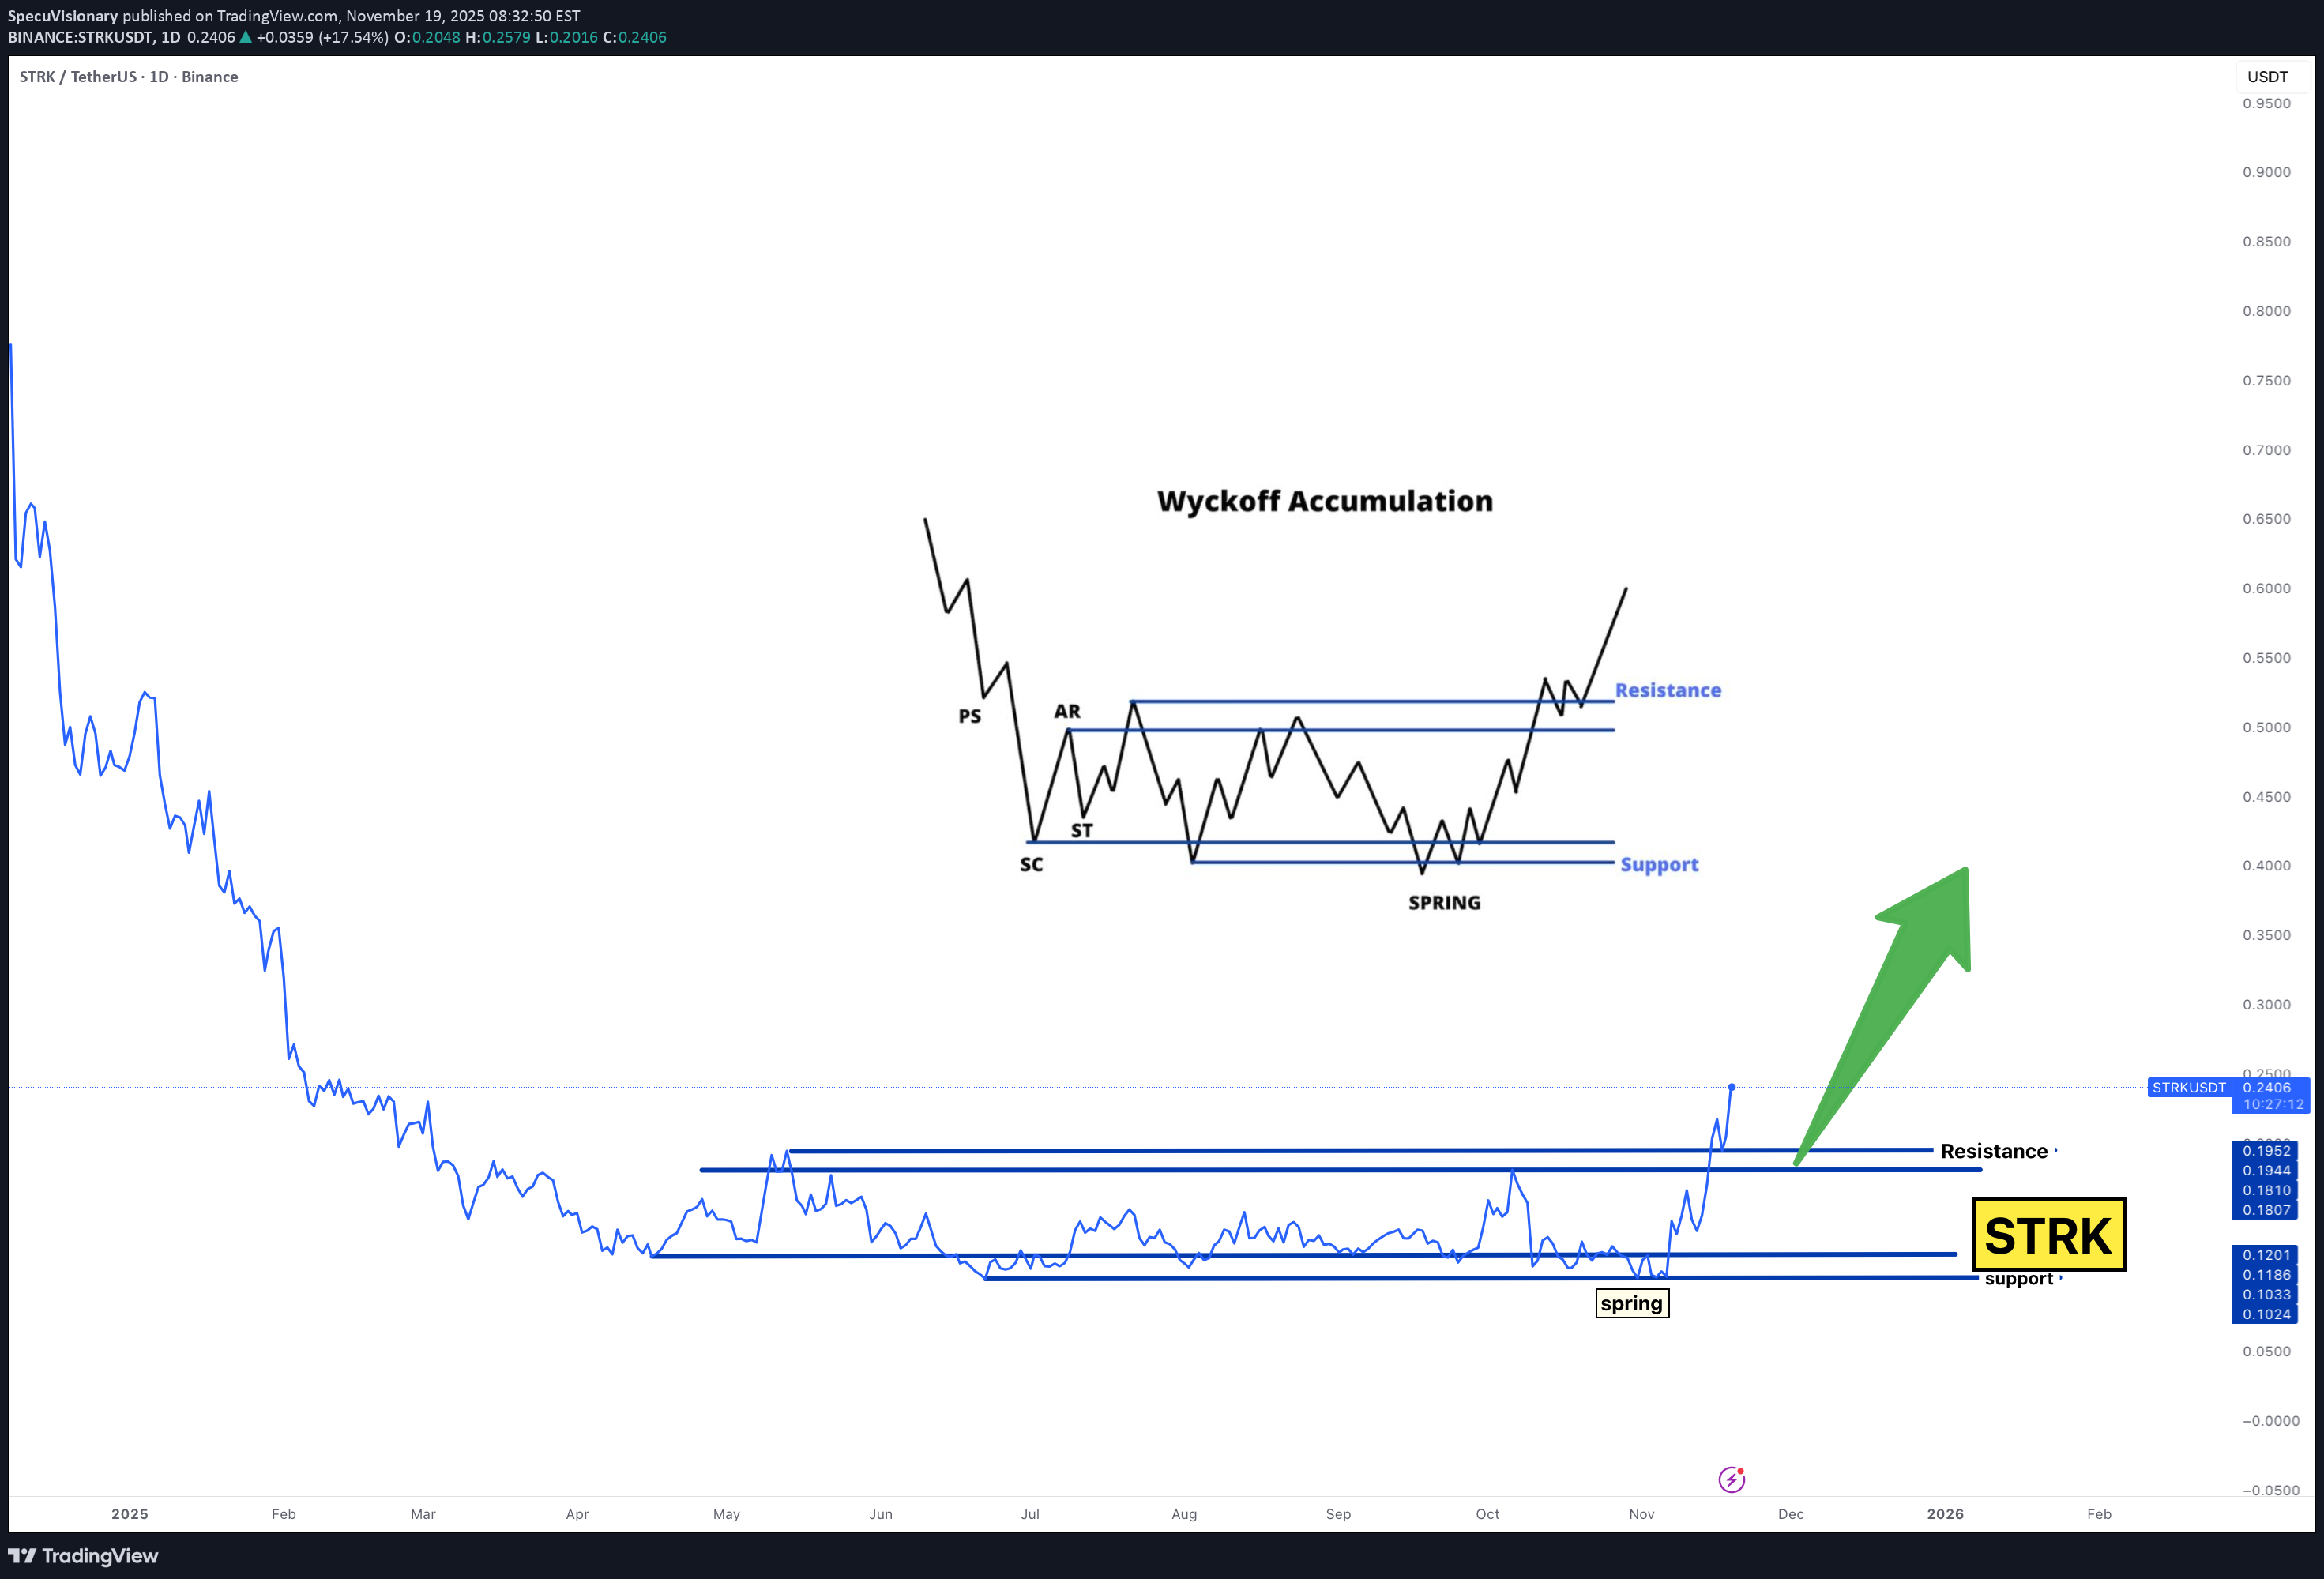
The chart literally looks like it was copied straight from the textbook: Selling Climax → ST → Spring → Breakout Perfect reclaim of the entire range Volume kicking in right at resistance Composite Operator behavior all over this This is the kind of setup most traders only recognize after the markup begins. If this plays out: 📌 $0.25 → $0.34 → $0.45+ That’s the path. Not a guarantee — just a pattern the market has respected for over 100 years. This is why you study structure. This is why you watch accumulation ranges. STRK is waking up. STRK #Wyckoff
SpecuVisionary
رمز ارتقای استراتژیک: آیا STRK در سکوت در حال ساخت هیولای وایکوف است؟
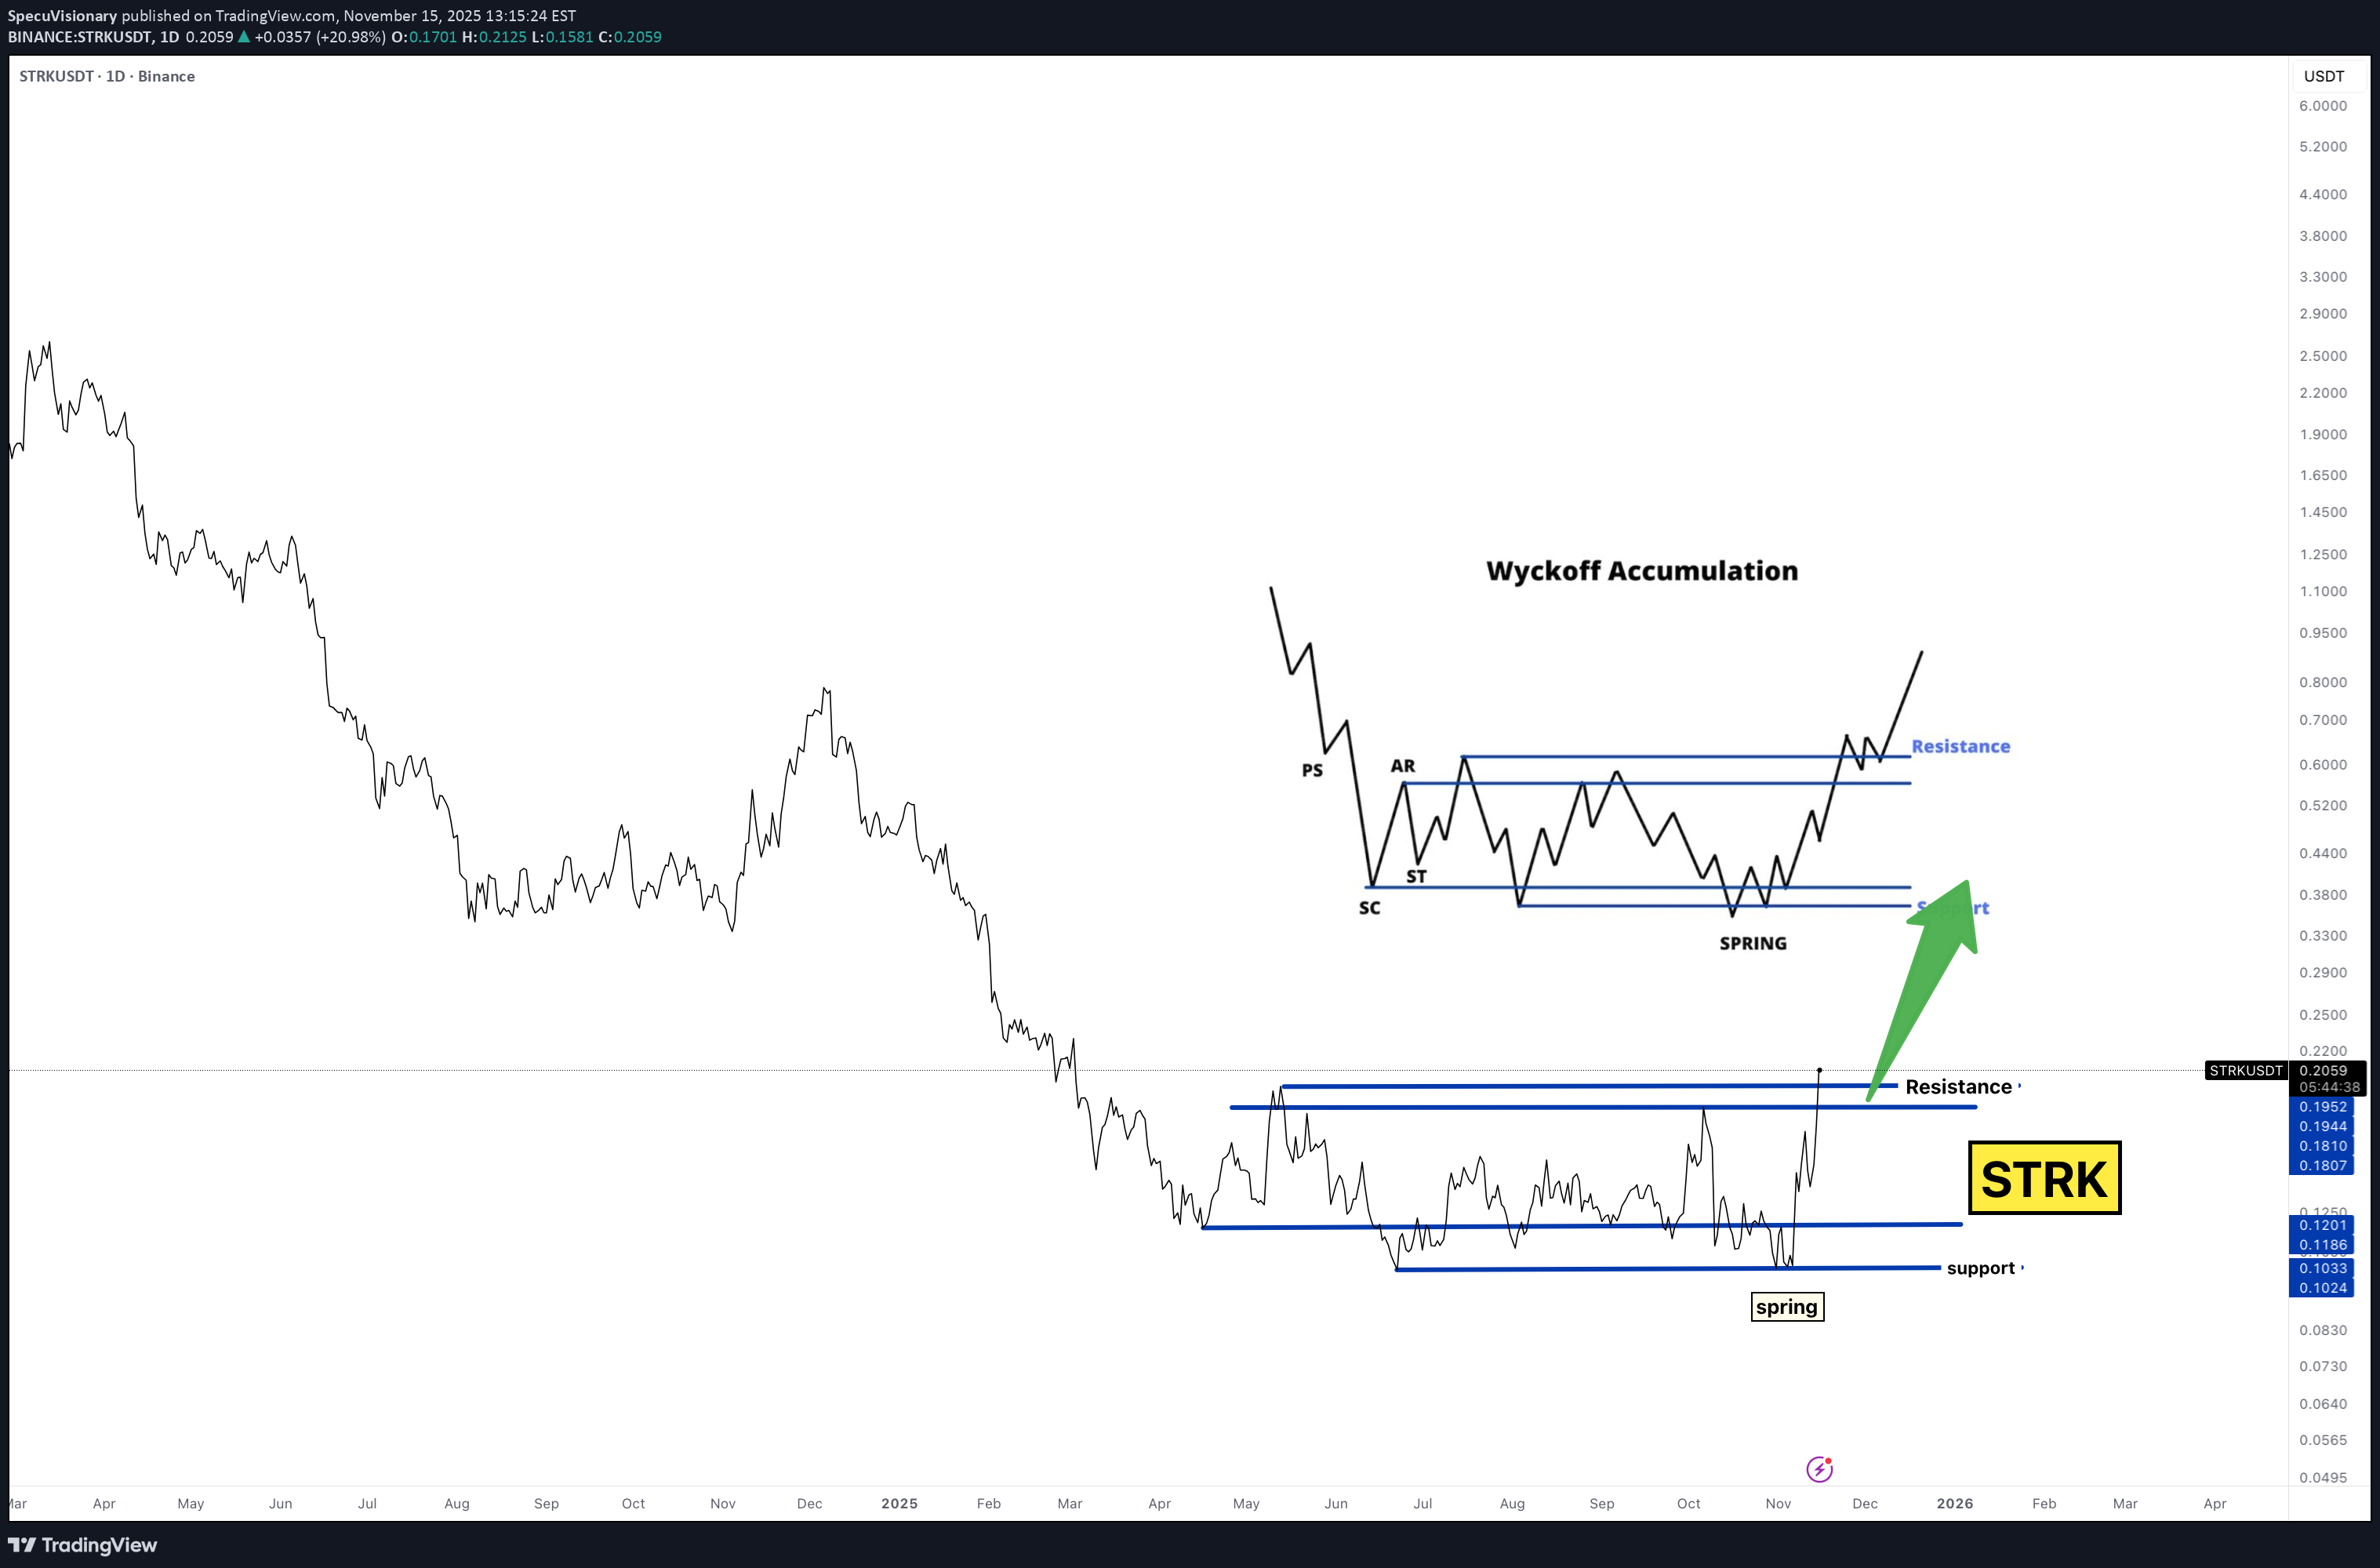
TRK is doing EXACT Wyckoff… and nobody is paying attention. This is the setup smart money dreams of: Selling climax? ✔️ Secondary test? ✔️ Spring? ✔️ Back into range + breakout attempt? ✔️ This is textbook Wyckoff Accumulation — the kind you screenshot and show your kids in 10 years. Most people won’t notice this pattern until it’s already +200% higher. You’re seeing it early. If Wyckoff plays out: 📌 0.22 → 0.45 → 0.70 That’s the roadmap. Not financial advice — just reading the tape the way the composite operator intended. Bookmark this. Save the chart. Watch it unfold. STRK #Wyckoff #CryptoTrading #Accumulation #SpecVibe
SpecuVisionary
BTC/USD – Rising Wedge Breakdown + Double Top

Price action confirmed a bearish setup: Rising Wedge formed through June–July, showing slowing momentum. Double Top near 124K added further reversal pressure. Breakdown below wedge support + neckline confirms sellers in control. 📉 Key levels to watch: First downside target zone: 100K–98K If momentum continues, extended target: 82K–80K ⚠️ Reclaiming 115K–116K would invalidate this bearish structure and suggest potential recovery.
SpecuVisionary
Bitcoin : Decision point here: trendline bounce vs. breakdown
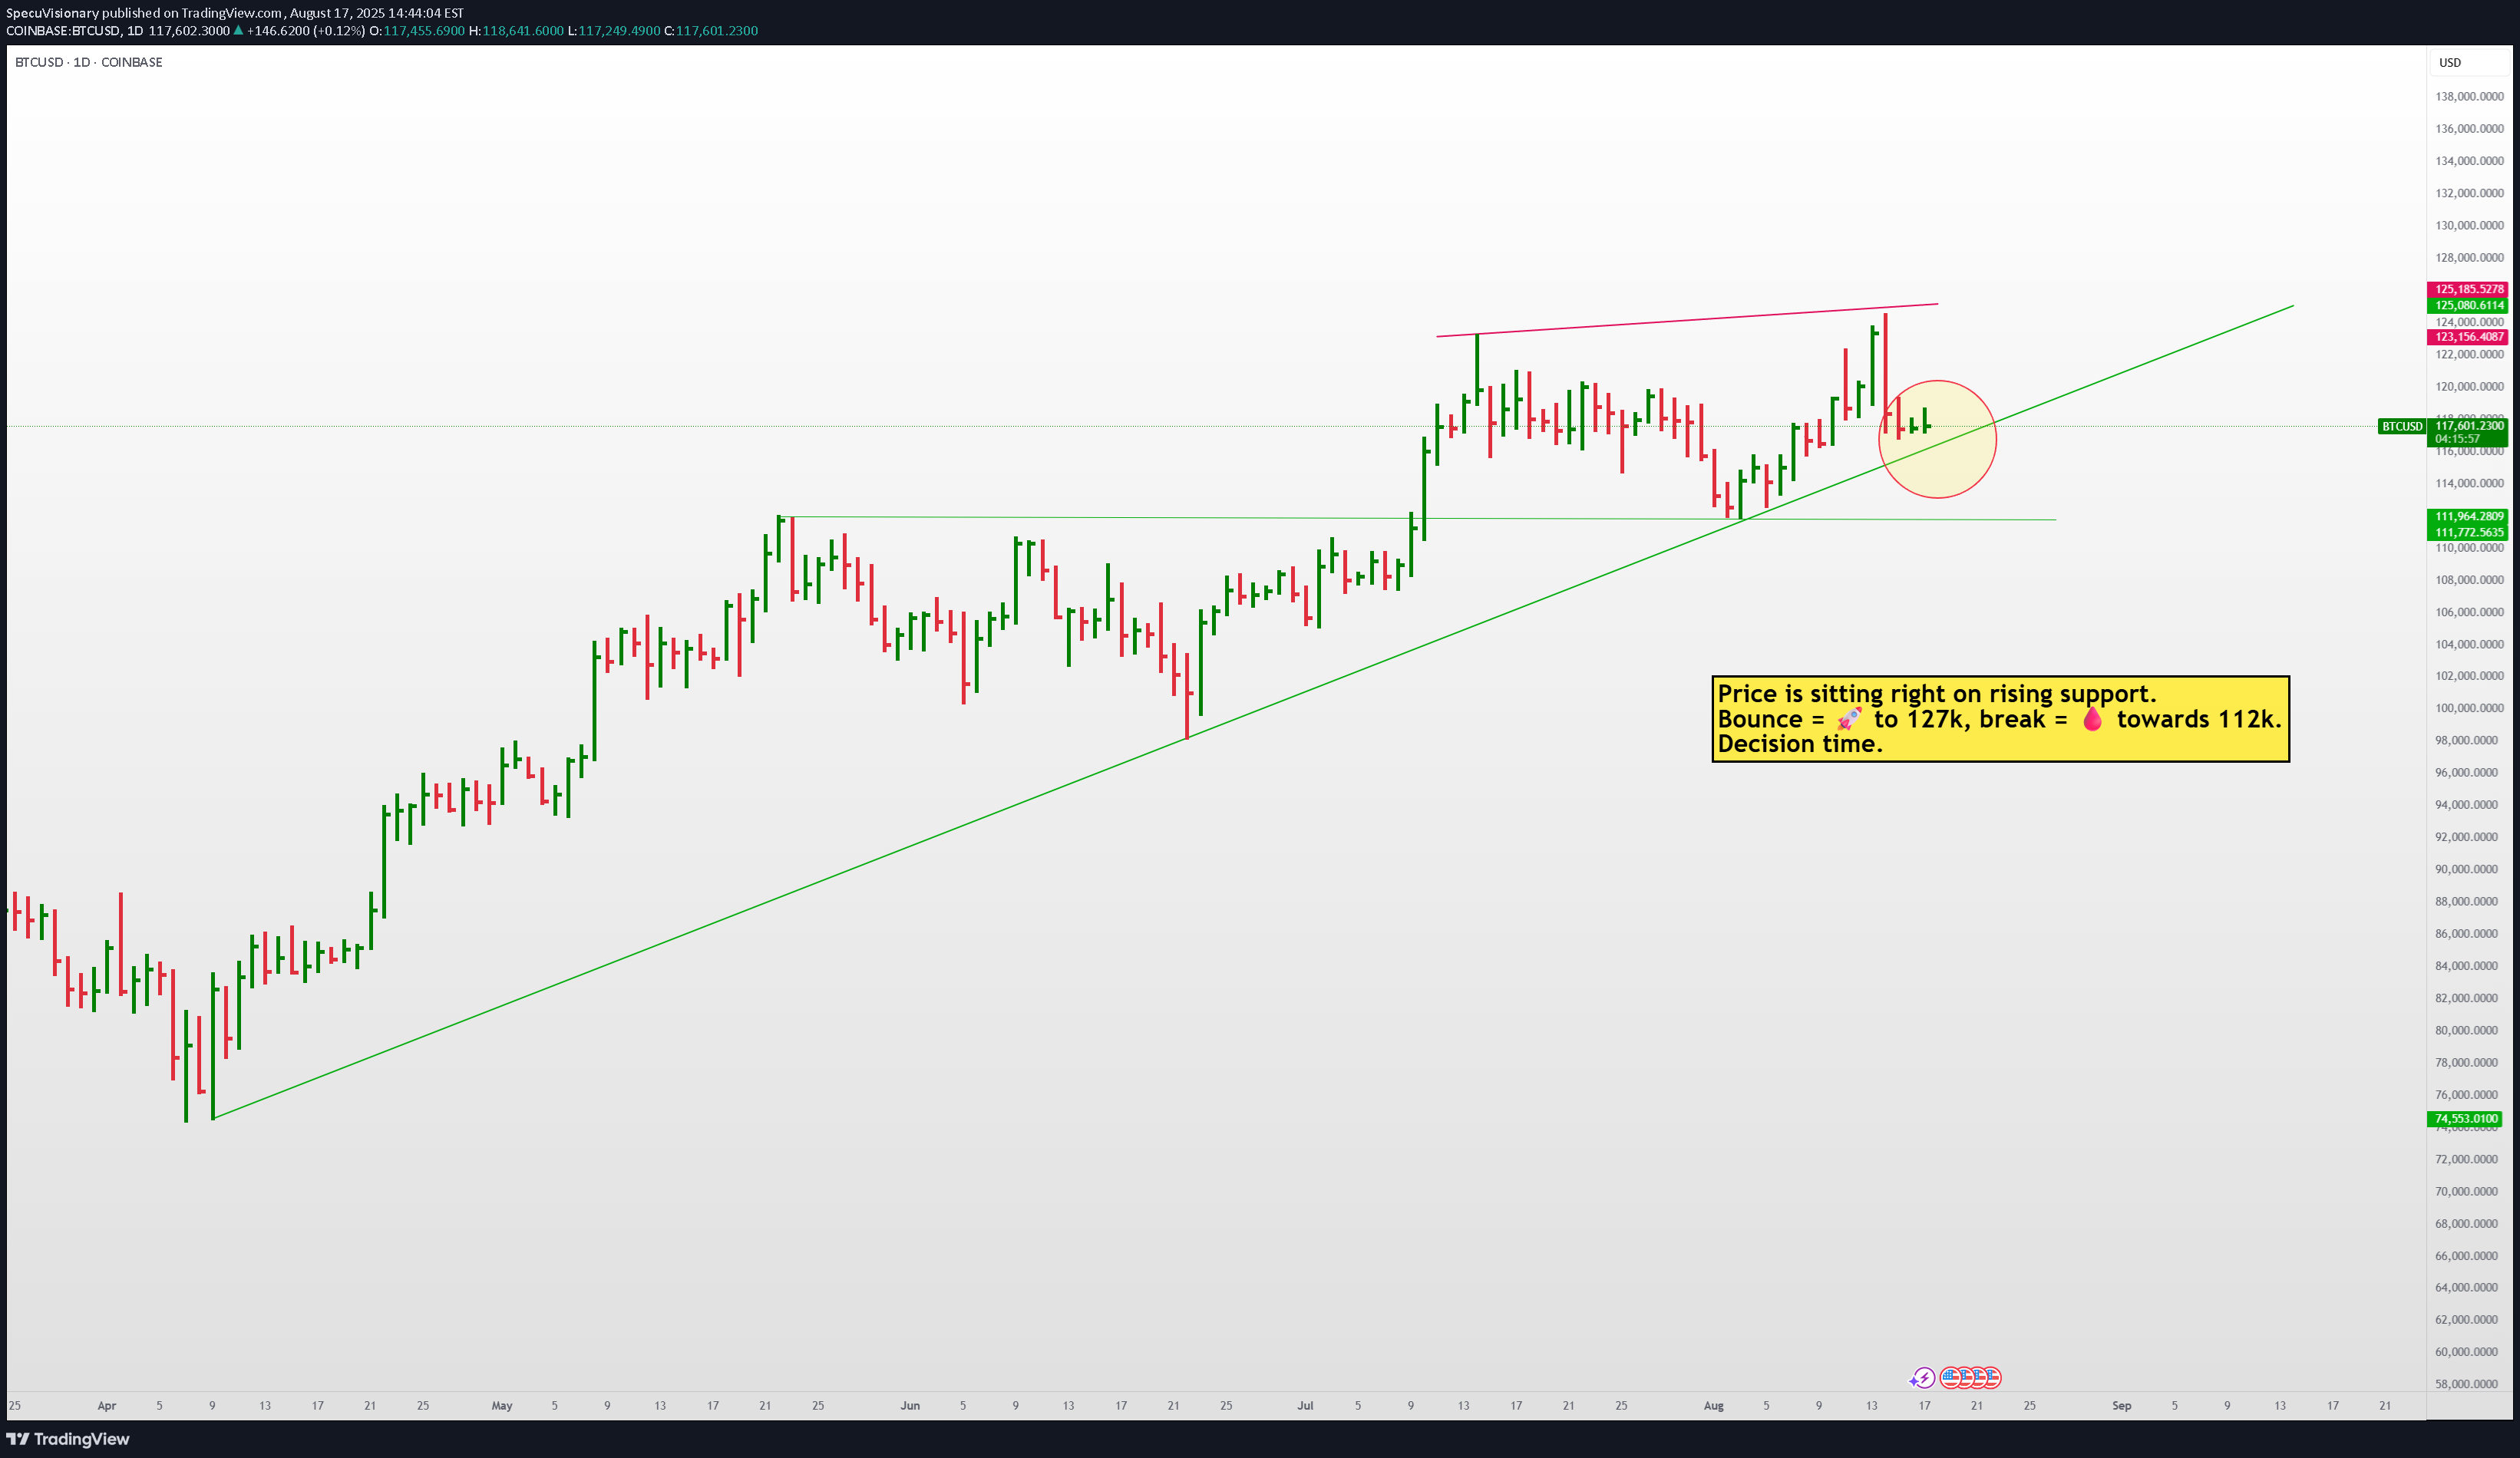
BTC/USD – Daily Price is testing the rising trendline support after a sharp rejection from recent highs. Currently sitting right on the line (circled), showing whether bulls can defend this level or if we risk a deeper pullback. 🔑 Key Levels: Support: $111,950 – $112,000 Resistance: $127,000 Rising trendline (watch closely for confirmation or breakdown). Momentum is slowing, and we’ve got regular bearish divergence on the histogram—suggesting caution. If this support holds, continuation higher is likely. If it breaks, expect retest of lower demand zones.
SpecuVisionary
SOLANA - Tale of Two Extremes
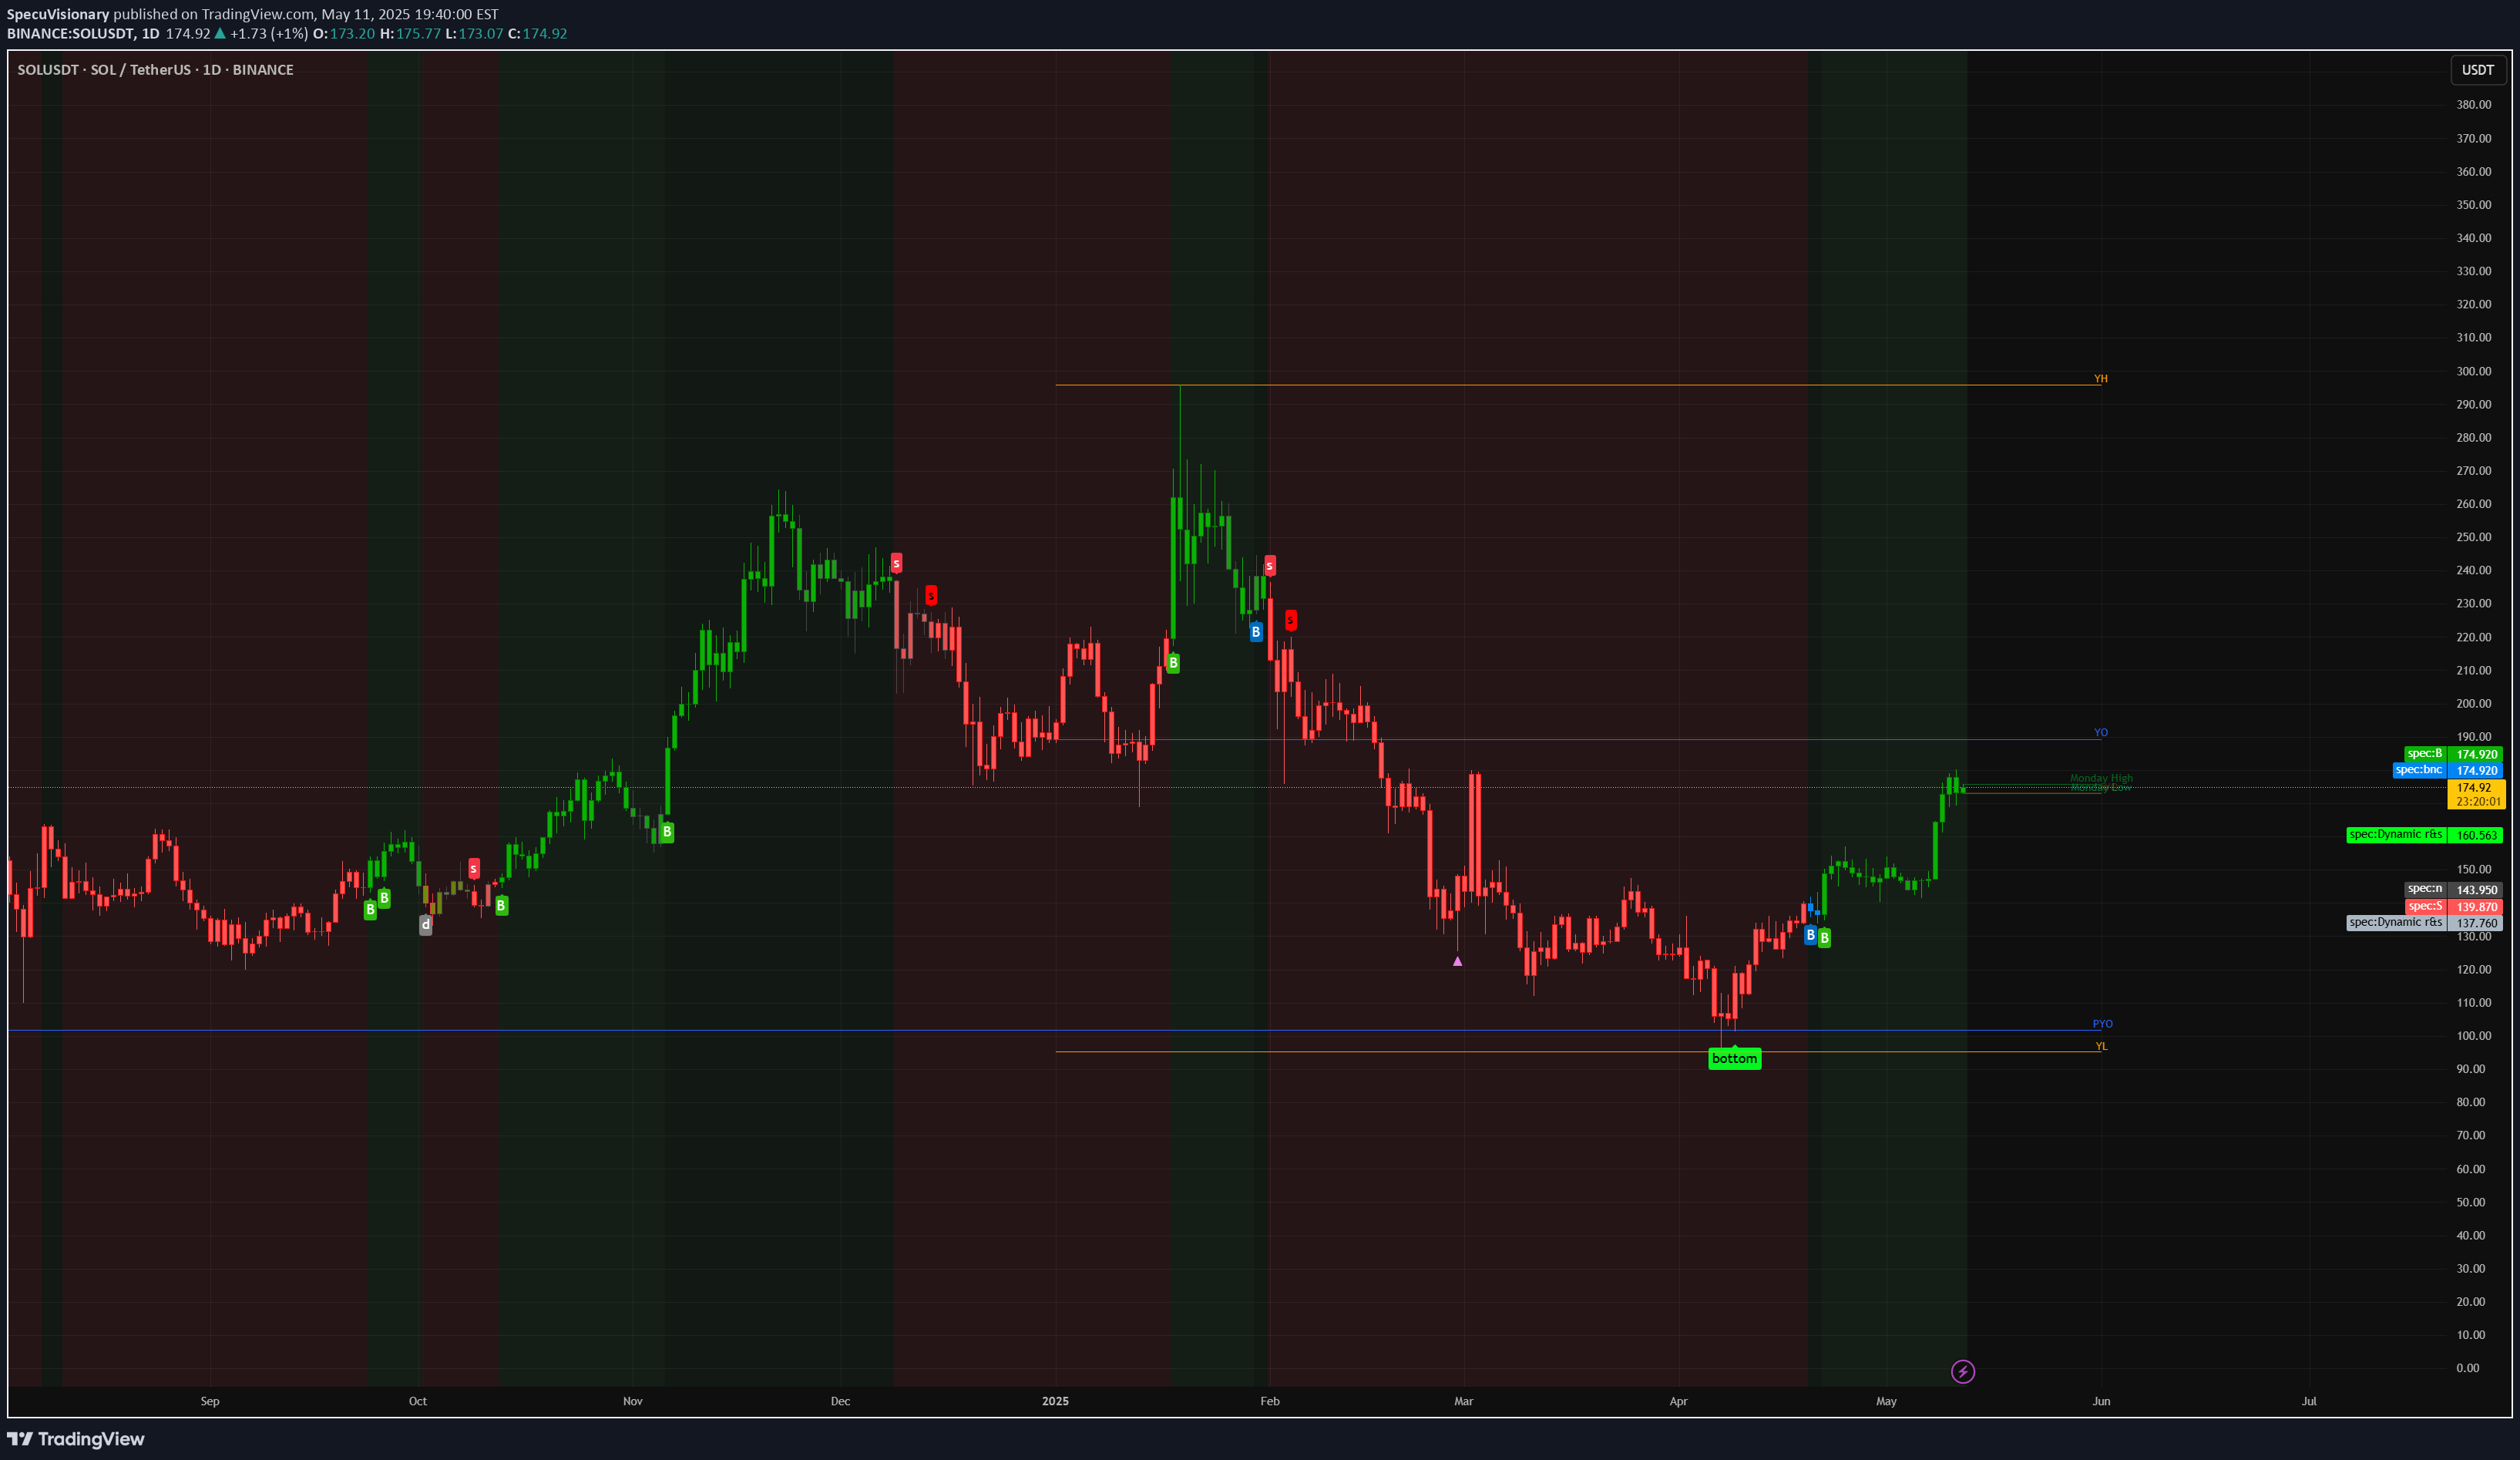
Over the past ten months, Solana’s price action has swung from manic highs down to panic lows—and now into a disciplined base: Euphoric Rally (Oct ’24 – Dec ’24) SOL surged from ~$100 to a December peak near $290 on booming DeFi activity, NFT hype, and new network tooling. The green‐shaded bars in late November/early December mark a near-vertical ramp, with “B” buy signals clustering as momentum supercharged itself. Brutal Unwind (Jan ’25 – Mar ’25) Once Bitcoin stalled and macro headwinds arrived, SOL gave back almost two-thirds of its value, plunging from $270 to a $96 trough by mid-March. Red “S” sell markers at lower highs confirmed aggressive profit-taking and capitulation. Disciplined Base Building (Mar ’25 – May ’25) A clear single bottom at the P0 pivot around $96 (also last year’s low) drew in fresh bids each time price tested that floor. Since early April, SOL has chopped sideways between $100–$140, tightening volatility and coiling like a spring. 2. Technical Anatomy of the Bounce As of today, SOL sits at $175.43, flirting with short-term resistance and carving out a fresh up-move: LevelPriceRole Current (Monday’s High)$175.43First line for breakout conviction Year-Open Pivot (Y0)$189.50Next hurdle—flip to support if cleared Year-High (YH)$295.00Measured target of the Dec rally Dynamic Fib R1$160.56Prior falling-wedge resistance, now support Dynamic Fib R3$137.76Secondary support on pullbacks Volume & Momentum: Recent green candles have arrived on increasing volume, and fractal buy signals (“B” dots) cluster on each higher low—classic signs of renewed demand. Pattern Resolution: What looked like a falling wedge from January has broken up through its upper trendline, validating the bullish bias. 3. Catalysts & Sentiment Drivers Macro Tailwinds: Any dovish shift in Fed policy or a sustained Bitcoin rally above $70K will likely turbocharge altcoins like SOL. On-Chain Upgrades: Watch for network announcements (e.g., new staking features, throughput improvements) that can reignite developer interest. Event Flow: FTX Claim Distributions: Final phases due in late May could return tokens into the ecosystem and fuel liquidity. DeFi Incentive Programs: Fresh liquidity mining launches often spark sharp altcoin reprieves. 4. Strategic Playbook Aggressive Entry: Trigger: A daily close above $175.43 (Monday’s high) locks in the breakout. Targets: $189.50 (Y0 pivot) $230–$250 (interim swing highs) $295 (YH, the December peak) Risk-Managed Longs: Pullback Setup: A retrace to $160.56 (Dynamic Fib R1) offers a lower-risk entry with tight stops below $155. Stop Loss: Under $137.76 (Dynamic Fib R3) keeps you clear of a retest of the March low. Option Flavor: Call Spreads: Consider a $180/$200 call spread into June expiries—defined risk with asymmetric upside if SOL breaks higher. Caution: A failure to hold $160 on a daily close exposes SOL back to the coiled range ($140–$100), so trim or hedge if that level cracks. 5. Conclusion: Coiled for Altseason Solana’s collapse from $290 to $96 cleaned out weak hands. The subsequent wedge-style base and recent breakout attempt speak to a market that’s ready for its next leg up—provided it can conquer $175.43 and flip $189.50. Keep an eye on on-chain news and macro flows: if they align, SOL could sprint toward $230 and beyond, rejoining the next chapter of crypto’s broader altseason.
SpecuVisionary
$HYPE: The Return of the King or Another Fakeout

The H HYPE/USDT chart just broke through key resistance levels with a massive green thrust, pushing past $21.89 and rocketing above $25.50 — levels we haven’t seen since February. Here’s why this breakout matters: ✅ Reversal Confirmation: We’ve been in a textbook downtrend from February through early April, but notice the clean series of higher lows and higher highs building over the past month. This isn’t just a bounce — it’s a structural trend shift. ✅ Dynamic Resistance Flipped: Both the $21.89 and $17.43 dynamic resistances (marked on the chart) were cleanly smashed and are now acting as support. This flip is crucial because it shows buyers aren’t just testing — they’re claiming territory. ✅ Volume and Candle Strength: Look at the size of those recent green bars: big-bodied candles, minimal wicks, aggressive closes. That’s momentum money stepping in. ✅ Sentiment Surge: The ticker is literally called HYPE , but this is real hype — we’re watching the market front-run the rest of retail, setting up for a potential FOMO wave once we breach $27–$28 (Yearly High region). But Here’s the Caution: ⚠️ We’re entering a high-liquidity hunting zone between $25.50 and $28. This is where algorithms often bait breakout traders, whip back, and refill lower.
SpecuVisionary
Bitcoin Just Blasted Through $100K – Why $108K & $115K Are Next!

Summary Bitcoin has staged a clear turnaround after holding support near $76K in April and reclaiming critical dynamic resistances at $89.3K and $96.7K. On May 8, BTC printed a powerful rally candle that peaked at $102.7K, signaling a potential shift from range-bound chop back into an up-trend. This piece unpacks the price structure, macro drivers, and key levels, and lays out the scenarios for the next leg higher or a corrective pullback. Macro & Sentiment Backdrop Macro liquidity ebb & flow: Recent dovish commentary from the Fed reduced forward rate-hike risk, restoring confidence in risk assets. Regulatory clarity: transparent guidelines in major markets continue to draw fresh institutional capital. Network health: On-chain metrics such as rising active addresses and declining exchange inflows reinforce supply scarcity narratives. Chart Structure & Technical Evolution Declining volatility and volume contraction characterized the consolidation phase. Dynamic Resistance Breaks R1 (~$89.3K) & R2 (~$96.7K) (grey/green labels) had capped rallies in mid-April and late-April. The decisive May 8 candle surged through both, converting them into short-term support pivots. Current Momentum A long green daily bar with above-average volume implies genuine buying demand (not a thin-market spike). Price now trades above $100K, a major psychological and technical threshold. Key Levels & Zones LevelTypeSignificance $108KStatic SupplyPrior swing high; first major profit‐taking zone $102.7KRecent PeakNear‐term resistance; tag of psychological $100K $96.7KDynamic R2 → SupportIdeal retest area for dip buyers $89.3KDynamic R1 → SupportSecondary support if $96.7K fails $76K–$78KApril Range SupportInvalidation zone for bullish thesis Bullish vs. Bearish Scenarios Bullish Path Retest & Hold: A pullback into $96.7K–$100K on lighter volume that finds support would validate the breakout. Accelerate Toward $108K: A sustained move above $102.7K with daily closes above $104K clears the way to challenge the $108K supply zone and beyond. Bearish Risk Rejection at $102.7K: Failure to close convincingly above peak time resistance could trigger profit-taking and a swift drop to $96.7K. Breakdown Below $89.3K: A daily close back under the first support zone would re-trap bullish participants, risking a deeper pullback into the April range near $76K–$78K. Is $108K or $115K Next? No one knows Follow the momentum and Trend
SpecuVisionary
MOODENG - Prolonged Base to Breakout Attempt

MOODENG’s chart shows textbook accumulation after a washout, punctuated by a convincing breakout through key dynamic resistances. The critical test now is whether $0.058–$0.063 will hold as support on the next pullback. If so, look for a run toward psychological $0.10; if not, this may be a false start requiring reevaluation near the base. Let price action and volume be your guide—manage stops and size positions to respect these key pivot zones.
SpecuVisionary
SUI/USDT: From Base Building to Breakout

SUI’s daily chart embodies textbook base‐and‐breakout dynamics. Having bottomed near $1.91, reclaimed key demand at $2.28, and smashed through successive dynamic resistances, the chart now projects a clear path toward prior supply at $4.60 and beyond. That said, every breakout merits healthy skepticism: a retest of the $3.35–3.60 zone—and its ability to hold—will be the acid test of true strength. Next Steps for the Trader/Investor: monitor volume and price action in the coming sessions, be ready to buy on a clean retest, and manage risk tightly below invalidation levels. If SUI can sustain above $4.00 and flip former resistance into support, we may be witnessing the dawn of its next up-cycle.
SpecuVisionary
XRP (RIPPLE) TO $4

XRP Continues to Outperform: Higher Highs and Double Buy Signal Today, we highlight XRP's promising technical setup that signals a bullish continuation for the cryptocurrency. Key Observations from the Chart Bullish Breakout from Consolidation XRP has decisively broken out of a symmetrical triangle pattern, which often precedes significant price movements. This breakout suggests a shift in market sentiment as bulls take control. Double Buy Signal As highlighted on the chart, XRP recently triggered a double buy signal—an indication of strong bullish momentum. Such signals are typically associated with increased buying activity and sustained upward trends. Higher Highs in Progress The price action shows XRP printing higher highs, reinforcing the bullish outlook. A series of higher highs is a classic indicator of a strong uptrend, reflecting buyers’ dominance. Key Levels to Watch Support Zone: The $2.00–$2.50 range provides a robust support area, as shown by the dark shaded region. This range aligns with previous price consolidation and could act as a safety net for bullish momentum. Resistance Targets: First target: $3.93 Second target: $4.31 These levels are significant milestones that could test XRP's upward trajectory. Strategic Implications for Traders For short-term traders, the breakout and buy signal provide an excellent opportunity to capitalize on XRP's upward momentum. Scaling out of positions at resistance levels while monitoring volume and momentum could maximize gains. For long-term investors, XRP’s ability to maintain higher lows and its positioning above key support zones indicate the potential for sustained growth. Market Sentiment and Future Outlook The chart reflects growing optimism around XRP, possibly tied to favorable macro developments or broader market recovery. As XRP establishes itself above key levels, it is crucial to watch for confirmation of the breakout with increased volume and sustained momentum.
Disclaimer
Any content and materials included in Sahmeto's website and official communication channels are a compilation of personal opinions and analyses and are not binding. They do not constitute any recommendation for buying, selling, entering or exiting the stock market and cryptocurrency market. Also, all news and analyses included in the website and channels are merely republished information from official and unofficial domestic and foreign sources, and it is obvious that users of the said content are responsible for following up and ensuring the authenticity and accuracy of the materials. Therefore, while disclaiming responsibility, it is declared that the responsibility for any decision-making, action, and potential profit and loss in the capital market and cryptocurrency market lies with the trader.