
V-TOL
@t_V-TOL

What symbols does the trader recommend buying?
Purchase History
پیام های تریدر
Filter
استارکنت (STRK): آیا زمان ورود به این فرصت بزرگ لایه 2 فرا رسیده است؟
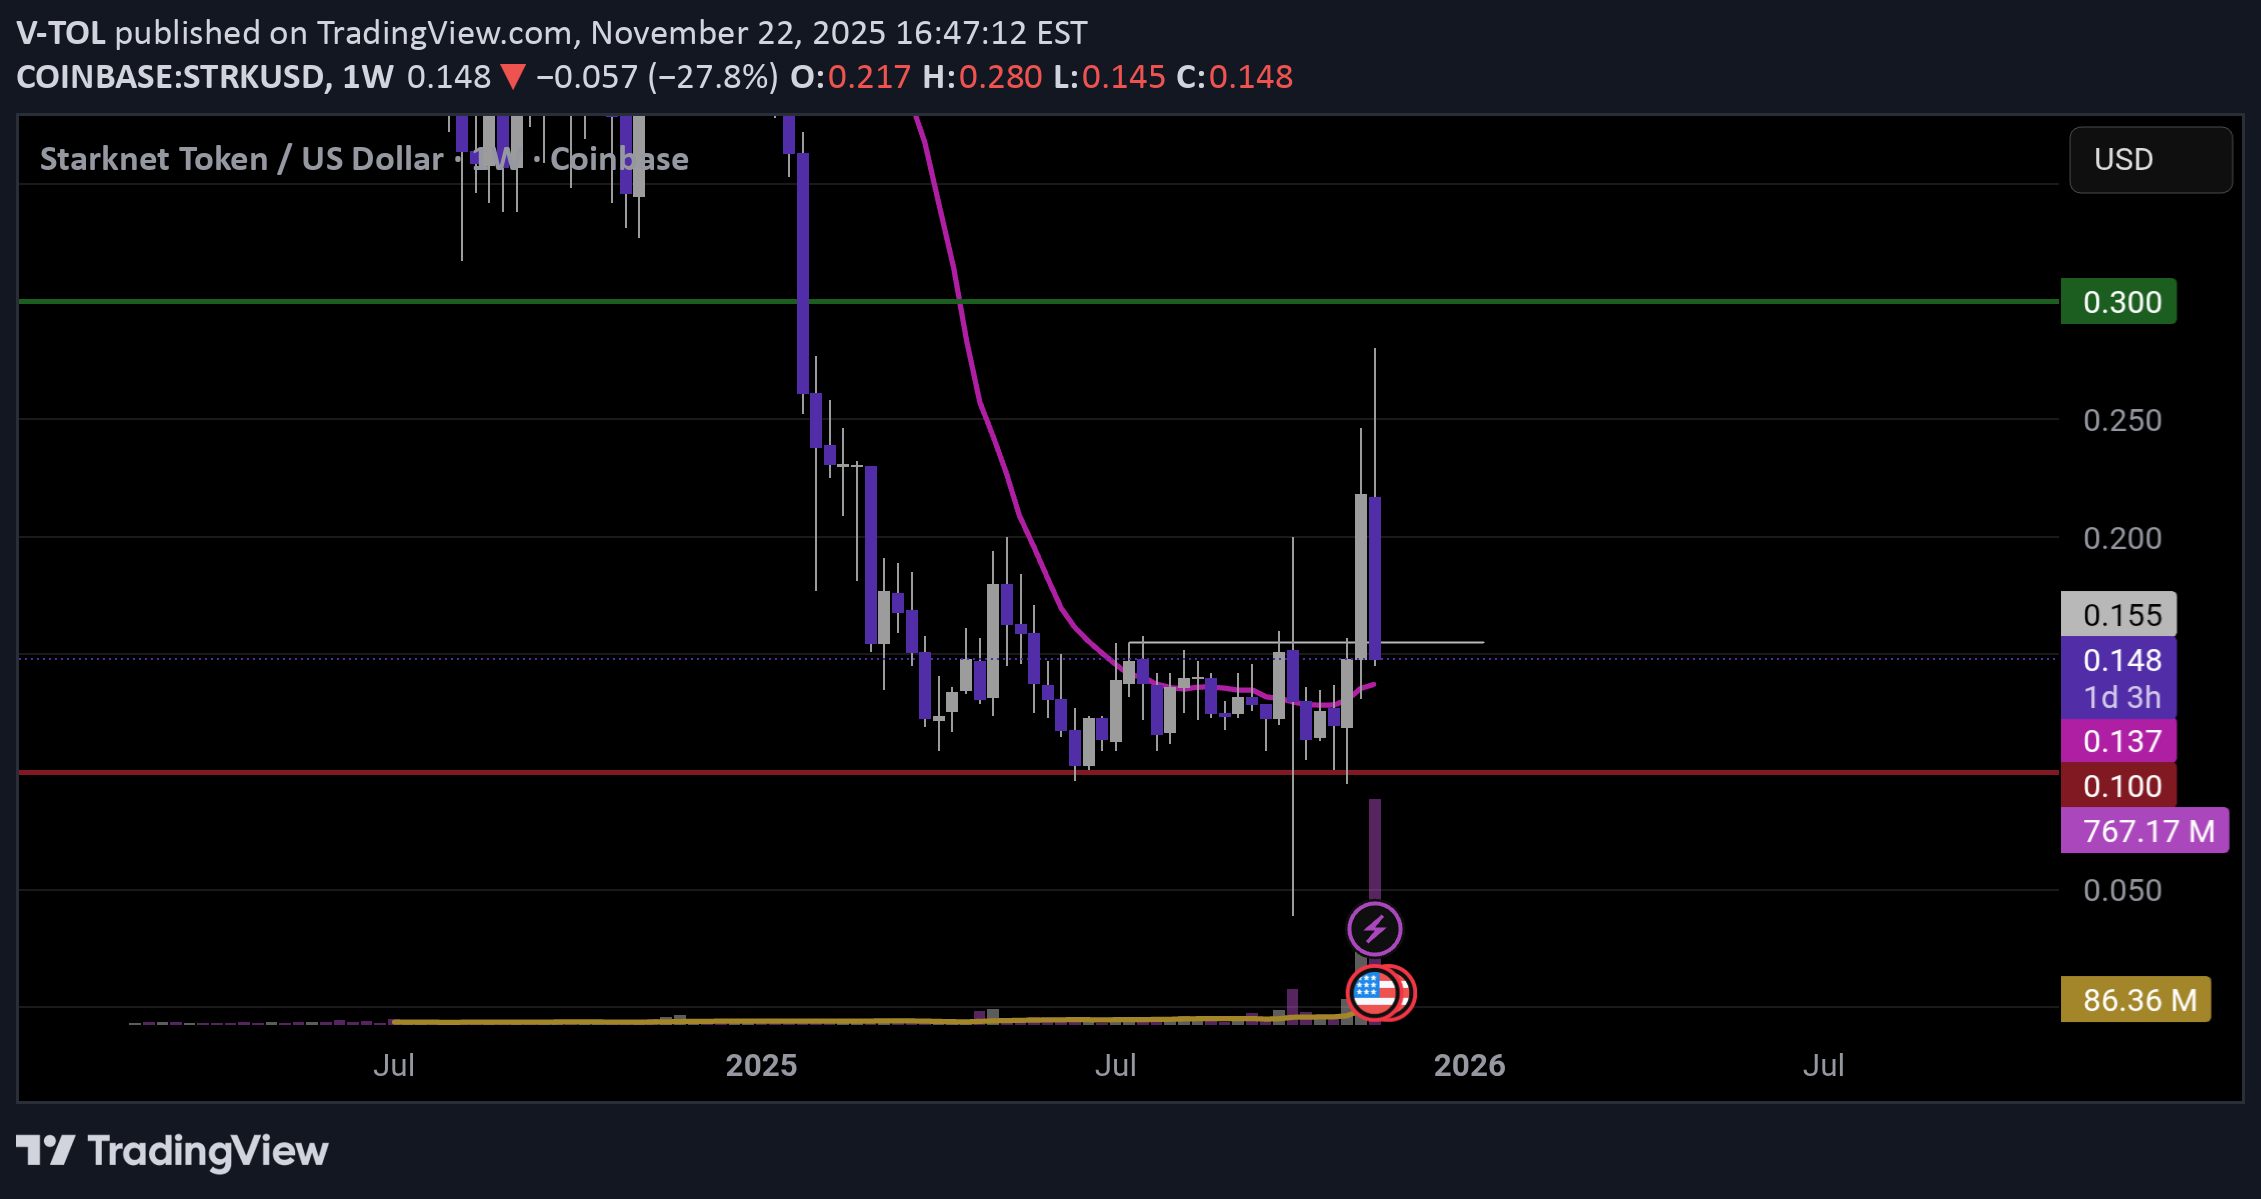
Starknet (STRK) is the native token of a Layer 2 solution on Ethereum based on zk-rollups, designed to scale the network while maintaining security and decentralization. The project aims to significantly increase speed and reduce transaction costs, making it one of the most interesting ecosystems in the L2 space. On the weekly chart, STRK seems to have completed its initial strong distribution phase and is now building a base between $0.11 and $0.15. The increase in volume suggests, in my opinion, a possible trend change. If the price manages to stabilize above $0.15, I consider a move toward $0.30 to be realistic. A key stop level for this setup is $0.10.
پایان رالی شاخص S&P 500؟ مراقب "خط زرد" باشید!
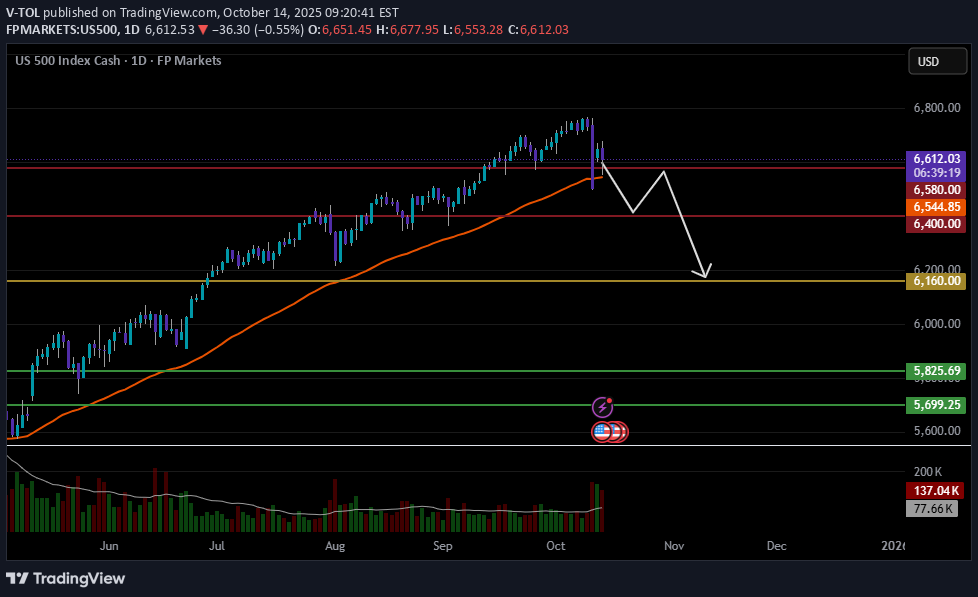
The S&P 500 rally looks exhausted. Over the past week, momentum has clearly faded, lower highs, weaker daily closes, and stronger selling pressure on each bounce. Technically, the market shows early signs of a shift from bullish to corrective or bearish. The Yellow Level acts as a divider between a mildly bullish market and the start of a medium-term bearish phase. Above the Yellow Level: price may hold short-term strength or consolidation. Below the Yellow Level: structure breaks down and downside potential expands. A daily close below the Yellow Level would confirm the beginning of a broader bearish move. In my view i suggest all the Trader/Investor which they are reading this to stay AT LEAST 80/90% IN CASH. something is about to happen... stay safe!
US500 Rally end?
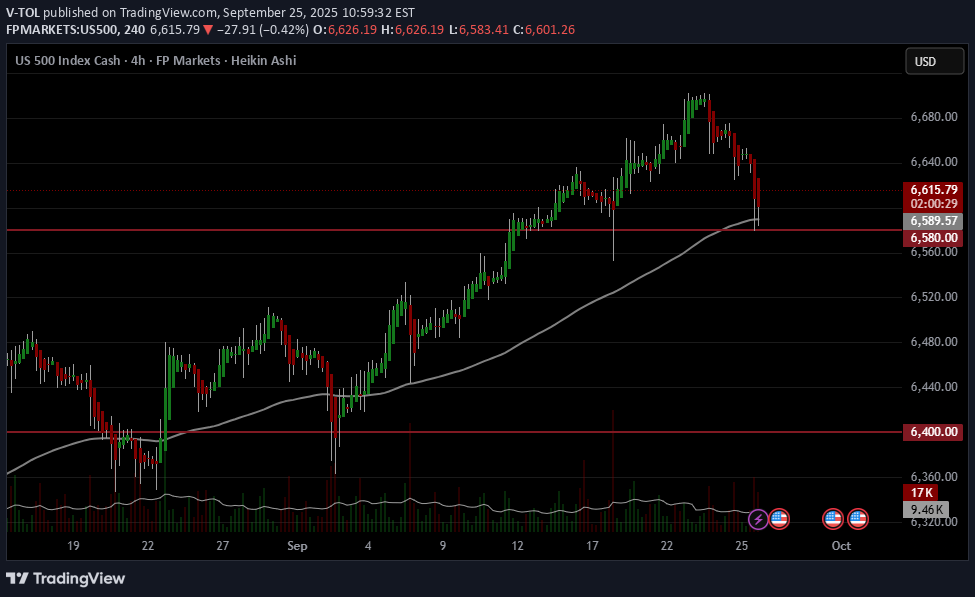
The S&P 500 is at a key moment right now, testing the 6580 support area after a sharp pullback from recent highs. In my view, if this level breaks decisively with strong selling pressure, the market could head toward the 6400 zone, which has acted as an important support area in the past. As long as 6580 holds, a bounce is still possible, but for now the risk seems tilted to the downside if we see a clear breakdown. NOT FINANCIAL ADVICE. Comment below with the ticker you’d like me to analyze next! And don’t forget to leave a boost if you’d like to see more trading ideas like this :)
Bubble Burst?
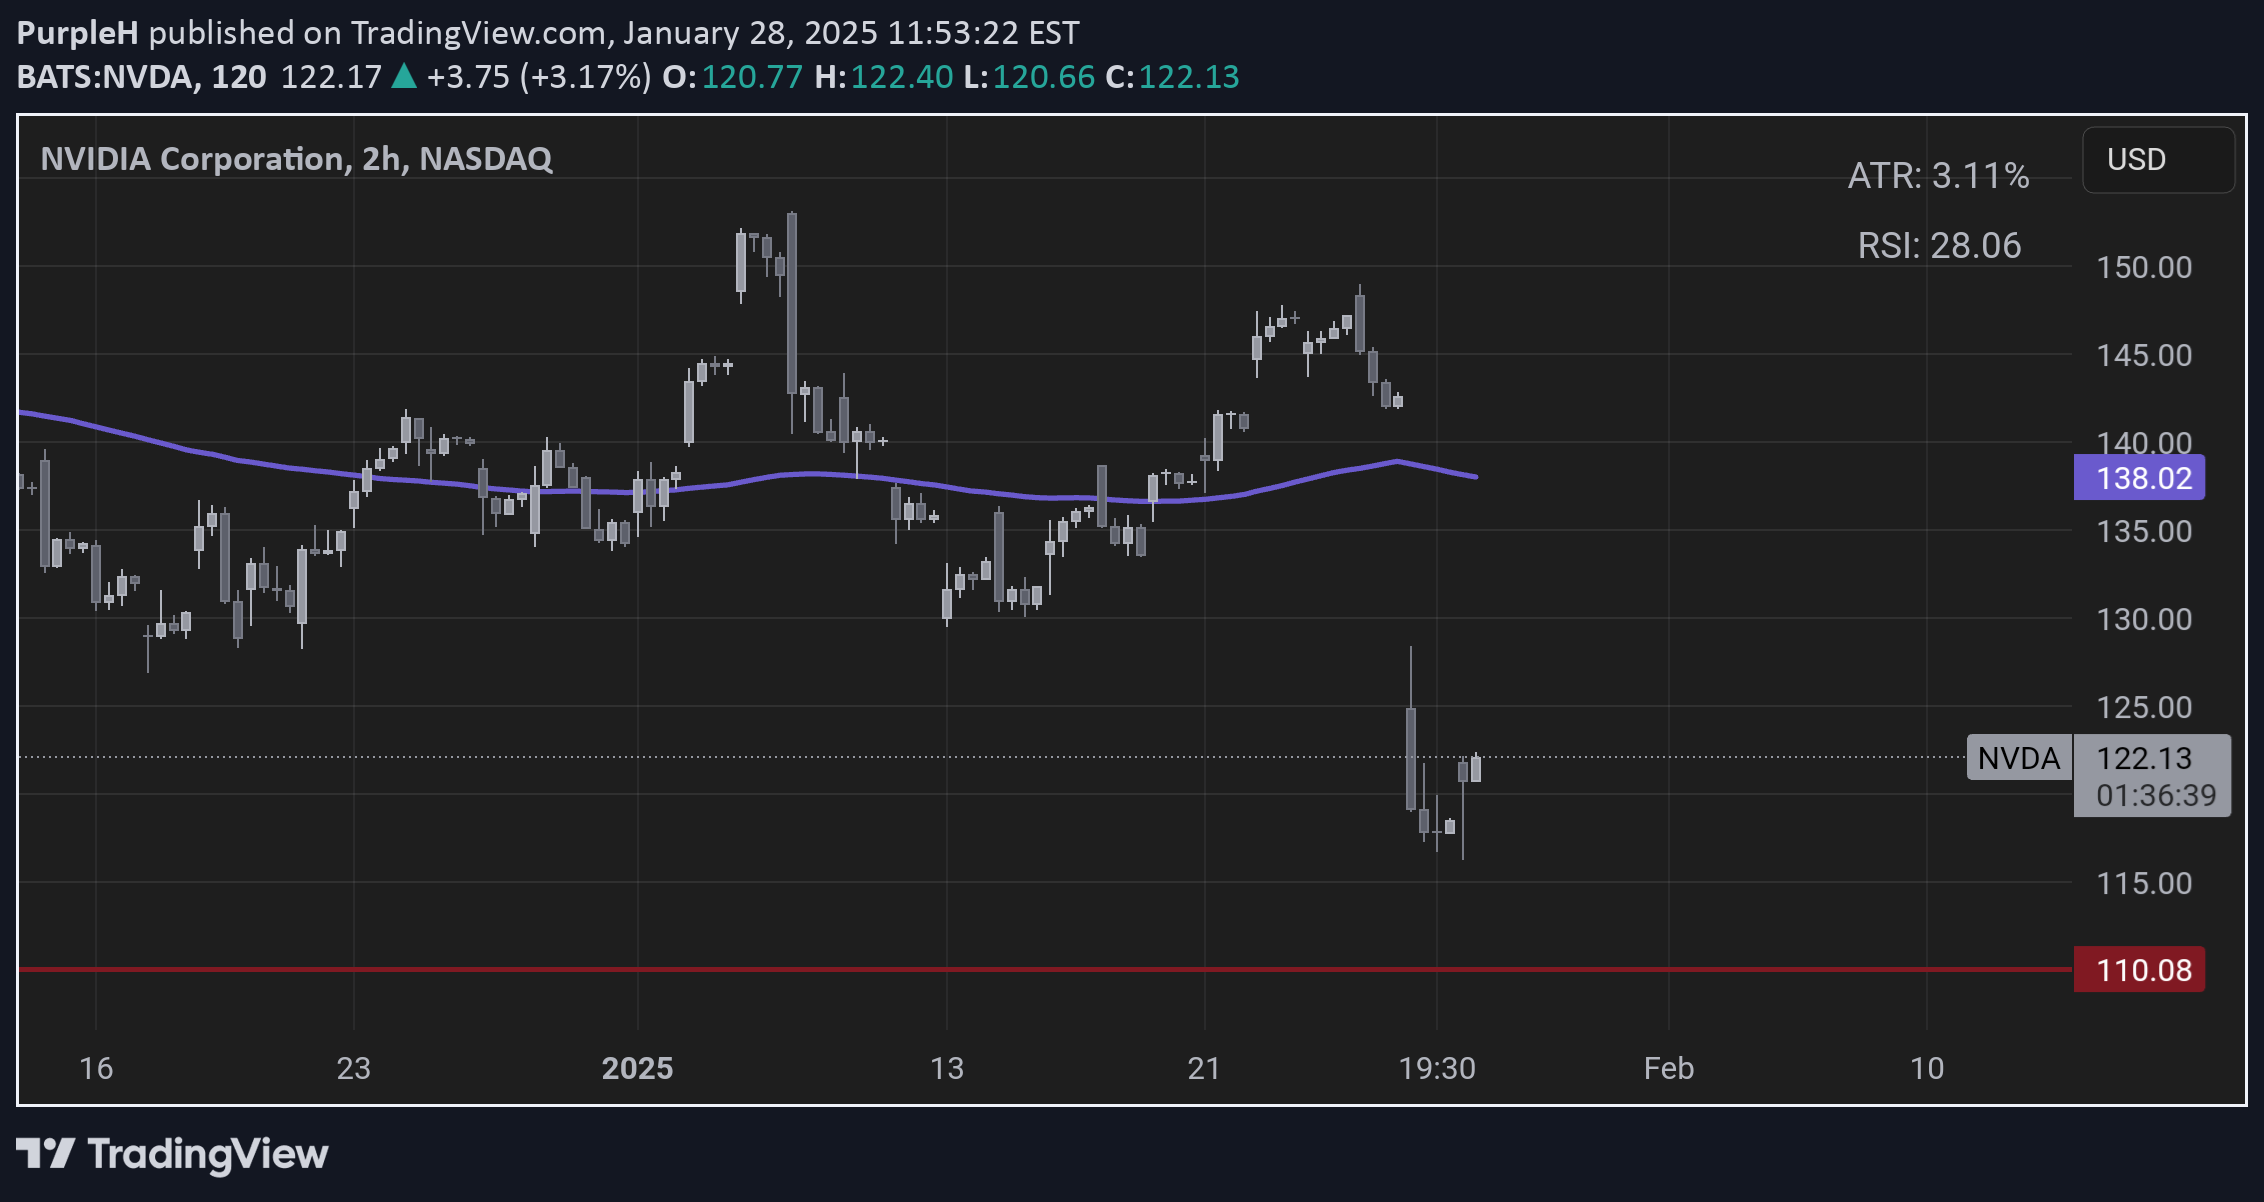
Has the NVDA bubble burst? At least from a technical standpoint, the answer appears to be yes. Further declines are anticipated, at least over the next two weeks. First target at 110$
Disclaimer
Any content and materials included in Sahmeto's website and official communication channels are a compilation of personal opinions and analyses and are not binding. They do not constitute any recommendation for buying, selling, entering or exiting the stock market and cryptocurrency market. Also, all news and analyses included in the website and channels are merely republished information from official and unofficial domestic and foreign sources, and it is obvious that users of the said content are responsible for following up and ensuring the authenticity and accuracy of the materials. Therefore, while disclaiming responsibility, it is declared that the responsibility for any decision-making, action, and potential profit and loss in the capital market and cryptocurrency market lies with the trader.