
SHIB
SHIBA INU
| تریدر | نوع سیگنال | حد سود/ضرر | زمان انتشار | مشاهده پیام |
|---|---|---|---|---|
 pullbacksignalRank: 30194 | خرید | حد سود: تعیین نشده حد ضرر: تعیین نشده | 1/6/2026 | |
 MMBTtraderRank: 31478 | خرید | حد سود: تعیین نشده حد ضرر: تعیین نشده | 1/6/2026 | |
 Alpha-GoldFXRank: 32441 | خرید | حد سود: تعیین نشده حد ضرر: تعیین نشده | 1/4/2026 | |
 MiladJRank: 31348 | خرید | حد سود: تعیین نشده حد ضرر: تعیین نشده | 12/5/2025 |
معرفی شیبا اینو
Price Chart of SHIBA INU
سود 3 Months :
خلاصه سیگنالهای SHIBA INU
سیگنالهای SHIBA INU
Filter
Sort messages by
Trader Type
Time Frame

Jan 8 SHIBUSD Monthly Chart

Overall bias is bullish because of the monthly high timeframe. For educational purposes only. Use proper risk management when trading
pullbacksignal
SHIBUSDT için İşlem Sinyali

İşlem Kurulumu: SHIBUSDT SHIBAINU'da (1 saatlik) bir işlem sinyali görülüyor. Yatırımcılar ŞİMDİ Alış İşlemlerini açabilirler. ⬆️Şimdi Al veya 0.00000915'te Al ⭕️SL @ 0.0000087 🔵TP1 @ 0.00001025 🔵TP2 @ 0.00001081 🔵TP3 @ 0.0000116 Bu sinyaller neye dayanıyor? Klasik Teknik Analiz Fiyat Hareketi Mum Grafikleri Fibonacci RSI, Hareketli Ortalama, Ichimoku, Bollinger Bantları Risk Uyarısı Forex, CFD'ler, Kripto Paralar, Vadeli İşlemler ve Hisse senetleri kayıp riski içerir. Bu tür işlemlerin sizin için uygun olup olmadığını lütfen dikkatlice değerlendirin. Geçmiş performans, gelecekteki sonuçların göstergesi değildir. Fikirlerimizi beğendiyseniz, lütfen beğenileriniz 👍 ve yorumlarınızla bize destek olun.
pullbacksignal
Trading Signal For SHIBUSDT

Trading Setup: A Trading Signal is seen in the SHIBUSDT SHIBAINU (1h) Traders can open their Buy Trades NOW ⬆️Buy now or Buy on 0.00000915 ⭕️SL @ 0.0000087 🔵TP1 @ 0.00001025 🔵TP2 @ 0.00001081 🔵TP3 @ 0.0000116 What are these signals based on? Classical Technical Analysis Price Action Candlesticks Fibonacci RSI, Moving Average , Ichimoku , Bollinger Bands Risk Warning Trading Forex, CFDs, Crypto, Futures, and Stocks involve a risk of loss. Please consider carefully if such trading is appropriate for you. Past performance is not indicative of future results. If you liked our ideas, please support us with your likes 👍 and comments .
MMBTtrader
SHIB the pump started from weekly support --> first target soon

As previously highlighted, the critical weekly support zone has demonstrated validated strength. Price action has indeed respected this level, establishing a firm base and initiating a bullish momentum shift over recent sessions.
Our active long signal is now approaching its first take-profit (TP) target. Given the confirmed strength of the rebound from the major support, we anticipate this initial target will be achieved.
Looking ahead, the potential for extended gains remains contingent on volume confirmation. A significant and sustained increase in buying volume would indicate stronger market participation and conviction, likely fueling a more robust and prolonged uptrend toward higher-timeframe resistance levels.
DISCLAIMER: ((trade based on your own decision))
<
StudyGuideTA
Shibu Inu | Daily TA | 15min chart

Lets chart a Meme coin T.A explained - BackSide (BS) FrontSide (FS) Inverse BS (Inv.BS) Inverse FS (Inv.FS) BS & FS levels are expected support when dashed lines, tested when dotted and resistance when solid lines. The inverse is true for the Inv. BS Inv. FS levels, they are resistance as dashed lines, tested as dotted and support as solid lines. Monthly timeframe is color pink weekly grey daily is red 4hr is orange 1hr is yellow 15min is blue 5min is green if they are shown. strength favors the higher timeframe. 2x dotted levels are origin levels where trends have or will originate. When trends break, price will target the origin of the trend. its math, when the trend breaks, the vertex breaks too so the higher timeframe level/trend that breaks, the more volatility there could be as strength in the orders flow in to fuel the move.
Alpha-GoldFX
شیبا اینو (SHIB) در آستانه انفجار قیمتی؟ راز الگوی "گُوِه نزولی" و سود ۷۰ درصدی!

SHIBUSDT is forming a clear falling wedge pattern, a classic bullish reversal signal that often indicates an upcoming breakout. The price has been consolidating within a narrowing range, suggesting that selling pressure is weakening while buyers are beginning to regain control. With consistent volume confirming accumulation at lower levels, the setup hints at a potential bullish breakout soon. The projected move could lead to an impressive gain of around 60% to 70% once the price breaks above the wedge resistance. This falling wedge pattern is typically seen at the end of downtrends or corrective phases, and it represents a potential shift in market sentiment from bearish to bullish. Traders closely watching SHIBUSDT are noting the strengthening momentum as it nears a breakout zone. The good trading volume adds confidence to this pattern, showing that market participants are positioning early in anticipation of a reversal. Investors’ growing interest in SHIBUSDT reflects rising confidence in the project’s long-term fundamentals and current technical strength. If the breakout confirms with sustained volume, this could mark the start of a fresh bullish leg. Traders might find this a valuable setup for medium-term gains, especially as the wedge pattern completes and buying momentum accelerates. ✅ Show your support by hitting the like button and ✅ Leaving a comment below! (What is your opinion about this Coin?) Your feedback and engagement keep me inspired to share more insightful market analysis with you!

SaykoCrypto
SHİBA/USDT Haftalık Analiz Paralel Kanal Gartley Hedefleri

Parallel channels work well in Shiba weekly chart. Channel alt middle and upper bands target points are profit taking zones. There is a Gartley formation, I have stated its targets on the chart. The chart is for tracking purposes only. It does not contain investment advice!! Good luck friends

The-Thief
SHIBUSD Bullish Structure Aligning With Market Flow

🚀 SHIBA INU (SHIB/USD) - Swing Trade Profit Pathway Setup 🎯 Current Market Data ✅ Real-Time Price: $0.00000827 USD (+14.85% 7-day momentum) Market Cap: $4.87B (Ranking #25) 24h Volume: $133.6M USD Status: Bullish momentum breakout zone 📈 🎯 TRADE SETUP OVERVIEW Asset: SHIBA INU vs U.S DOLLAR (SHIB/USD) Strategy: Swing Trade - Simple Moving Average Breakout Trade Type: BULLISH CONTINUATION 🔝 Timeframe: Multi-day swing setup 📍 ENTRY STRATEGY Entry Approach: Flexible zone entry ✅ ANY PRICE LEVEL ENTRY - Multiple entry opportunities on breakout confirmation Primary Entry: Above Hull MA (HMA) breakout zone Secondary Entry: Dips into support after initial breakout Optimal Entry: Confirmed 4H HMA golden cross + volume surge Entry Signal Confirmation: Hull Moving Average (HMA) slope turns bullish ✓ Volume increases above 20-day average ✓ Price breaks & holds above key resistance levels ✓ ⛔ STOP LOSS (SL) - RISK MANAGEMENT SL Placement: $0.00000750 Placement Rule: AFTER Hull MA breakout confirmation Reasoning: Thief SL = Security line against false breakouts ⚠️ Important: Your stop loss placement is YOUR OWN CHOICE & RESPONSIBILITY. This is not financial advice. Adjust SL based on your personal risk tolerance and trading account size. Many traders adjust SL to 2-3% below entry after confirmation. 🎁 PROFIT TARGET (TP) - EXIT STRATEGY Primary Target: $0.00000900 Secondary Target: $0.00001019 (Technical golden cross) Tertiary Target: $0.00001280 (6-month upside potential) Why These Levels? Hull MA = POLICE BARRICADE - Acts as dynamic support/resistance barrier $0.00000900 zone = Oversold trap recovery + strong correlation support Previous resistance = Future support principle applies here Risk/Reward Ratio = 1:2+ (Excellent for swing traders) ⚠️ Important: TP selection is YOUR OWN CHOICE & RESPONSIBILITY. Lock in profits at levels that align with YOUR trading strategy. Consider taking partial profits (25-50%) at primary target, then trailing SL on remainder. 📊 TECHNICAL ANALYSIS FACTORS Bullish Indicators ✅ RSI Momentum: Currently 57.05 (Neutral-Bullish zone) Moving Averages: HMA slope turning positive Volume Profile: Exchange inflows declining = Accumulation phase 7-Day Performance: +14.20% outperforming crypto market (+4.50%) 24-Hour Action: Strong buying pressure above support levels Whale Activity: 167.99B SHIB ($1.18M) exited exchanges on Dec 31 = Institutional accumulation signal Risk Factors ⚠️ Large circulating supply (589.24 trillion SHIB) = Price scaling challenges Daily burn rate slowing = Deflationary pressure reduced September Shibarium bridge exploit = Some ecosystem trust issues Anonymous development team = Leadership transparency concerns 🔗 RELATED PAIRS TO WATCH (Correlation Analysis) Positive Correlations - Follow SHIB Moves: 1. DOGE/USD (Dogecoin) 🐕 Correlation Index: +0.85 Reason: Meme coin ecosystem + retail sentiment driver Action: If DOGE breaks $0.20, expect SHIB breakout confirmation Watch Level: $0.20-$0.22 resistance zone 2. ETH/USD (Ethereum) ⛓️ Correlation Index: +0.70 Reason: SHIB runs on Ethereum layer-2 (Shibarium) - Direct network dependency Action: ETH strength = Shibarium efficiency = SHIB upside Watch Level: ETH above $3,500 = Bullish for SHIB ecosystem Current ETH Price: $3,123.74 (+4.06% momentum) 3. BTC/USD (Bitcoin Dominance) 👑 Correlation Index: +0.69 Reason: Alt-season driver - When BTC rallies, alts follow Action: BTC above $90k = Alt coin money rotation confirmed Watch Level: Bitcoin dominance below 55% = Altcoin strength signal Current BTC Price: $89,904.63 (+1.45%) 4. SOL/USD (Solana) 🚀 Correlation Index: +0.65 Reason: Layer-2 network competition + ecosystem adoption race Action: SOL weakness = Potential SHIB strength divergence Watch Level: SOL support at $130-$135 zone Current SOL Price: $132.51 (+4.57%) 5. SHIBARIUM (BONE/USD) 🦴 Correlation Index: +0.95 (Highest correlation - Direct ecosystem token) Reason: Governance token + network utility token for Layer-2 Action: BONE strength = Shibarium adoption = SHIB ecosystem health Watch Level: BONE above $0.85 = Strong ecosystem signal Action: Track Shibarium RPC migration completion (Q1 2026) 6. Total Cryptocurrency Market Cap Correlation Index: +0.63 Reason: Risk-on/risk-off sentiment across all alts Action: Total crypto market cap above $2.5T = Favorable SHIB trading Watch Level: Watch for macro capitulation/recovery phases 📰 FUNDAMENTAL & ECONOMIC FACTORS (Real-Time Data - Jan 4, 2026) BULLISH CATALYSTS FOR 2026: 🔧 Shibarium L2 Technical Upgrades (Upcoming Q1-Q2 2026) Zama FHE Privacy Integration: Q2 2026 launch confirmed Brings on-chain privacy & confidential smart contracts Makes Shibarium competitive with privacy-focused chains Estimated Impact: +15-25% ecosystem value growth if executed RPC Network Migration: Early 2026 (post-security audit) Decentralizes network (removes single point of failure) Increases trust post-September bridge exploit Improves transaction reliability & developer confidence AI Technical Paper Release: Q1 2026 Partnership announcements with NVIDIA & Alibaba Cloud Positions SHIB in AI + blockchain convergence trend Enterprise adoption narrative strengthens Shibarium Layer-3 Rollout: Mid-2026 Faster transactions, multi-currency gas fees Improves UX for retail traders & developers Adoption potential + volume increase expected 💰 Market Sentiment Shifts (Early 2026 Data) Meme Season Starting: SHIB +17.95% since Jan 1, 2026 First green weekly candle in 2026 Retail FOMO entering the space = Volatility opportunity Momentum traders accumulating positions Whale Accumulation Signals: Exchange outflows: 167.99B SHIB ($1.18M) on Dec 31 Institutional buyers repositioning Futures open interest +9.39% = Leveraged long positioning Derivatives Market Heating: Open interest: +20% surge in early 2026 Indicates trader positioning for breakout Volume concentration = Price move likely ⚖️ Regulatory & Macroeconomic Factors: Positive Developments: CLARITY Act Potential: Crypto regulatory framework clarity could unlock institutional capital Coinbase Regulated SHIB Futures: Launched - Legitimacy + retail access Crypto Market Recovery: Bitcoin +1.45%, Ethereum +4.06% - Broad-based strength Lower Fed Rate Expectations: 17.7% odds of January rate cut = Liquidity increase favors risk-on assets like SHIB Risk Factors to Monitor: SEC Scrutiny: 60% of altcoins under review globally for potential restrictions September Shibarium Exploit: K9 Finance issued Jan 6, 2026 deadline for full restitution If not resolved: May trigger ecosystem departures If resolved: Major bullish catalyst + confidence restoration Anonymous Leadership: Shytoshi Kusama silent since early December Communication concerns post-exploit 2026 focus on "repair, focus & building to last" (per dev Kaal Dhairya) Less hype marketing = More serious infrastructure focus (Could be Bullish long-term) Supply Inflation Risk: 589.24 trillion tokens in circulation Daily burns slowed to ~3.2M SHIB (from billions earlier) Price scaling challenges without massive adoption 🎯 TRADE PROBABILITY FACTORS Bullish Case: 65% Probability ✅ Momentum breakout confirmed (7-day +14.20%) ✅ Whale accumulation signals strong ✅ Multiple 2026 technical upgrades lined up ✅ Broader crypto market recovery supporting altcoins ✅ Meme season retail FOMO entering Bearish Case: 35% Probability ⚠️ Large circulating supply limits upside scaling ⚠️ Regulatory headwinds could cause delisting risk ⚠️ Ecosystem restitution deadline (Jan 6) = Event risk ⚠️ Leadership transparency issues post-exploit ⚠️ Failed to rally with Bitcoin's 2025 surge = Relative weakness 💡 TRADER NOTES & STRATEGY TIPS For Swing Traders (3-14 days holding): Enter zones: First breakout above HMA + confirmed volume Scale in: Use 3 equal entries on dips within the trend Take profits: 50% at $0.00000900 (secure gains), 30% at $0.00001019, hold 20% for trend extension Use alerts: Set price alerts at key technical levels to avoid emotional decisions Risk/Reward: Maintain 1:2+ ratio minimum before entering Risk Management Checklist: Position size: Only risk 1-2% of account per trade SL placement: Confirmed after breakout (NOT before) TP scaling: Don't try to catch "the top" - take profits systematically Market context: Check Bitcoin dominance + overall crypto sentiment before entry Stop loss trails: Move SL to breakeven after +50% gain minimum Event Calendar for SHIB Traders (Q1 2026): Jan 6, 2026: K9 Finance ecosystem restitution deadline (Event risk) Q1 2026: Shibarium RPC migration completion expected Q1 2026: AI technical paper release with NVIDIA/Alibaba details Q2 2026: Zama FHE privacy upgrade rollout begins Mid-2026: Shibarium Layer-3 Alpha launch ⚠️ DISCLAIMER & RISK ACKNOWLEDGMENT IMPORTANT - READ CAREFULLY: This analysis is based on technical setups and market data AS OF JANUARY 4, 2026. This is NOT financial or investment advice. SHIB is a highly volatile cryptocurrency with meme-coin origins. 🚨 Risks involved: Cryptocurrency markets operate 24/7 with extreme volatility SHIB's large circulating supply presents scaling challenges Regulatory decisions could impact value substantially Past performance does not guarantee future results You can lose your entire investment 🎬 ACTION CHECKLIST FOR TRADERS Confirm Hull MA breakout on 4-hour timeframe Wait for volume surge above 20-day average Enter on breakout confirmation + hold above HMA Place SL at $0.00000750 (AFTER breakout) Set TP alerts at $0.00000900, $0.00001019, $0.00001280 Monitor Bitcoin dominance & Ethereum strength daily Watch Jan 6 K9 Finance restitution deadline Track Shibarium development milestone announcements Scale out profits (don't be greedy - secure gains!) Maintain proper position sizing & risk management Good luck, traders! May your profits be realistic & your losses minimal. 🚀💰
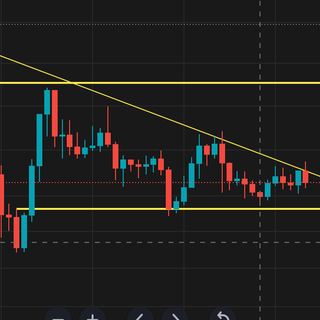
pullbacksignal
SHIBUSDT için İşlem Sinyali
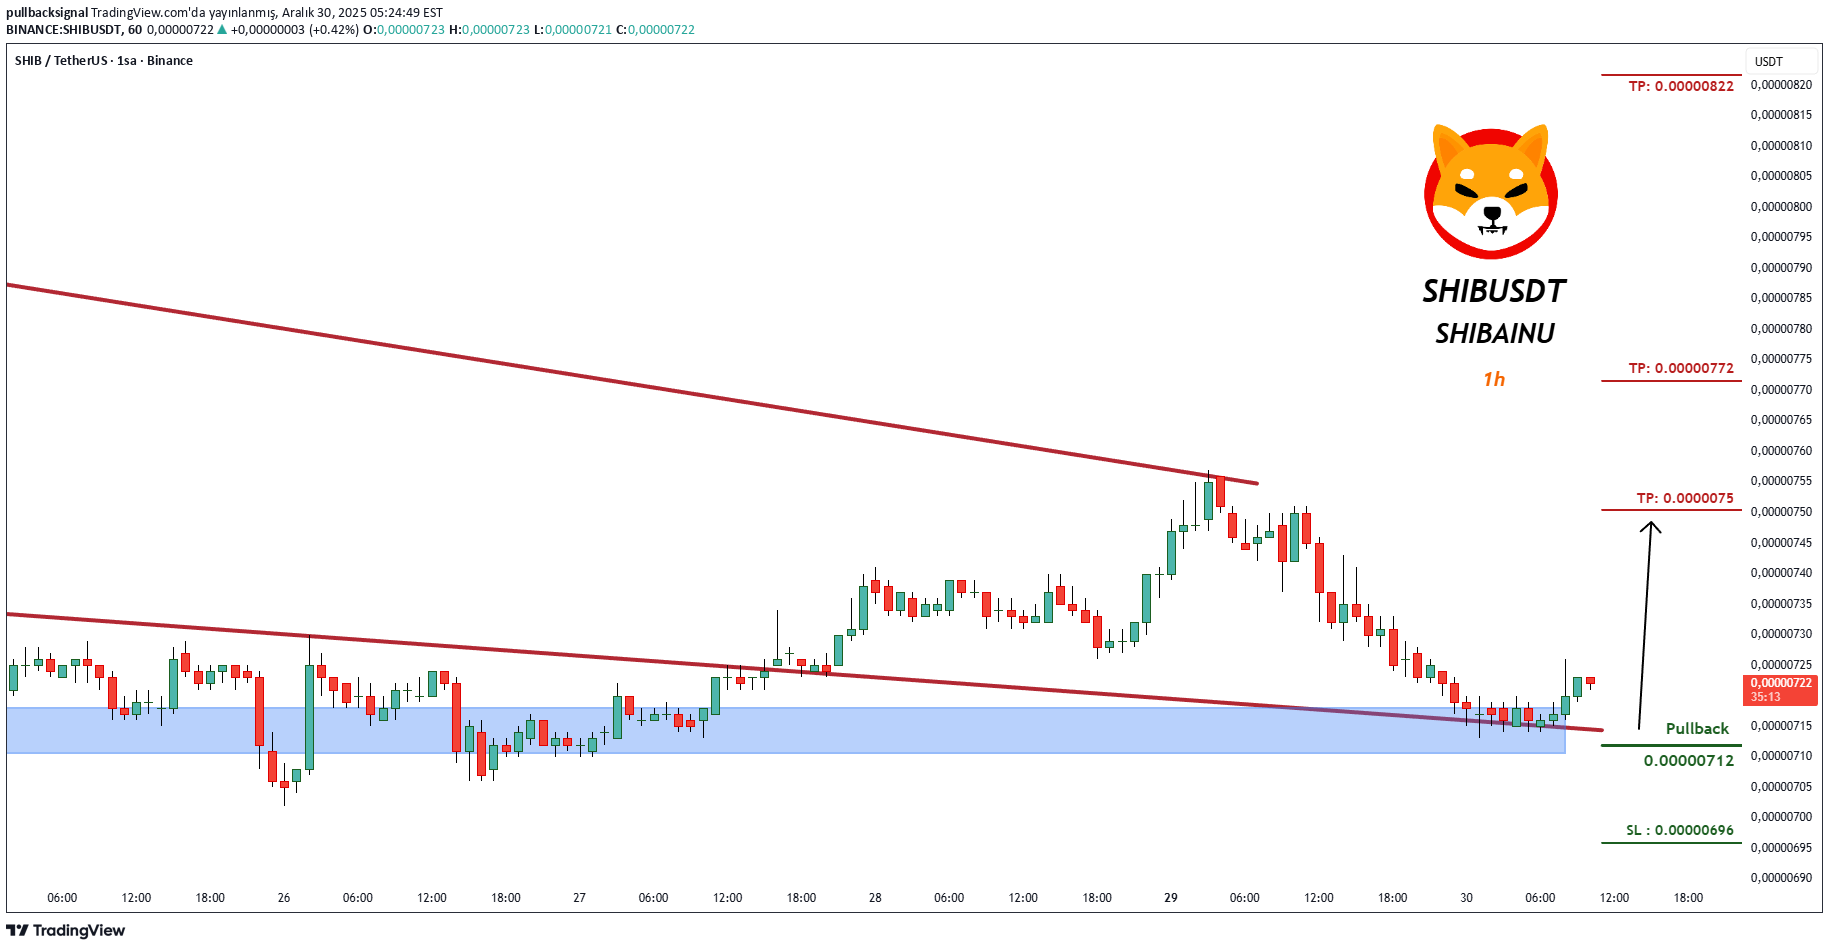
İşlem Kurulumu: SHIBUSDT SHIBAINU'da (1 saatlik) bir işlem sinyali görülüyor. Yatırımcılar ŞİMDİ Alış işlemlerini açabilirler. ⬆️Şimdi Al veya 0.00000712'de Al ⭕️SL @ 0.00000696 🔵TP1 @ 0.0000075 🔵TP2 @ 0.00000772 🔵TP3 @ 0.00000822 Bu sinyaller neye dayanıyor? Klasik Teknik Analiz Fiyat Hareketi Mum Grafikleri Fibonacci RSI, Hareketli Ortalama, Ichimoku, Bollinger Bantları Risk Uyarısı Forex, CFD'ler, Kripto Paralar, Vadeli İşlemler ticareti, Hisse senetleri kayıp riski içerir. Bu tür işlemlerin sizin için uygun olup olmadığını lütfen dikkatlice değerlendirin. Geçmiş performans, gelecekteki sonuçların göstergesi değildir. Fikirlerimizi beğendiyseniz, lütfen beğenileriniz 👍 ve yorumlarınızla bize destek olun.
pullbacksignal
Trading Signal For SHIBUSDT
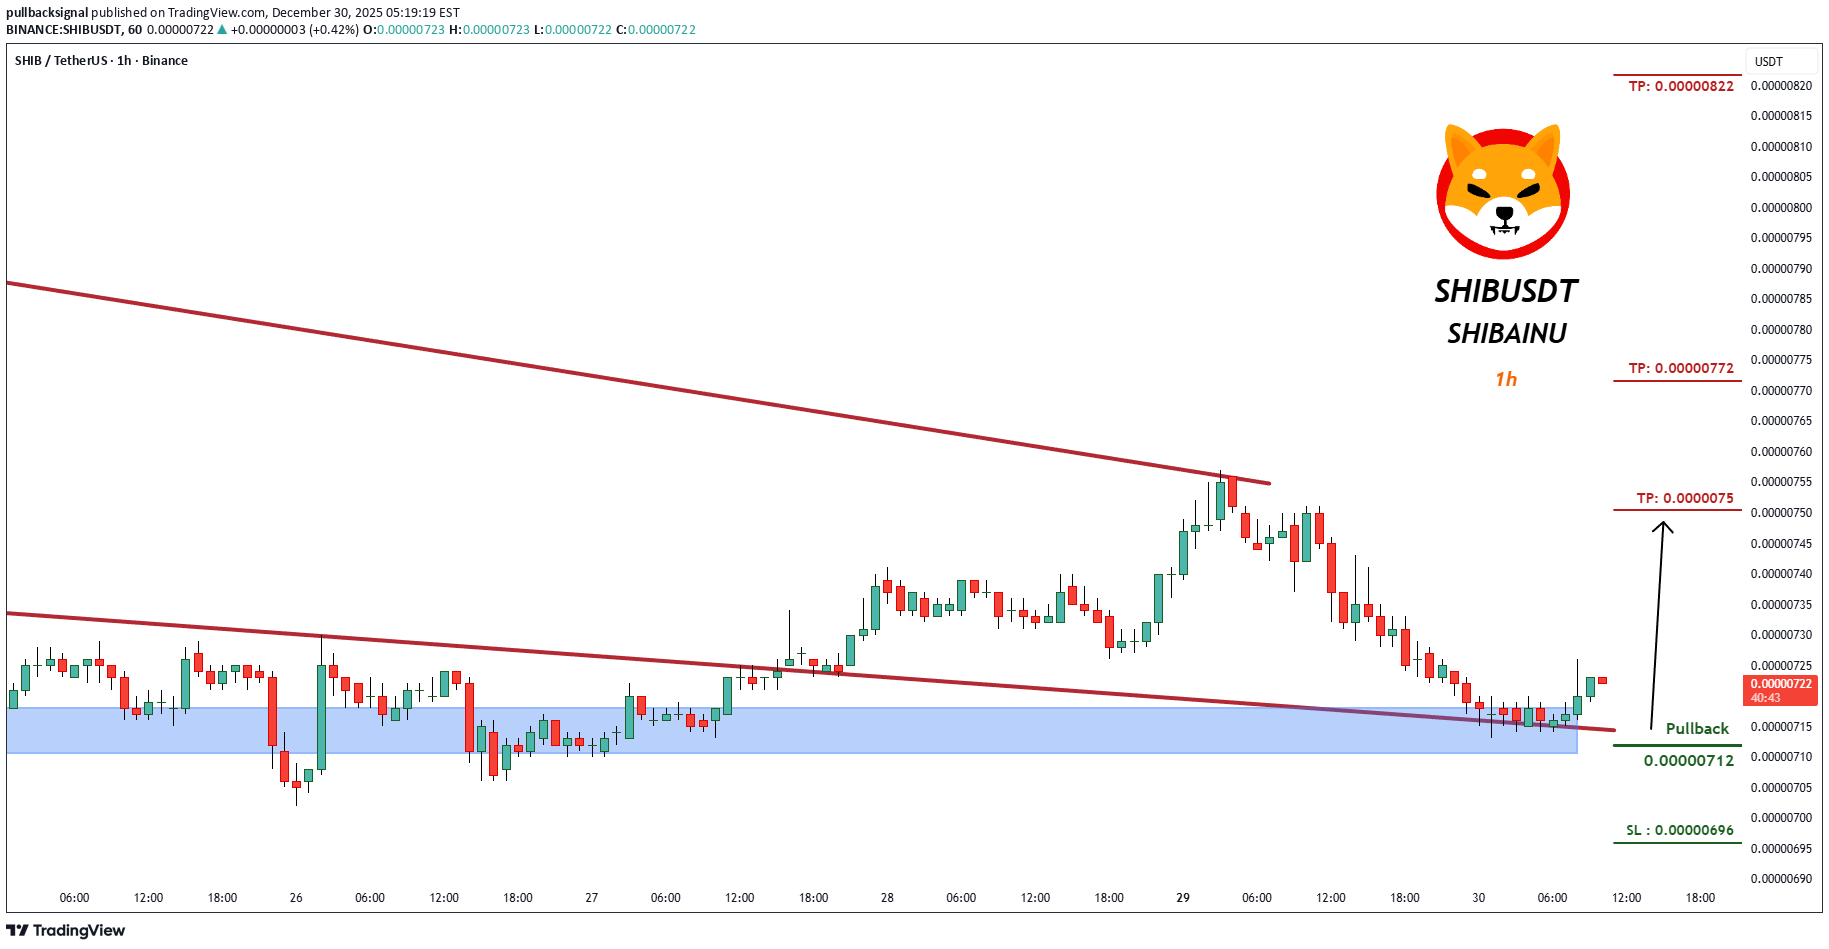
Trading Setup: A Trading Signal is seen in the SHIBUSDT SHIBAINU (1h) Traders can open their Buy Trades NOW ⬆️Buy now or Buy on 0.00000712 ⭕️SL @ 0.00000696 🔵TP1 @ 0.0000075 🔵TP2 @ 0.00000772 🔵TP3 @ 0.00000822 What are these signals based on? Classical Technical Analysis Price Action Candlesticks Fibonacci RSI, Moving Average , Ichimoku , Bollinger Bands Risk Warning Trading Forex, CFDs, Crypto, Futures, and Stocks involve a risk of loss. Please consider carefully if such trading is appropriate for you. Past performance is not indicative of future results. If you liked our ideas, please support us with your likes 👍 and comments .
SHIBA INU چیست؟
معرفی شیبا اینو
قیمت شیبا اینو
آیا شیبا اینو برای سرمایهگذاری مناسب است ؟
Disclaimer
Any content and materials included in Sahmeto's website and official communication channels are a compilation of personal opinions and analyses and are not binding. They do not constitute any recommendation for buying, selling, entering or exiting the stock market and cryptocurrency market. Also, all news and analyses included in the website and channels are merely republished information from official and unofficial domestic and foreign sources, and it is obvious that users of the said content are responsible for following up and ensuring the authenticity and accuracy of the materials. Therefore, while disclaiming responsibility, it is declared that the responsibility for any decision-making, action, and potential profit and loss in the capital market and cryptocurrency market lies with the trader.