StudyGuideTA
@t_StudyGuideTA

What symbols does the trader recommend buying?
Purchase History
پیام های تریدر
Filter
StudyGuideTA
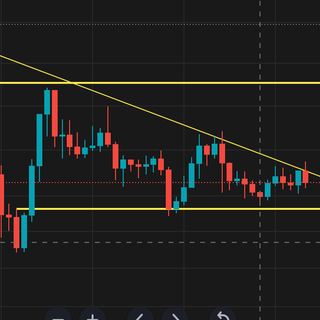
تحلیل تکنیکال SOL: نقشهراه حمایت و مقاومت در تایمفریم 4 ساعته (BS/FS)
T.A explained - BackSide (BS) FrontSide (FS) Inverse BS (Inv.BS) Inverse FS (Inv.FS) BS & FS levels are expected support when dashed lines, tested when dotted and resistance when solid lines. The inverse is true for the Inv. BS Inv. FS levels, they are resistance as dashed lines, tested as dotted and support as solid lines. Monthly timeframe is color pink weekly grey daily is red 4hr is orange 1hr is yellow 15min is blue 5min is green if they are shown. strength favors the higher timeframe. 2x dotted levels are origin levels where trends have or will originate. When trends break, price will target the origin of the trend. its math, when the trend breaks, the vertex breaks too so the higher timeframe level/trend that breaks, the more volatility there could be as strength in the orders flow in to fuel the move.
StudyGuideTA
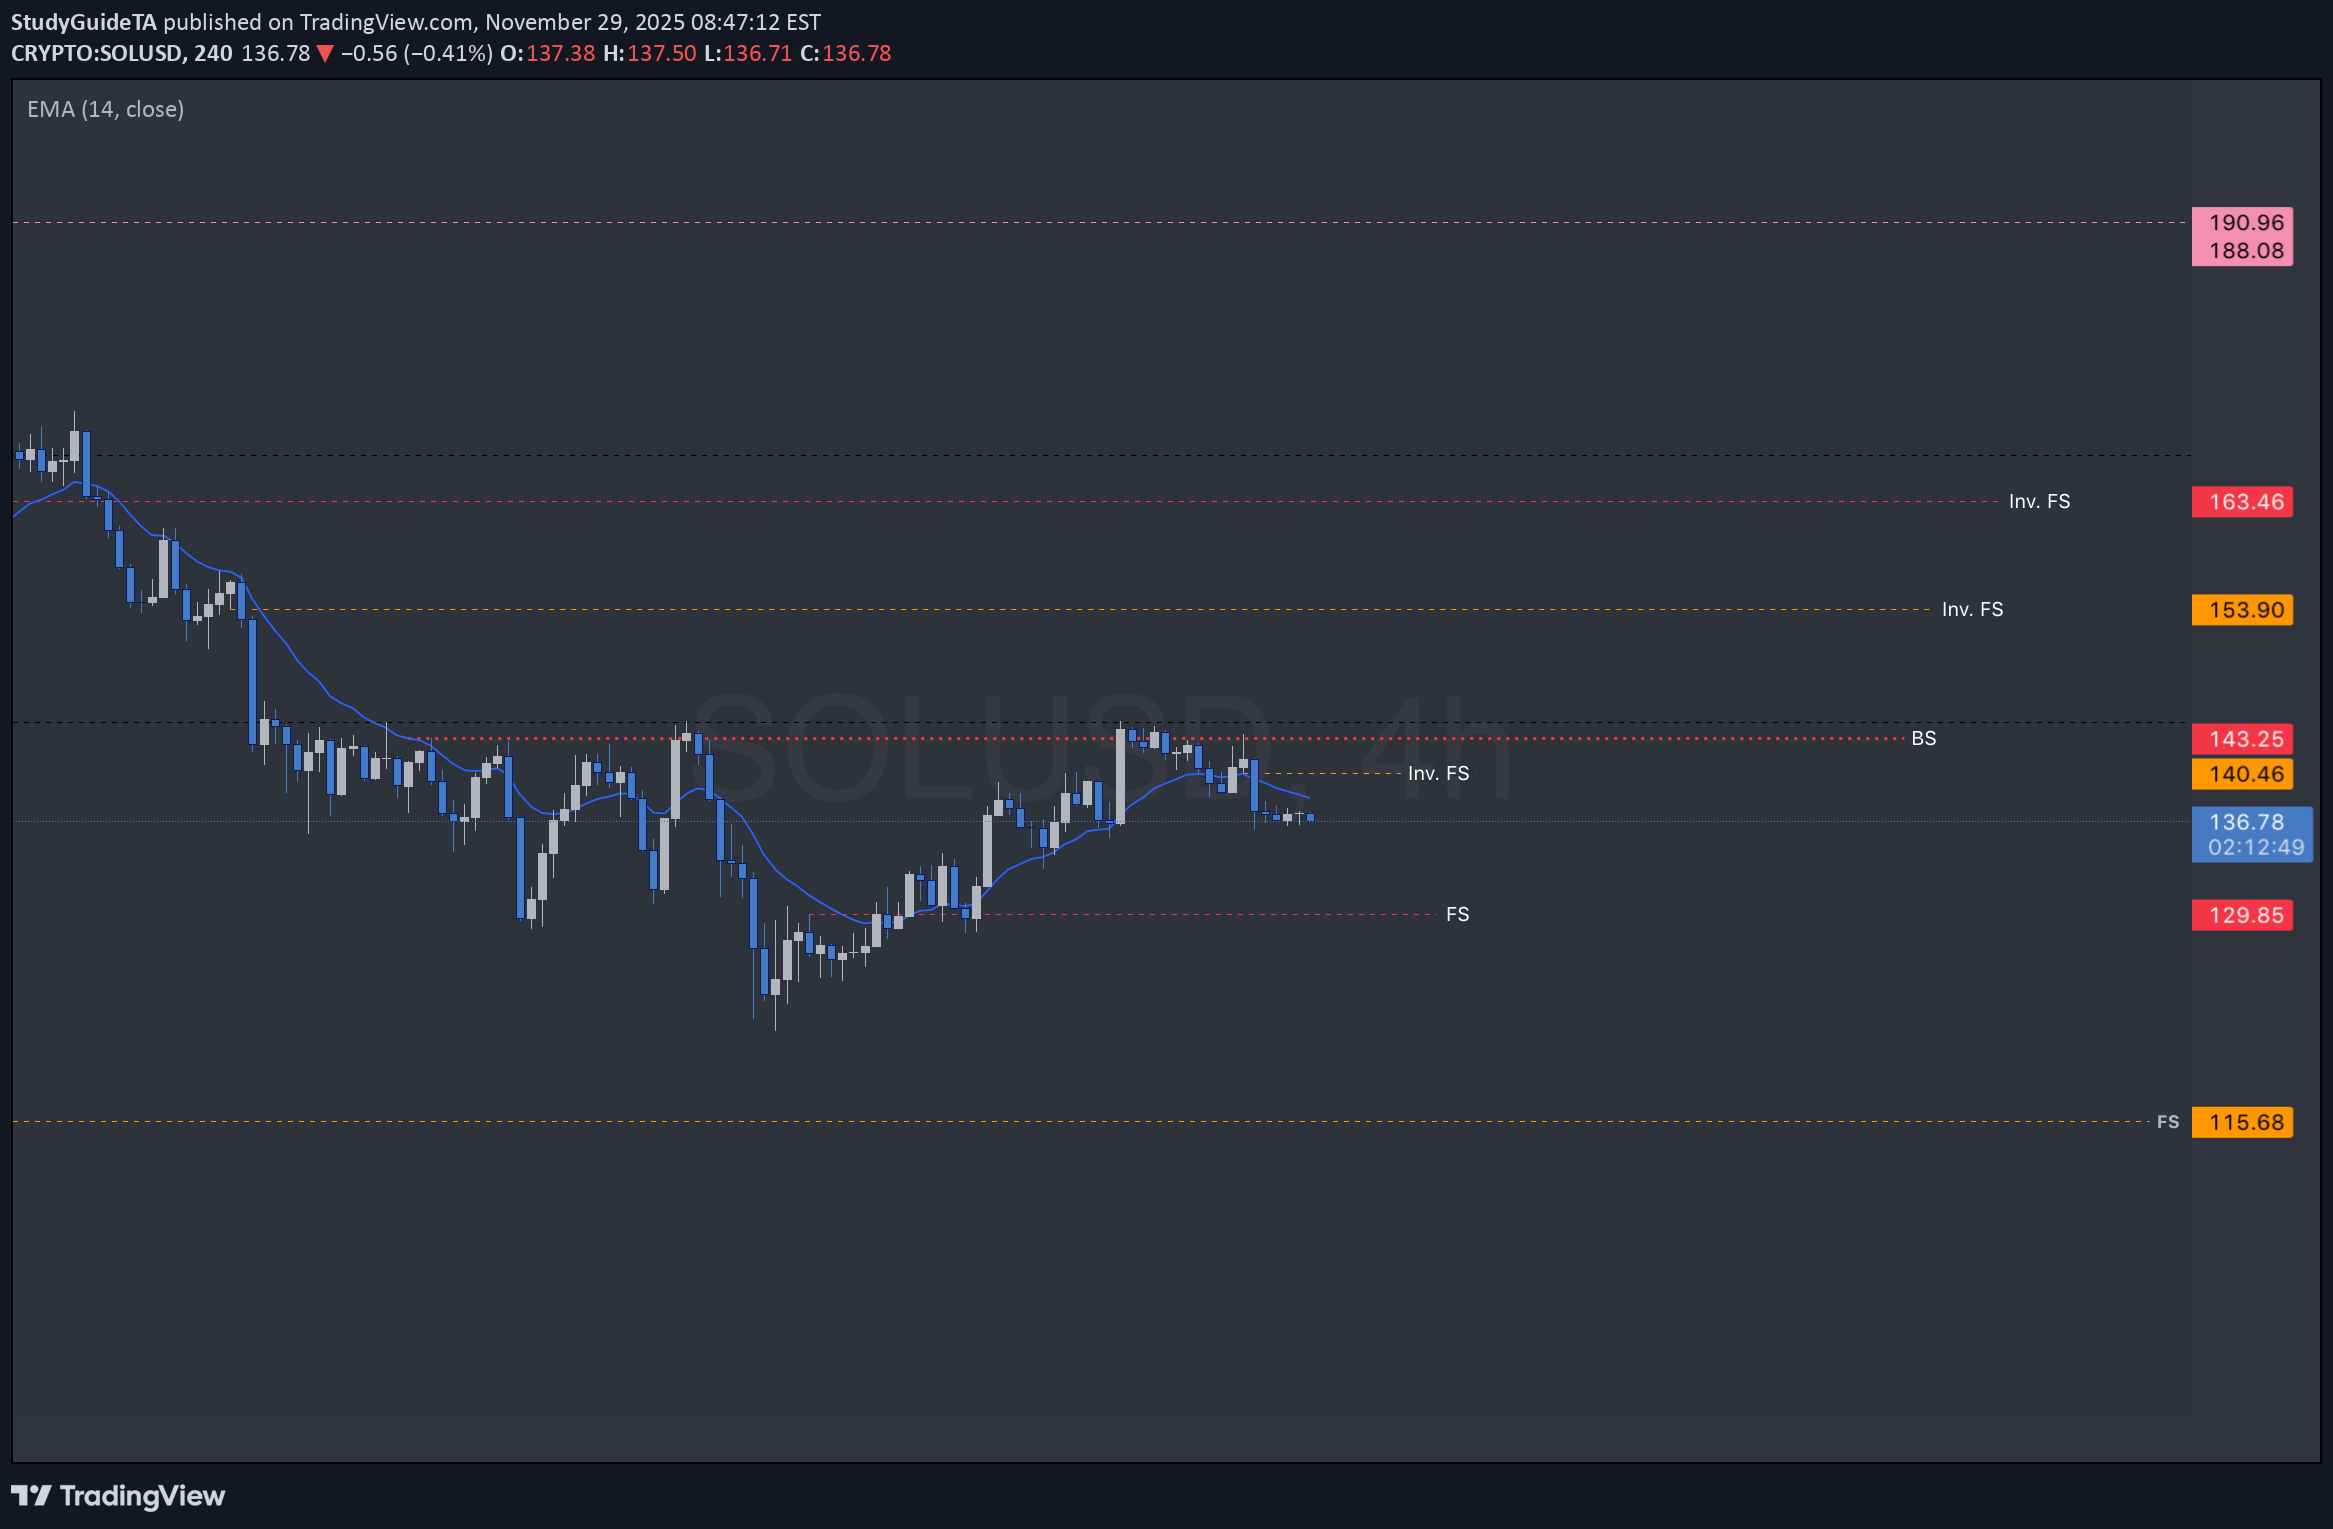
تحلیل تکنیکال BNB در تایمفریم 4 ساعته: رمزگشایی سطوح حمایت و مقاومت (BS/FS)
T.A explained - BackSide (BS) FrontSide (FS) Inverse BS (Inv.BS) Inverse FS (Inv.FS) BS & FS levels are expected support when dashed lines, tested when dotted and resistance when solid lines. The inverse is true for the Inv. BS Inv. FS levels, they are resistance as dashed lines, tested as dotted and support as solid lines. Monthly timeframe is color pink weekly grey daily is red 4hr is orange 1hr is yellow 15min is blue 5min is green if they are shown. strength favors the higher timeframe. 2x dotted levels are origin levels where trends have or will originate. When trends break, price will target the origin of the trend. its math, when the trend breaks, the vertex breaks too so the higher timeframe level/trend that breaks, the more volatility there could be as strength in the orders flow in to fuel the move.
StudyGuideTA
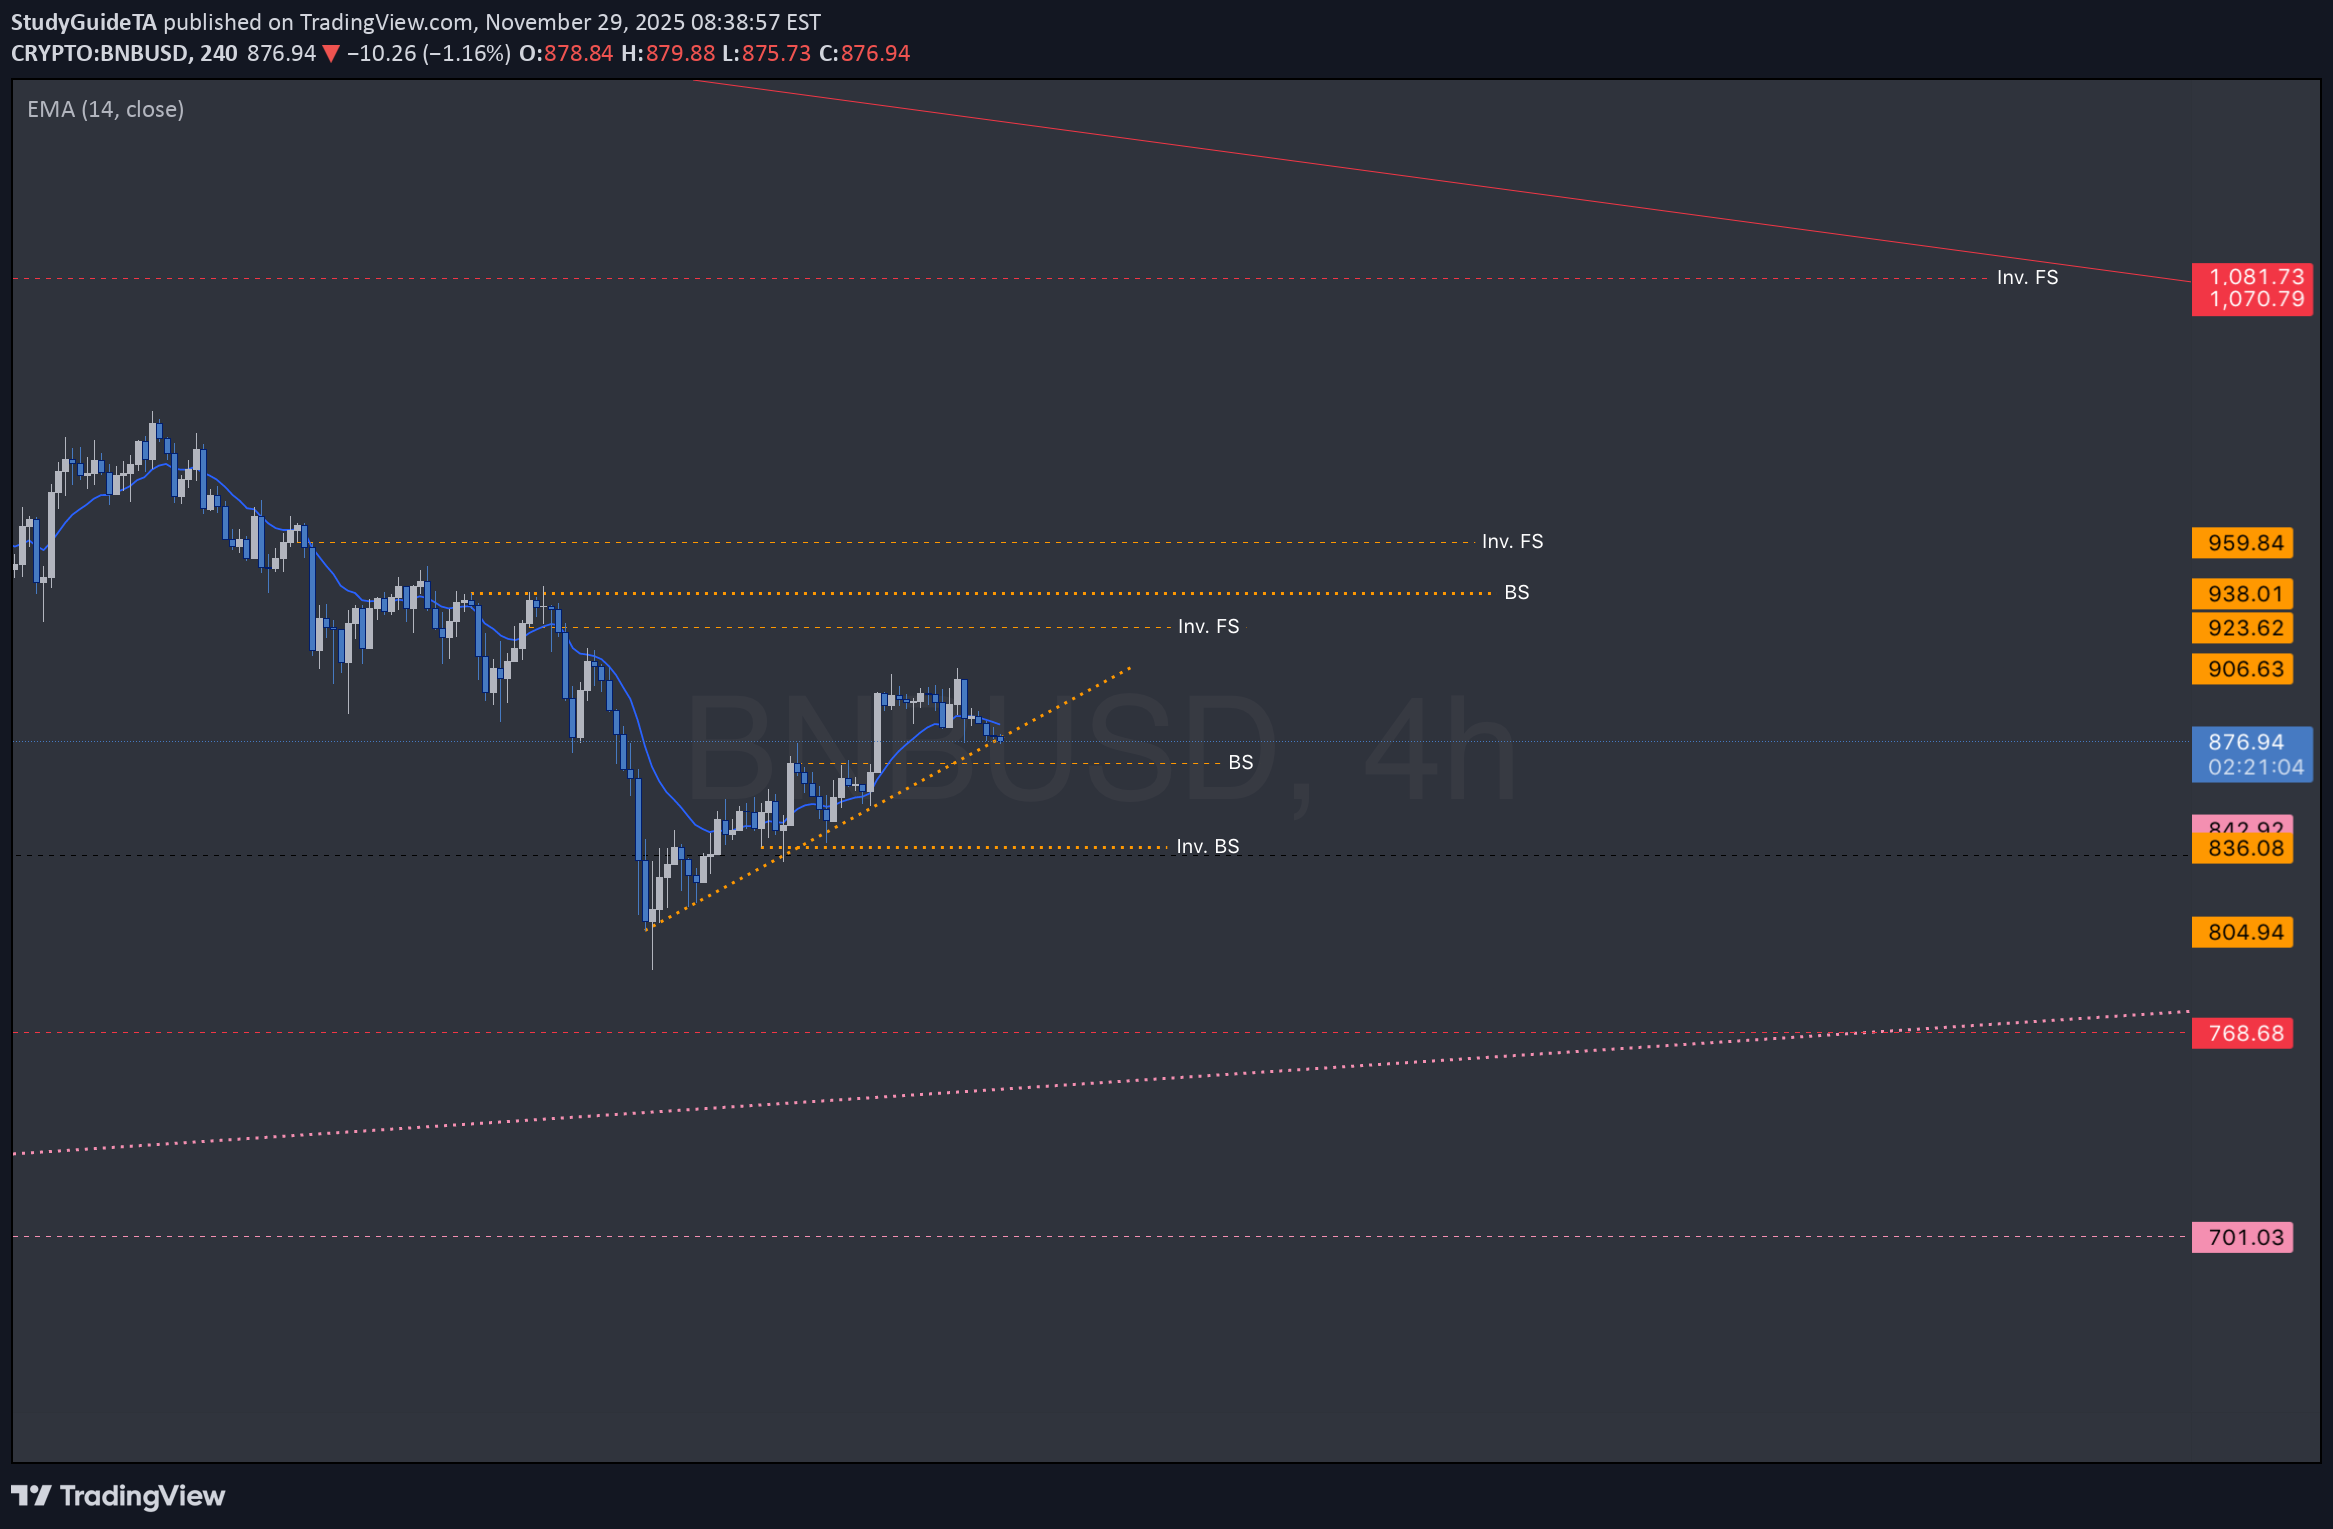
تحلیل تکنیکال اتریوم (ETH): سطوح کلیدی حمایت و مقاومت بر اساس نمودار ساعتی
T.A explained - BackSide (BS) FrontSide (FS) Inverse BS (Inv.BS) Inverse FS (Inv.FS) BS & FS levels are expected support when dashed lines, tested when dotted and resistance when solid lines. The inverse is true for the Inv. BS Inv. FS levels, they are resistance as dashed lines, tested as dotted and support as solid lines. Monthly timeframe is color pink weekly grey daily is red 4hr is orange 1hr is yellow 15min is blue 5min is green if they are shown. strength favors the higher timeframe. 2x dotted levels are origin levels where trends have or will originate. When trends break, price will target the origin of the trend. its math, when the trend breaks, the vertex breaks too so the higher timeframe level/trend that breaks, the more volatility there could be as strength in the orders flow in to fuel the move.
StudyGuideTA
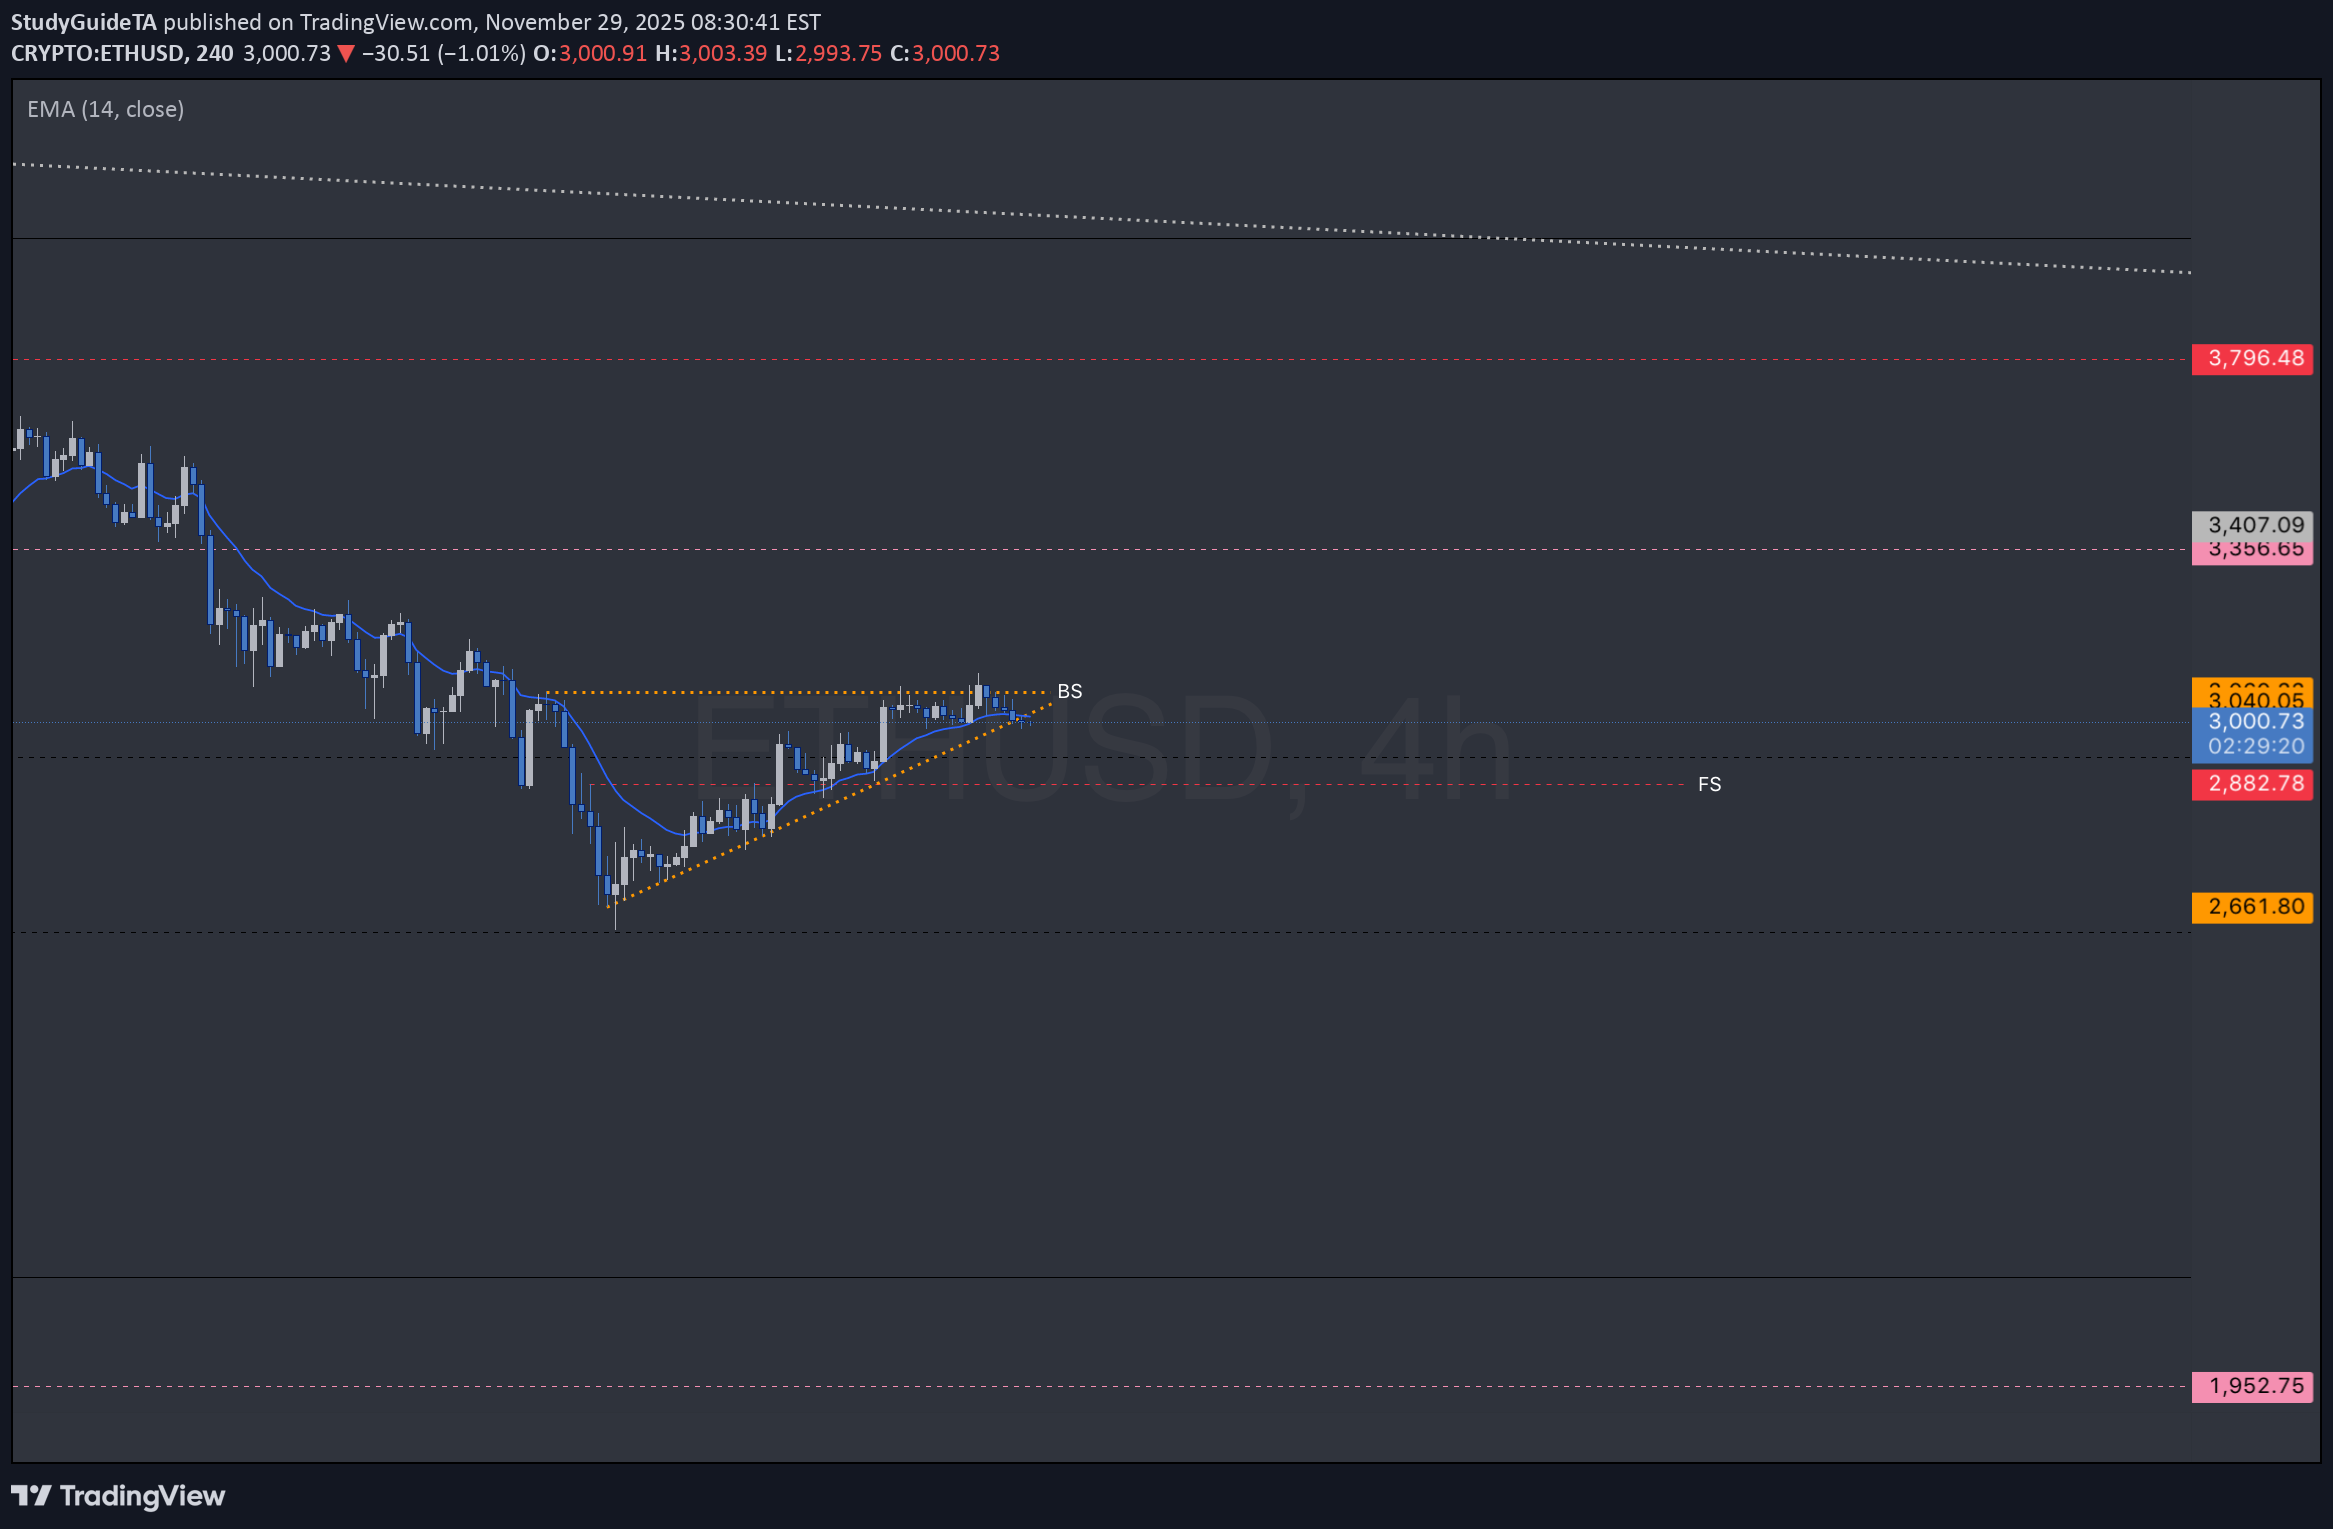
تحلیل بیت کوین (BTC): نقشههای پنهان حمایت و مقاومت در تایم فریم ساعتی
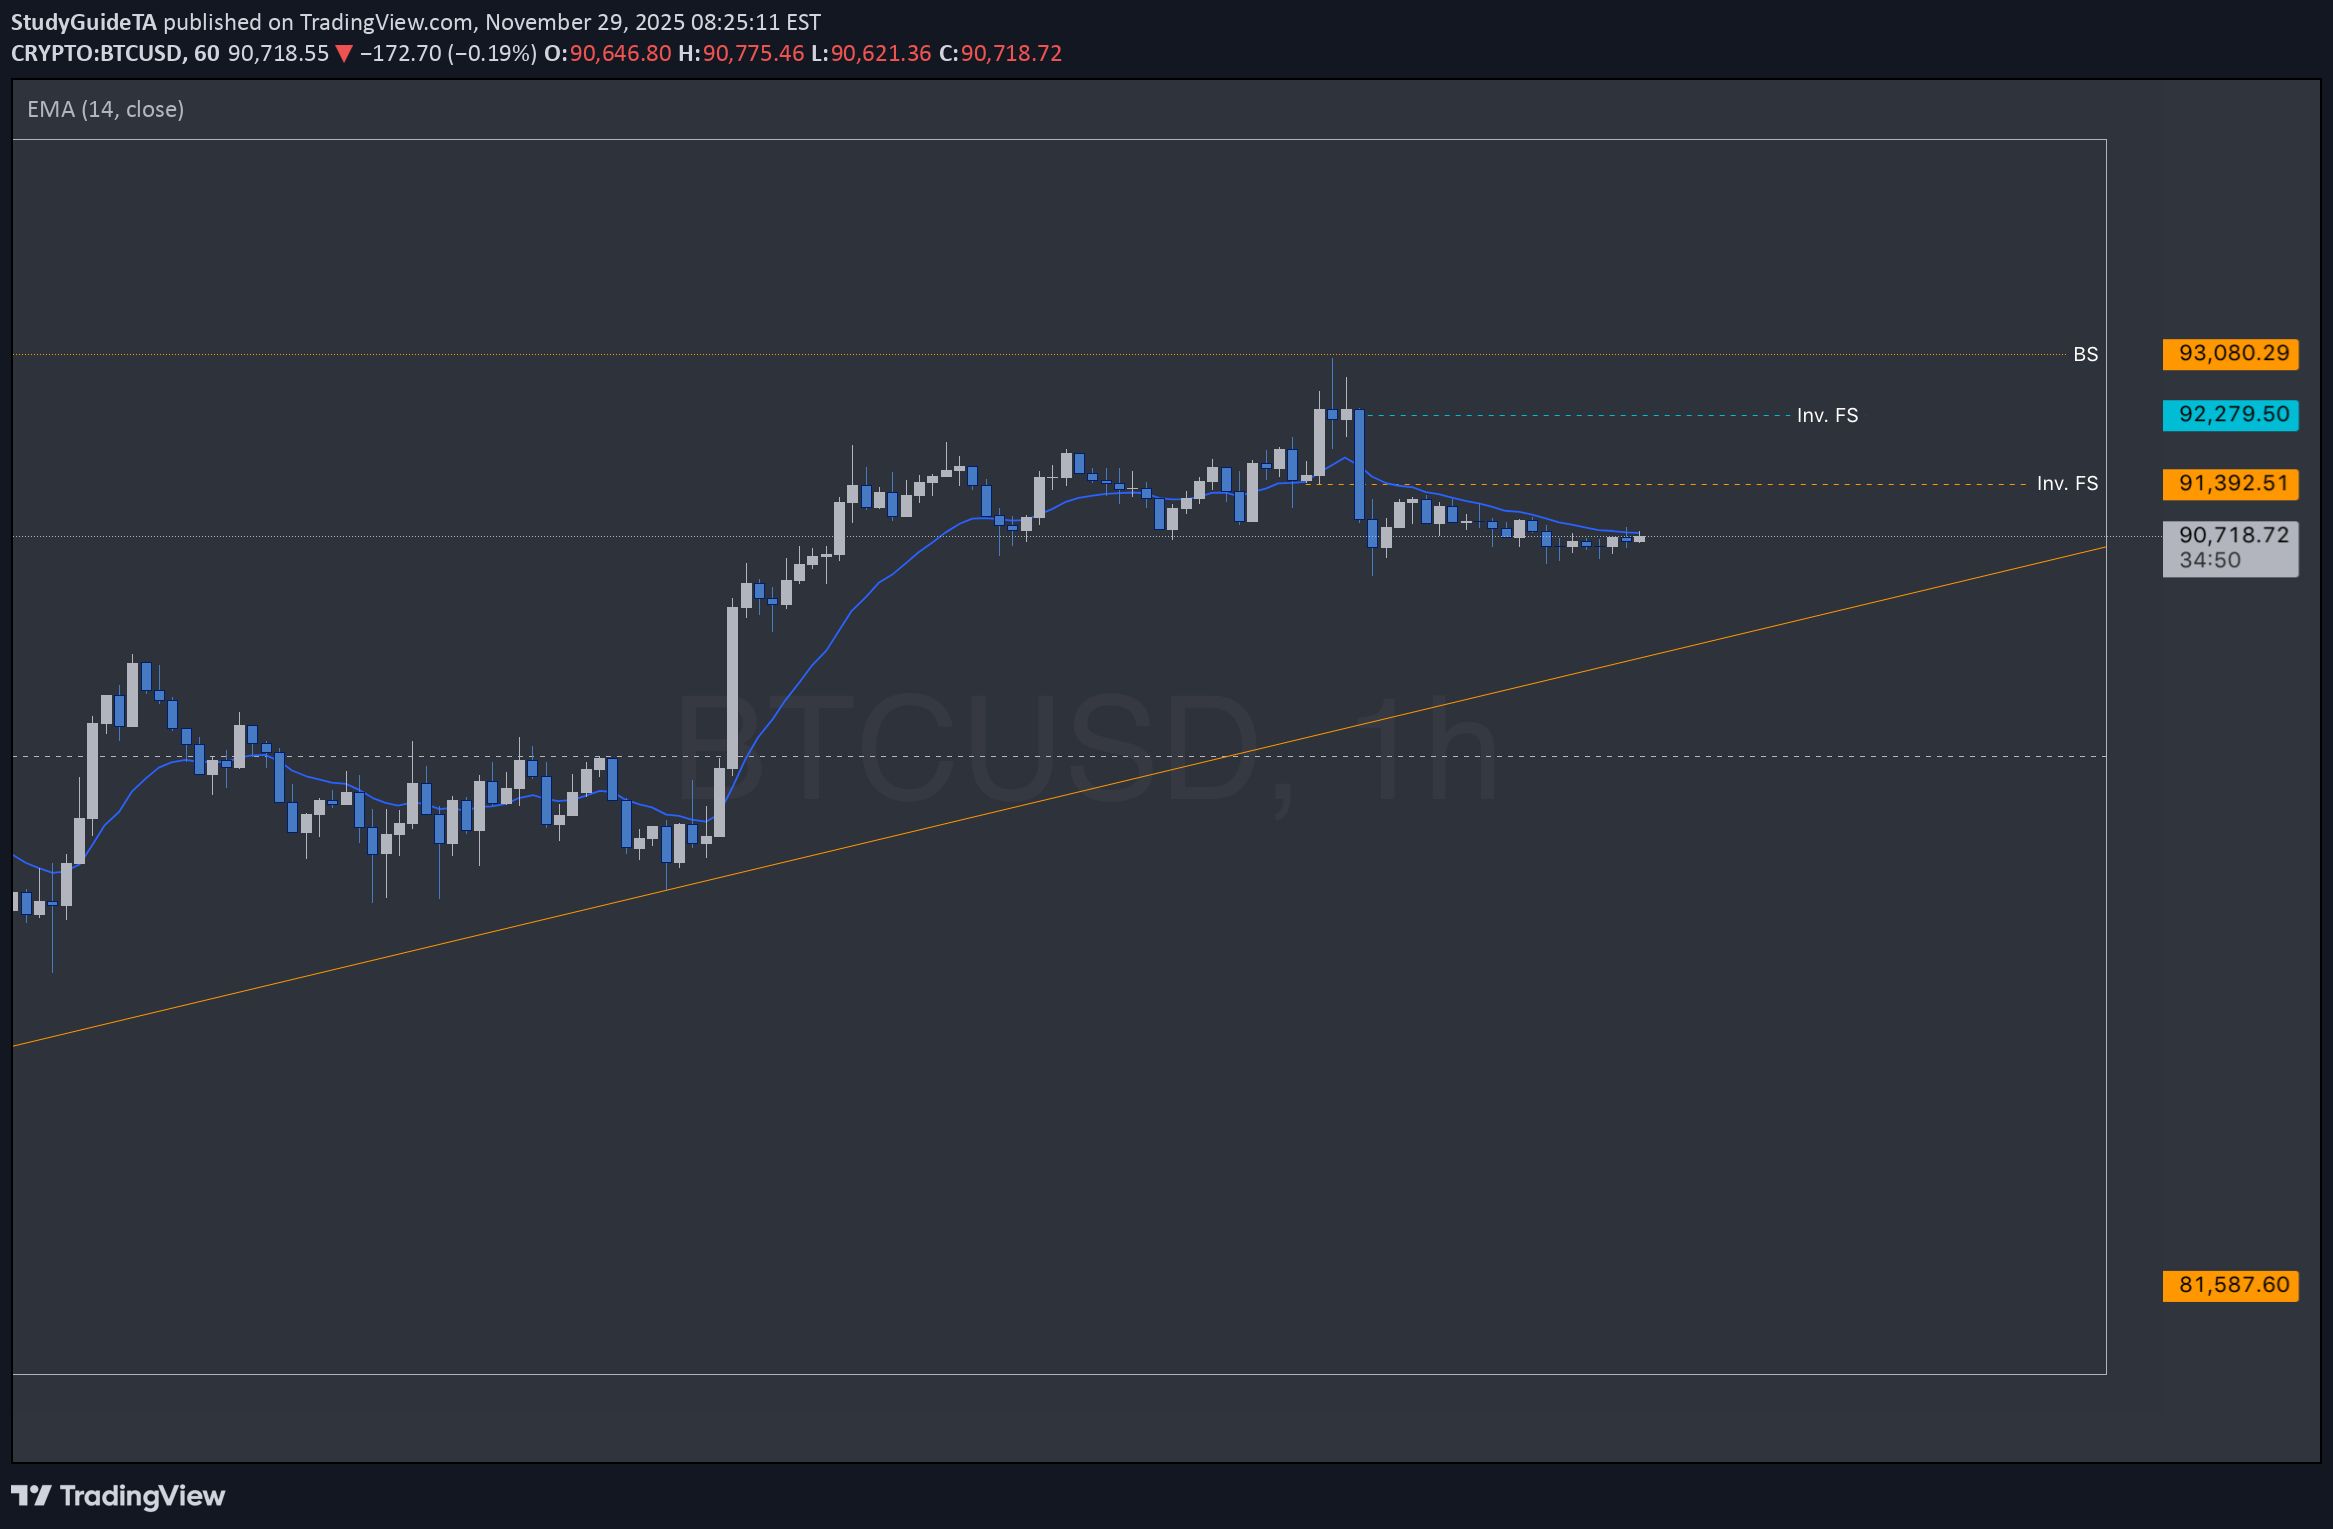
T.A explained - BackSide (BS) FrontSide (FS) Inverse BS (Inv.BS) Inverse FS (Inv.FS) BS & FS levels are expected support when dashed lines, tested when dotted and resistance when solid lines. The inverse is true for the Inv. BS Inv. FS levels, they are resistance as dashed lines, tested as dotted and support as solid lines. Monthly timeframe is color pink weekly grey daily is red 4hr is orange 1hr is yellow 15min is blue 5min is green if they are shown. strength favors the higher timeframe. 2x dotted levels are origin levels where trends have or will originate. When trends break, price will target the origin of the trend. its math, when the trend breaks, the vertex breaks too so the higher timeframe level/trend that breaks, the more volatility there could be as strength in the orders flow in to fuel the move.
StudyGuideTA
تحلیل تکنیکال ساعتی XRP: اسرار سطوح حمایت و مقاومت (BackSide و FrontSide) فاش شد!
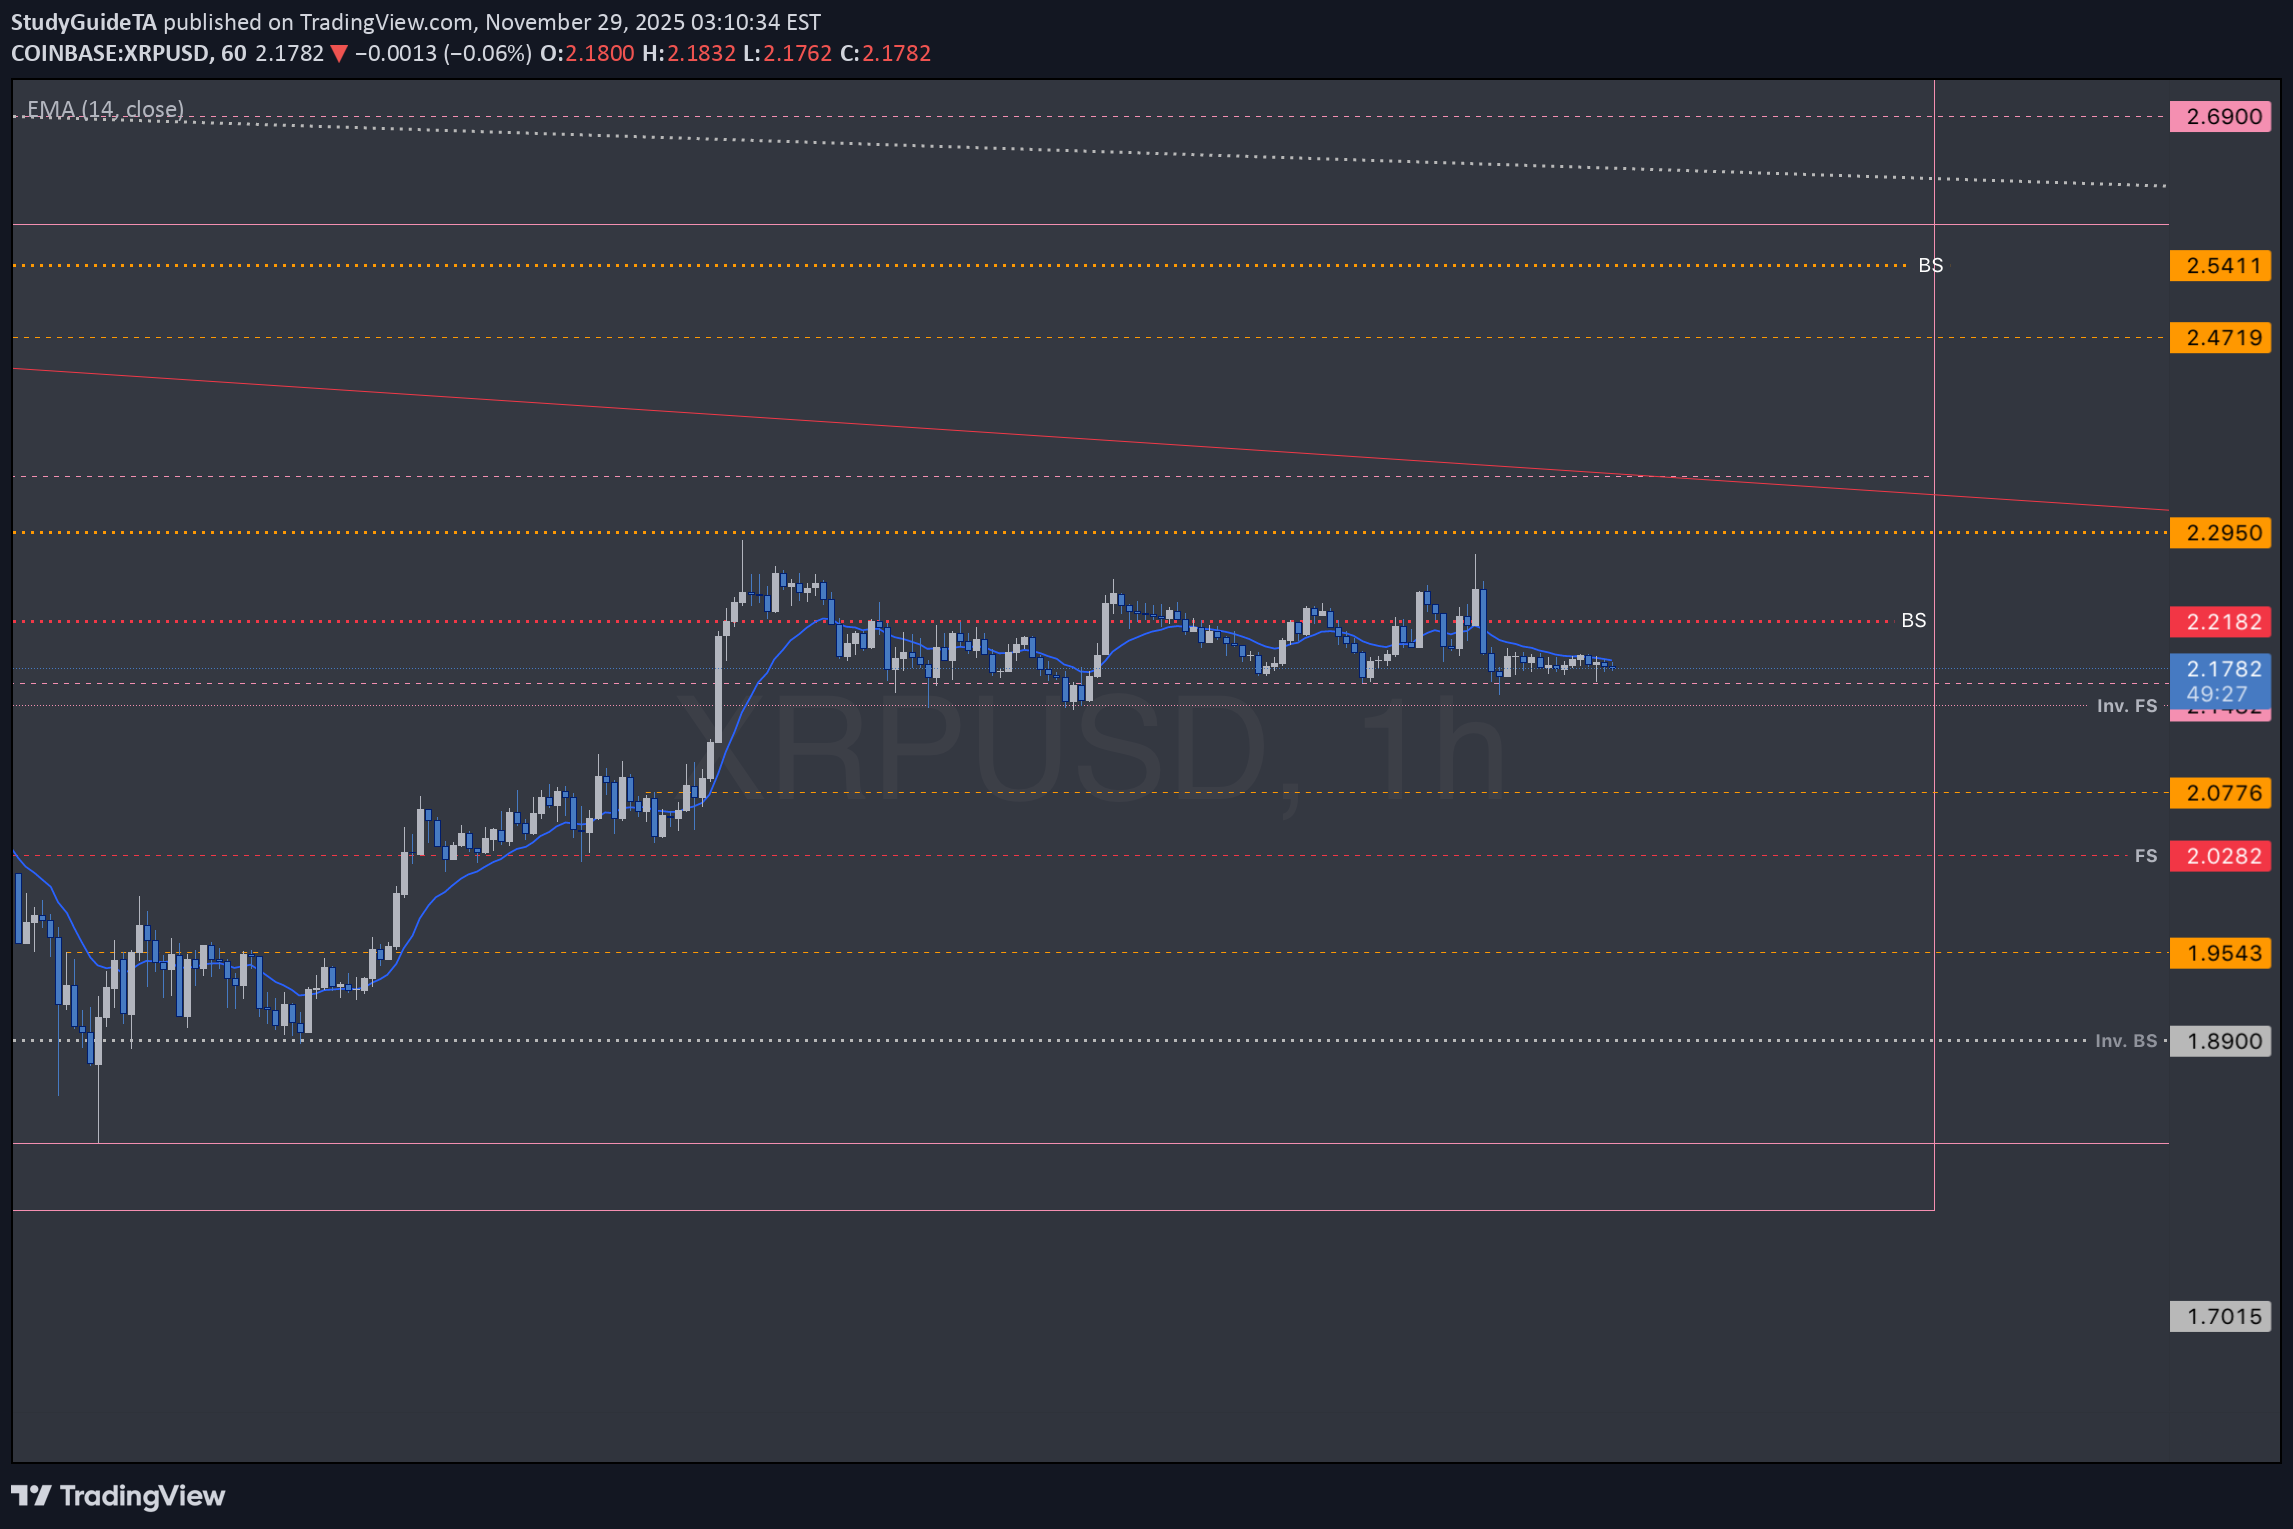
updated an XRP chart T.A explained - BackSide (BS) FrontSide (FS) Inverse BS (Inv.BS) Inverse FS (Inv.FS) BS & FS levels are expected support when dashed lines, tested when dotted and resistance when solid lines. The inverse is true for the Inv. BS Inv. FS levels, they are resistance as dashed lines, tested as dotted and support as solid lines. Monthly timeframe is color pink weekly grey daily is red 4hr is orange 1hr is yellow 15min is blue 5min is green if they are shown. strength favors the higher timeframe. 2x dotted levels are origin levels where trends have or will originate. When trends break, price will target the origin of the trend. its math, when the trend breaks, the vertex breaks too so the higher timeframe level/trend that breaks, the more volatility there could be as strength in the orders flow in to fuel the move.
StudyGuideTA
تحلیل نمودار روزانه SHX: سطوح حمایت و مقاومت مخفی (BackSide و FrontSide)
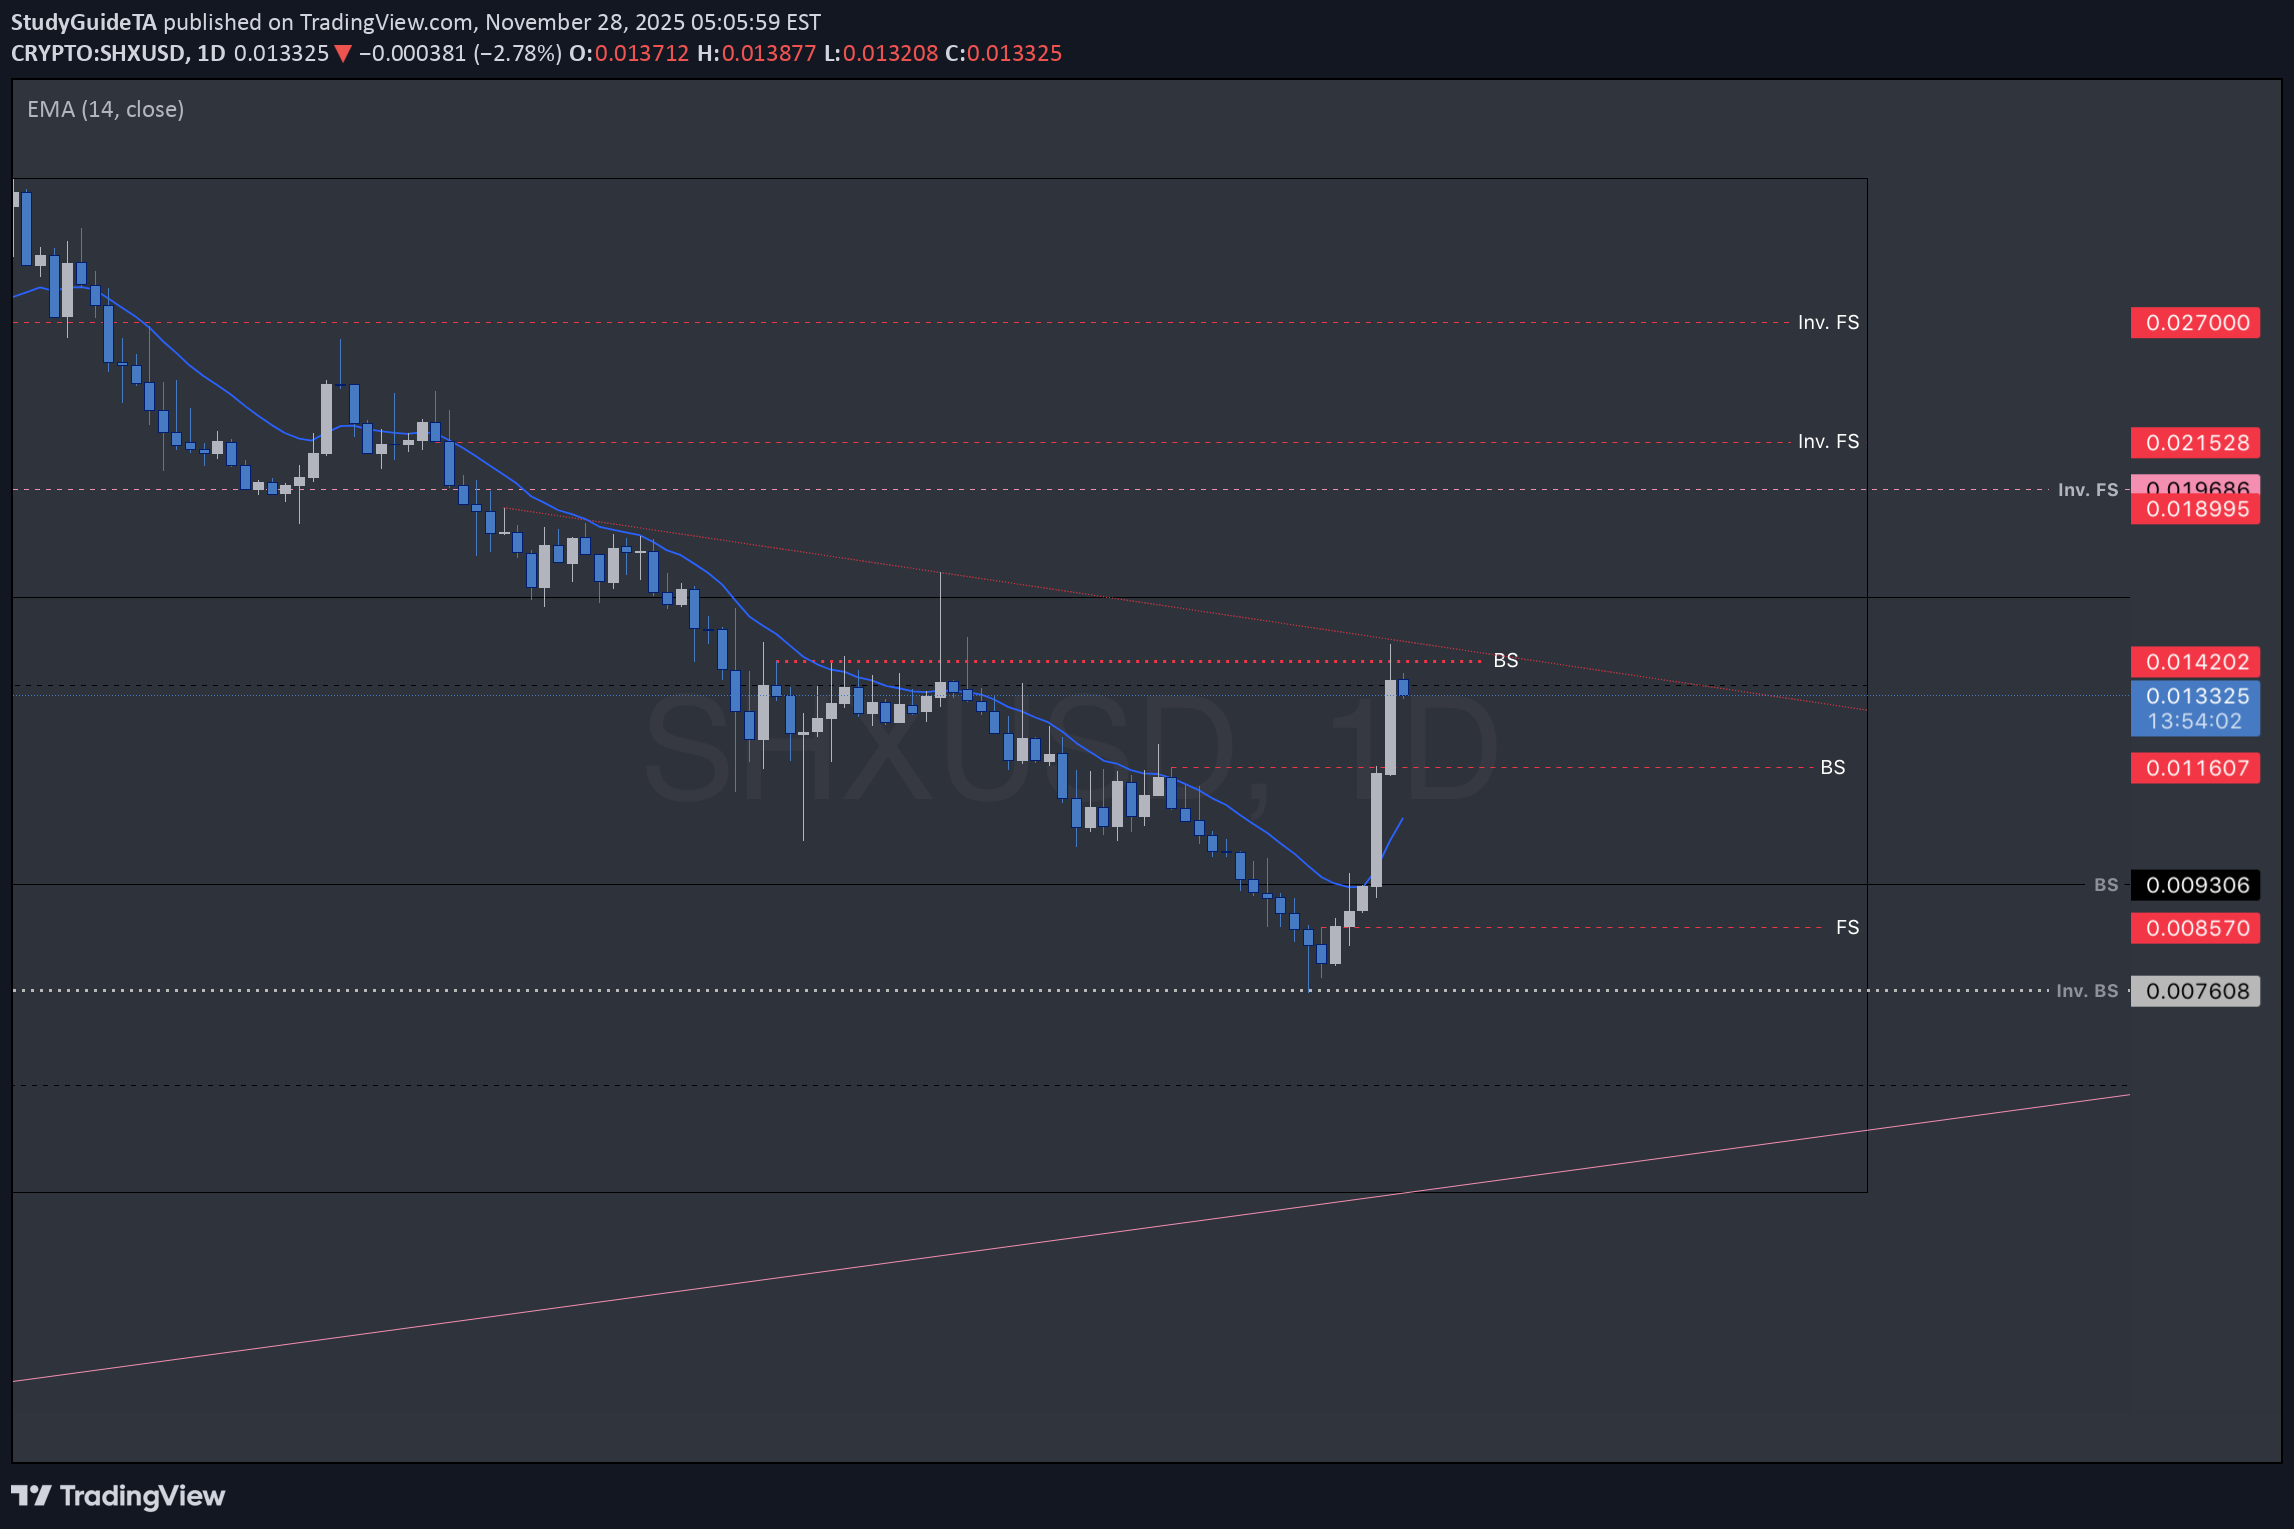
T.A explained - BackSide (BS) FrontSide (FS) Inverse BS (Inv.BS) Inverse FS (Inv.FS) BS & FS levels are expected support when dashed lines, tested when dotted and resistance when solid lines. The inverse is true for the Inv. BS Inv. FS levels, they are resistance as dashed lines, tested as dotted and support as solid lines. Monthly timeframe is color pink weekly grey daily is red 4hr is orange 1hr is yellow 15min is blue 5min is green if they are shown. strength favors the higher timeframe. 2x dotted levels are origin levels where trends have or will originate. When trends break, price will target the origin of the trend. its math, when the trend breaks, the vertex breaks too so the higher timeframe level/trend that breaks, the more volatility there could be as strength in the orders flow in to fuel the move.
StudyGuideTA
تحلیل تکنیکال بیت کوین 4 ساعته: راز سطوح حمایت و مقاومت (BS/FS) کشف شد!
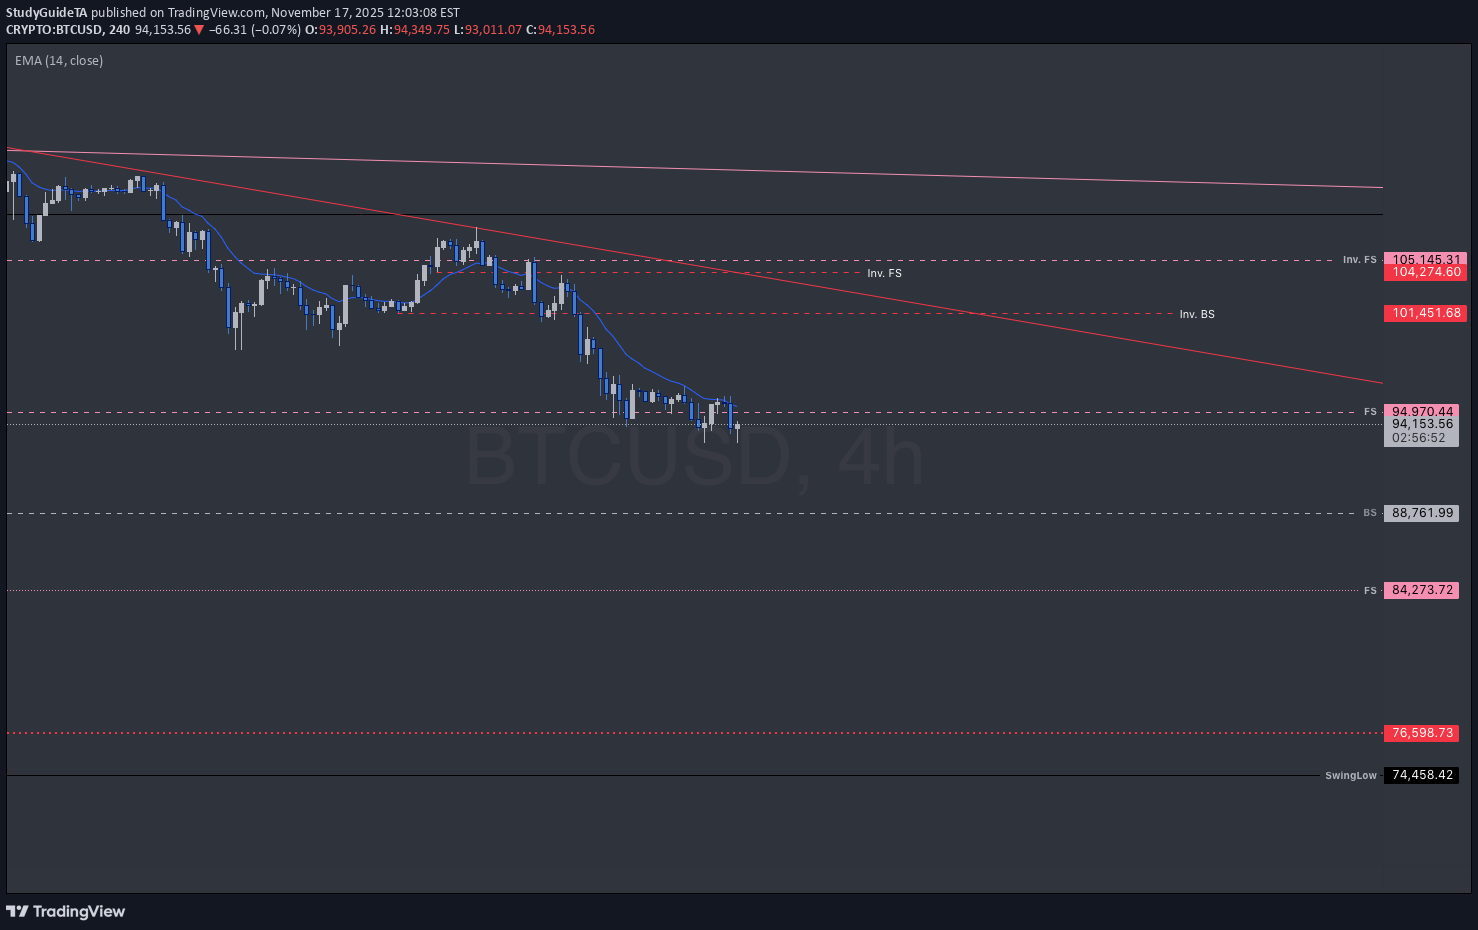
T.A explained - BackSide (BS) FrontSide (FS) Inverse BS (Inv.BS) Inverse FS (Inv.FS) BS & FS levels are expected support when dashed lines, tested when dotted and resistance when solid lines. The inverse is true for the Inv. BS Inv. FS levels, they are resistance as dashed lines, tested as dotted and support as solid lines. Monthly timeframe is color pink weekly grey daily is red 4hr is orange 1hr is yellow 15min is blue 5min is green if they are shown. strength favors the higher timeframe. 2x dotted levels are origin levels where trends have or will originate. When trends break, price will target the origin of the trend. its math, when the trend breaks, the vertex breaks too so the higher timeframe level/trend that breaks, the more volatility there could be as strength in the orders flow in to fuel the move.The Weekly BackSide level was tested and the expectation of a BackSide level is to see a big reaction to price comparative to the strength of the timeframe tested so a weekly strength should have a big reaction to price enough to make a daily support level within the week so there should be 1hr and 4hr levels of support forming. If not, the level will fail and price will target a lower level or re-test the same level to create an origin; a level where a range trend will originate. Then the process restarts trying to build those lower timeframe levels of support.
StudyGuideTA
تحلیل تکنیکال بیت کوین: سطوح حمایتی جدید در تایم فریم ساعتی و پیشبینی حرکت بعدی
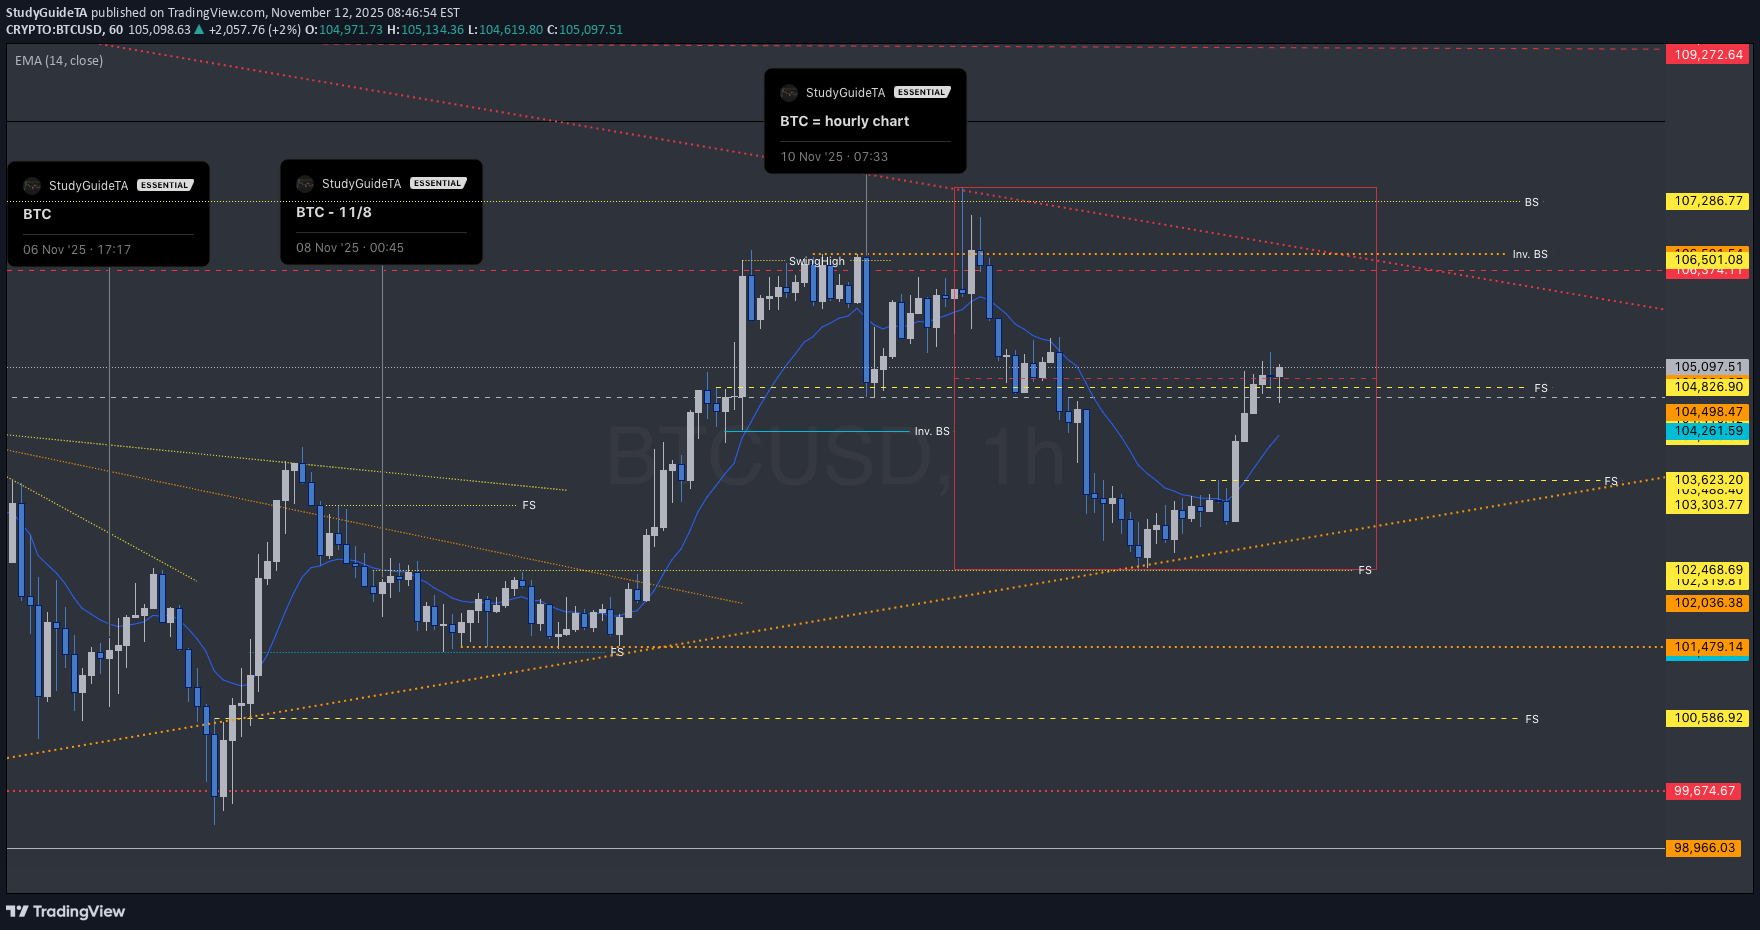
I adapted the accumulation trend from a daily trend to a 4hr trend since it broke yesterday down to a 1hr FS support level created 7th Nov 23:00 I added a new 1hr FS support level created the 12 Now at 00:00 hours which sits at $103,623 T.A explained - BackSide (BS) FrontSide (FS) Inverse BS (Inv.BS) Inverse FS (Inv.FS) BS & FS levels are expected support when dashed lines, tested when dotted and resistance when solid lines. The inverse is true for the Inv. BS Inv. FS levels, they are resistance as dashed lines, tested as dotted and support as solid lines. Monthly timeframe is color pink weekly grey daily is red 4hr is orange 1hr is yellow 15min is blue 5min is green if they are shown. strength favors the higher timeframe. 2x dotted levels are origin levels where trends have or will originate. When trends break, price will target the origin of the trend. its math, when the trend breaks, the vertex breaks too so the higher timeframe level/trend that breaks, the more volatility there could be as strength in the orders flow in to fuel the move. yesterday Trade closed manually price followed the candle science and timeframes from the 5min green levels to the weekly grey level. Price has left behind some inverse frontside and inverse backside candles which look to be forming the bridge to flip the script if price manages to gain those levels and start accumulation. That liquidity will "unlock" and fuel price action.price thinks shorts are a fashionable trend. Are you getting into shorts or waiting to put on long pants? How low will price go? I have the levels marked.i'll get another chart going for next week
StudyGuideTA
تحلیل تکنیکال XRP: راز اتصال به شبکههای مالی بزرگ و سطوح قیمتی کلیدی!
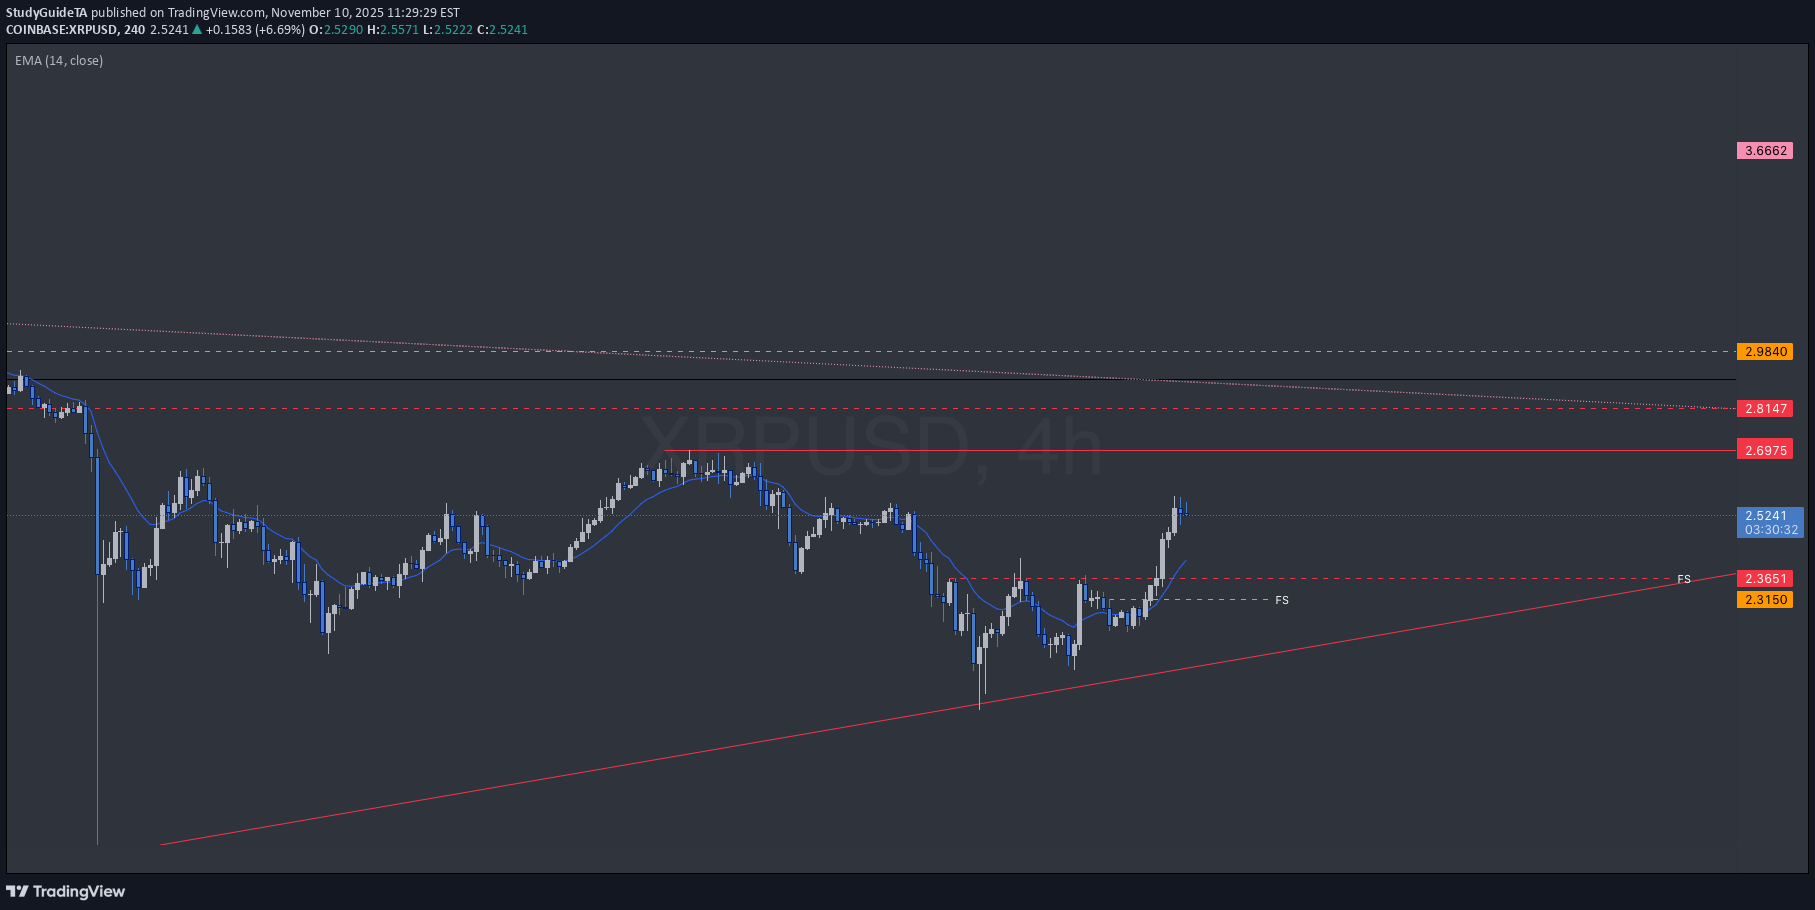
Does XRPL connect to Corda Settler & R3, Xinfin, UCC(4), ISO20022, MLETR, and did the nation of Palu, using a gold backed USD denominated currency test the XRPL? Dont hate, speculate. XRPL features Atomic settlement and rippling feature perfect for global payments. The utility is there for something, ask your favorite a.i companion. T.A explained - BackSide (BS) FrontSide (FS) Inverse BS (Inv.BS) Inverse FS (Inv.FS) BS & FS levels are expected support when dashed lines, tested when dotted and resistance when solid lines. The inverse is true for the Inv. BS Inv. FS levels, they are resistance as dashed lines, tested as dotted and support as solid lines. Monthly timeframe is color pink weekly grey daily is red 4hr is orange 1hr is yellow 15min is blue 5min is green if they are shown. strength favors the higher timeframe. 2x dotted levels are origin levels where trends have or will originate. When trends break, price will target the origin of the trend. its math, when the trend breaks, the vertex breaks too so the higher timeframe level/trend that breaks, the more volatility there could be as strength in the orders flow in to fuel the move. yesterday Trade closed manually price followed the candle science and timeframes from the 5min green levels to the weekly grey level. Price has left behind some inverse frontside and inverse backside candles which look to be forming the bridge to flip the script if price manages to gain those levels and start accumulation. That liquidity will "unlock" and fuel price action.the 4hr FS level in Orange would have been a fashionable area to put on long pants
StudyGuideTA
تحلیل نمودار روزانه XDC: داستانی که شاید هرگز اتفاق نیفتد!
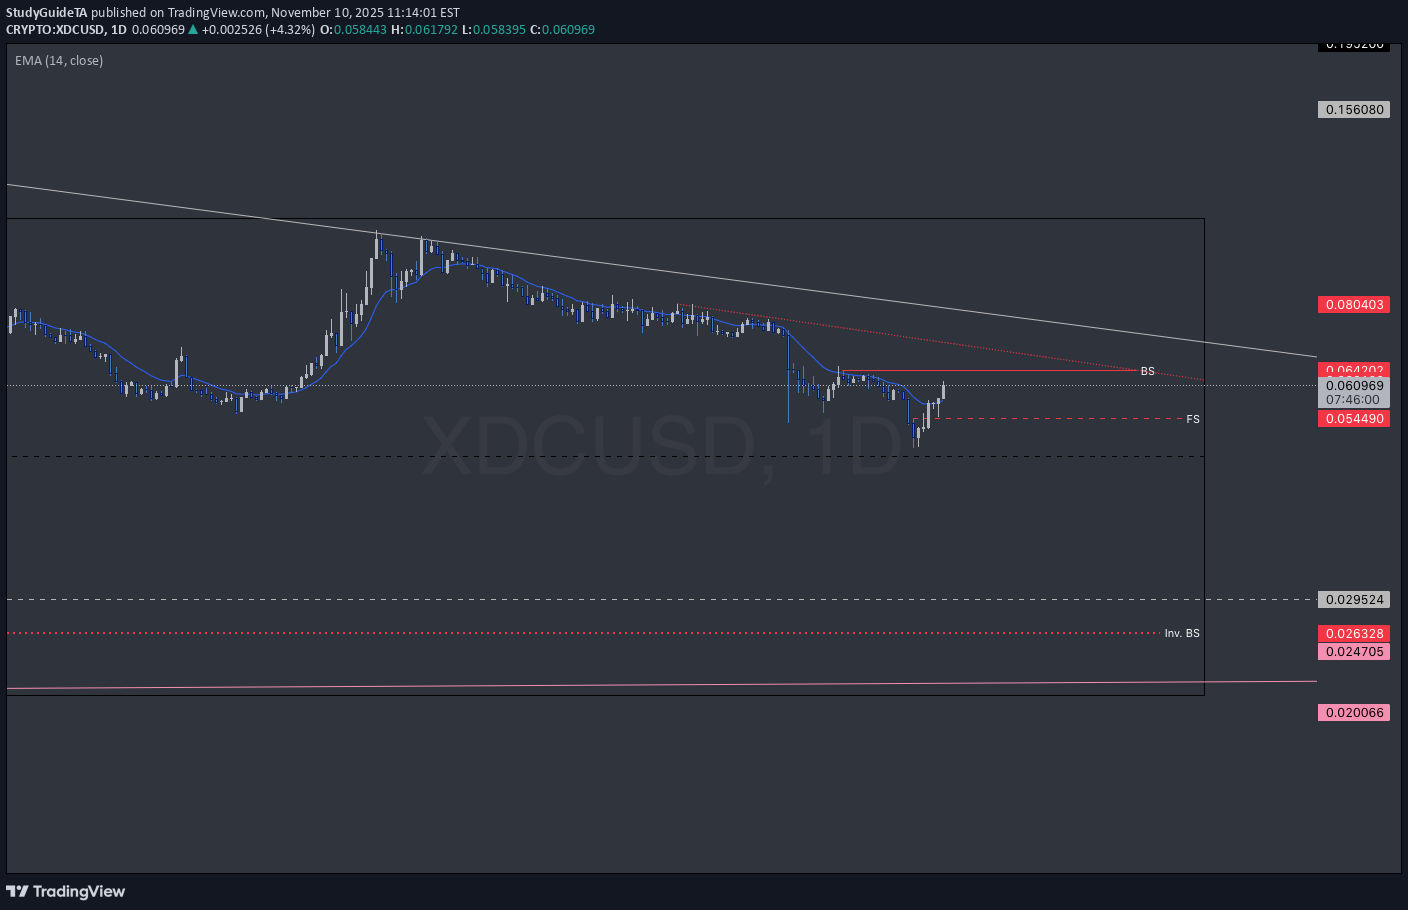
Nothing to see here just a chart about XDC maybe you know about R3, Corda Settler, XRPL, the lawsuit with ripple once upon a time or maybe you just asked Grok to find connections for fundamental research. nothing to see here. though. just a chart illustrating a story that might never happen.the black yearly median level was tested and holding so far. T.A explained - BackSide (BS) FrontSide (FS) Inverse BS (Inv.BS) Inverse FS (Inv.FS) BS & FS levels are expected support when dashed lines, tested when dotted and resistance when solid lines. The inverse is true for the Inv. BS Inv. FS levels, they are resistance as dashed lines, tested as dotted and support as solid lines. Monthly timeframe is color pink weekly grey daily is red 4hr is orange 1hr is yellow 15min is blue 5min is green if they are shown. strength favors the higher timeframe. 2x dotted levels are origin levels where trends have or will originate. When trends break, price will target the origin of the trend. its math, when the trend breaks, the vertex breaks too so the higher timeframe level/trend that breaks, the more volatility there could be as strength in the orders flow in to fuel the move.
Disclaimer
Any content and materials included in Sahmeto's website and official communication channels are a compilation of personal opinions and analyses and are not binding. They do not constitute any recommendation for buying, selling, entering or exiting the stock market and cryptocurrency market. Also, all news and analyses included in the website and channels are merely republished information from official and unofficial domestic and foreign sources, and it is obvious that users of the said content are responsible for following up and ensuring the authenticity and accuracy of the materials. Therefore, while disclaiming responsibility, it is declared that the responsibility for any decision-making, action, and potential profit and loss in the capital market and cryptocurrency market lies with the trader.