
S
Sonic
| تریدر | نوع سیگنال | حد سود/ضرر | زمان انتشار | مشاهده پیام |
|---|---|---|---|---|
No results found. | ||||
Price Chart of Sonic
سود 3 Months :
خلاصه سیگنالهای Sonic
سیگنالهای Sonic
Filter
Sort messages by
Trader Type
Time Frame

تحلیل تکنیکال SONIC: آیا قیمت به زودی از منطقه تقاضا جهش صعودی خواهد داشت؟
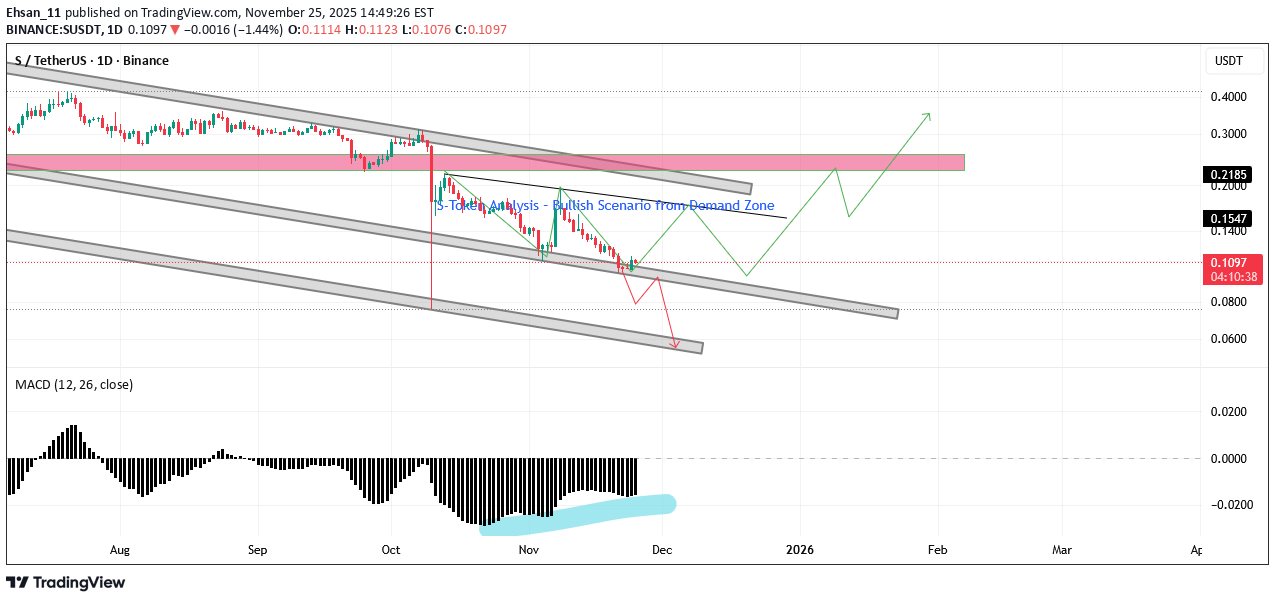
SONIC Technical Analysis – Bullish Scenario The overall market structure is still moving inside a long-term descending channel, and the price continues to react to both the upper and lower boundaries. Currently, the price has reached a key demand zone as well as the lower boundary of a secondary falling channel, which may act as a potential reversal area. On the daily timeframe, the MACD shows a positive divergence, indicating weakening bearish momentum and increasing probability of a corrective upward move. The bullish scenario suggests that the price may start a corrective upward wave, first testing the mid-range resistance levels. If these levels are successfully broken, the next potential target area lies between $0.14 and $0.22, which represents the medium-term resistance zone. This scenario depends on strong bullish continuation and breakout confirmation. If the current support fails, this bullish scenario becomes invalid. This analysis represents my personal opinion and should not be considered financial advice.

The_Alchemist_Trader_
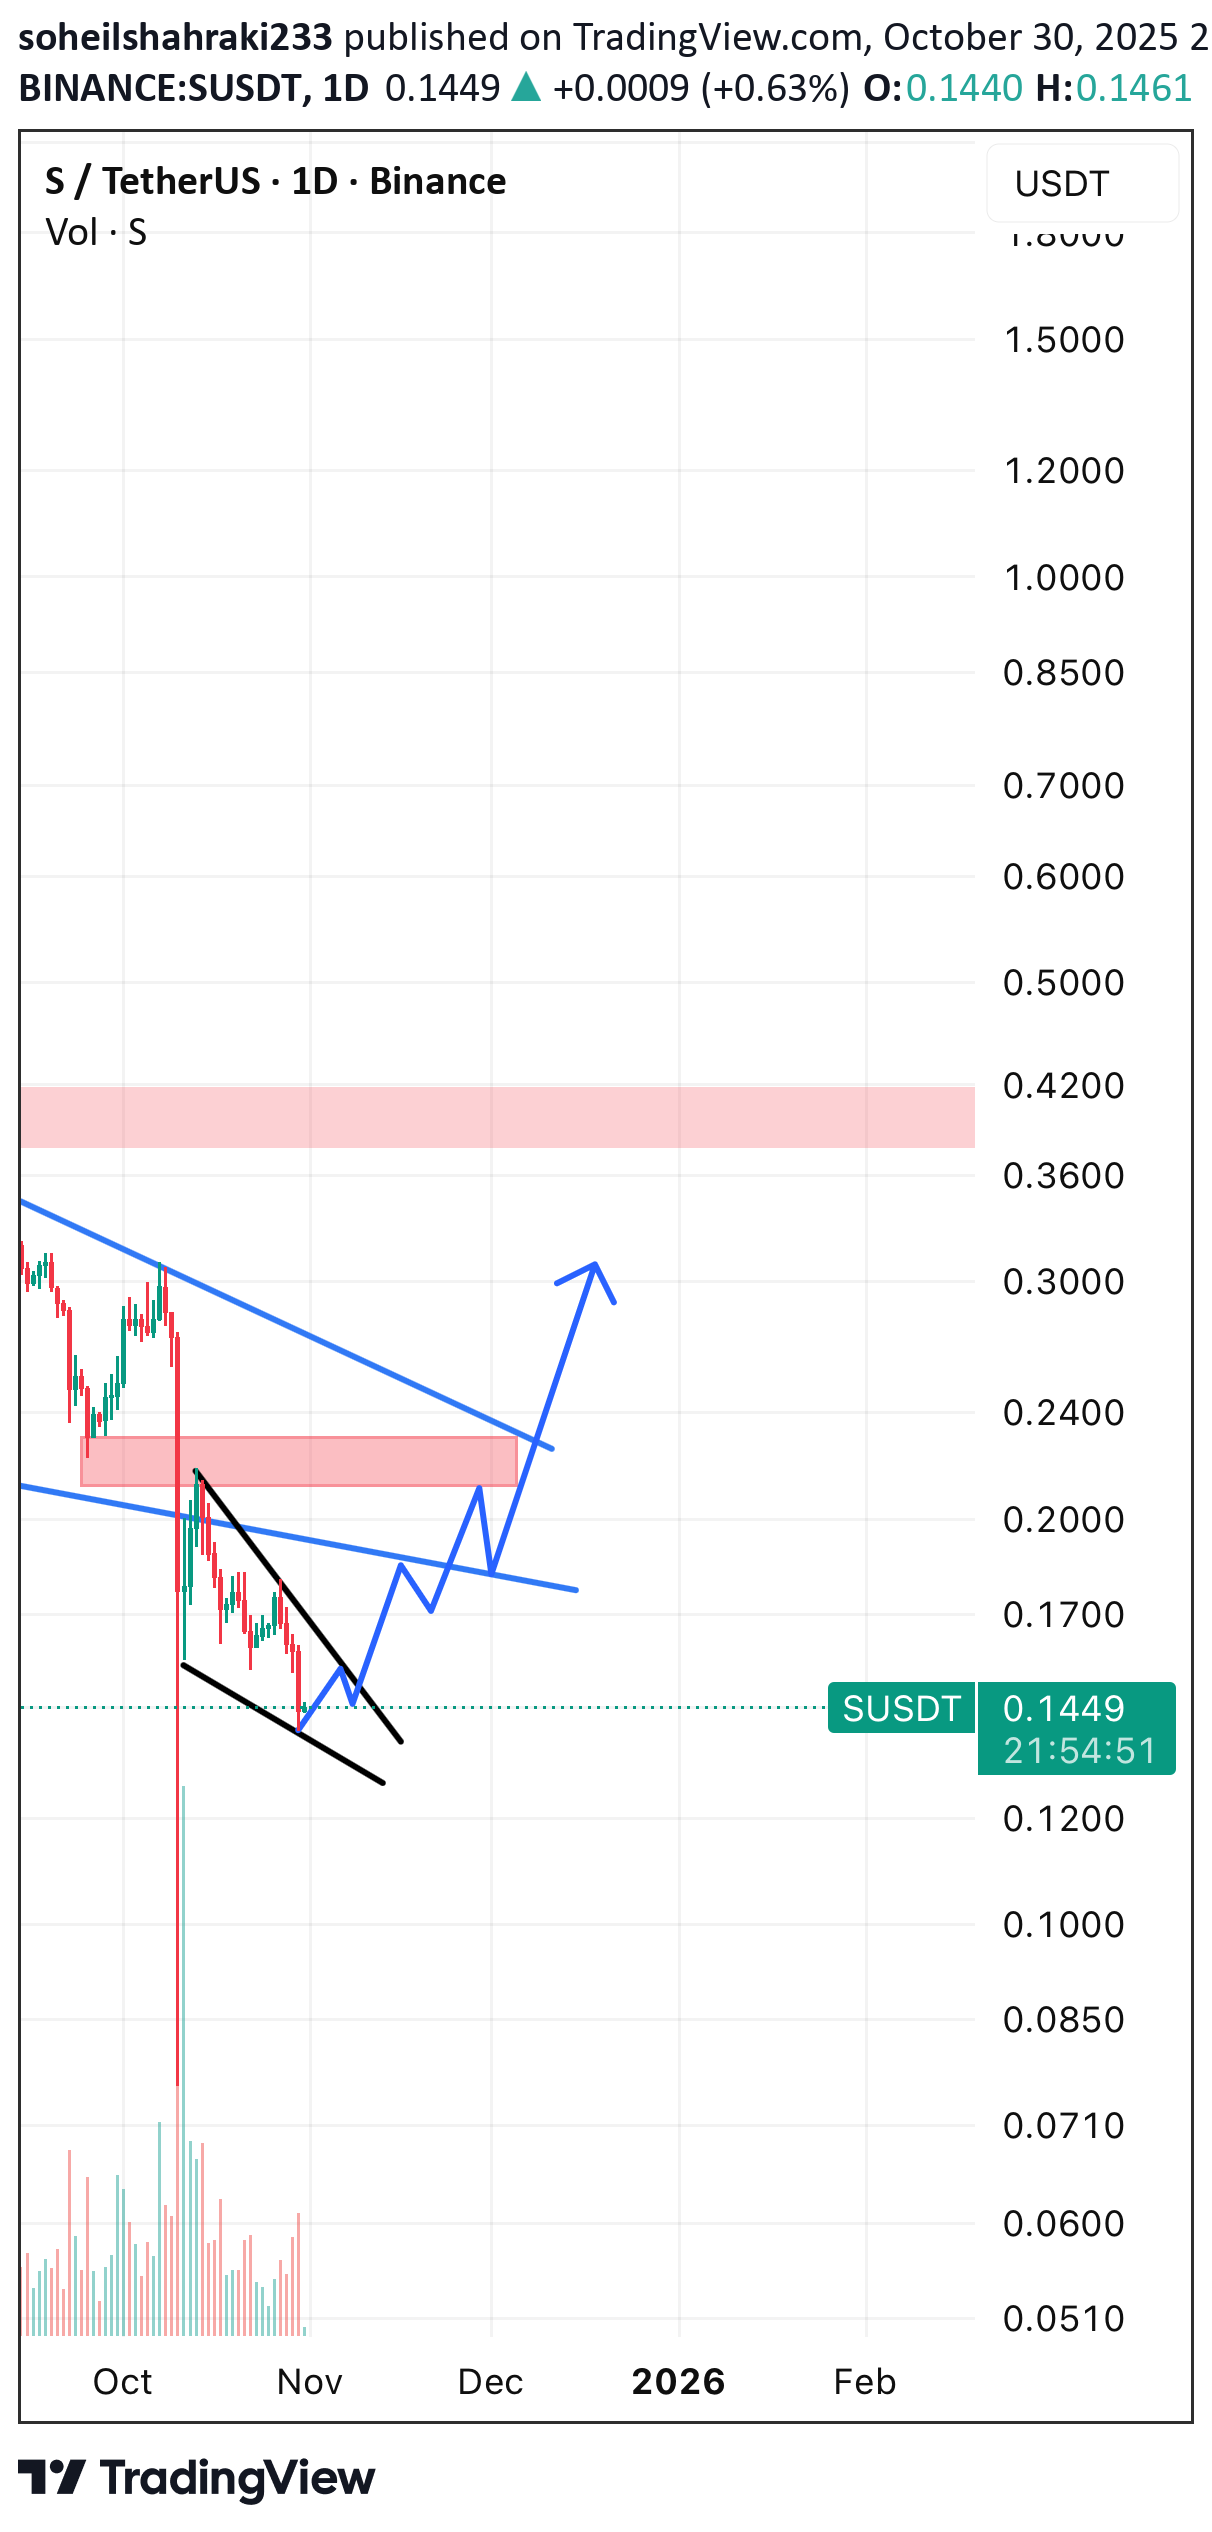
آیا توکن سونیک از حمایت کلیدی $0.14 میجهد؟ شانس صعود تا $0.21 چقدر است؟
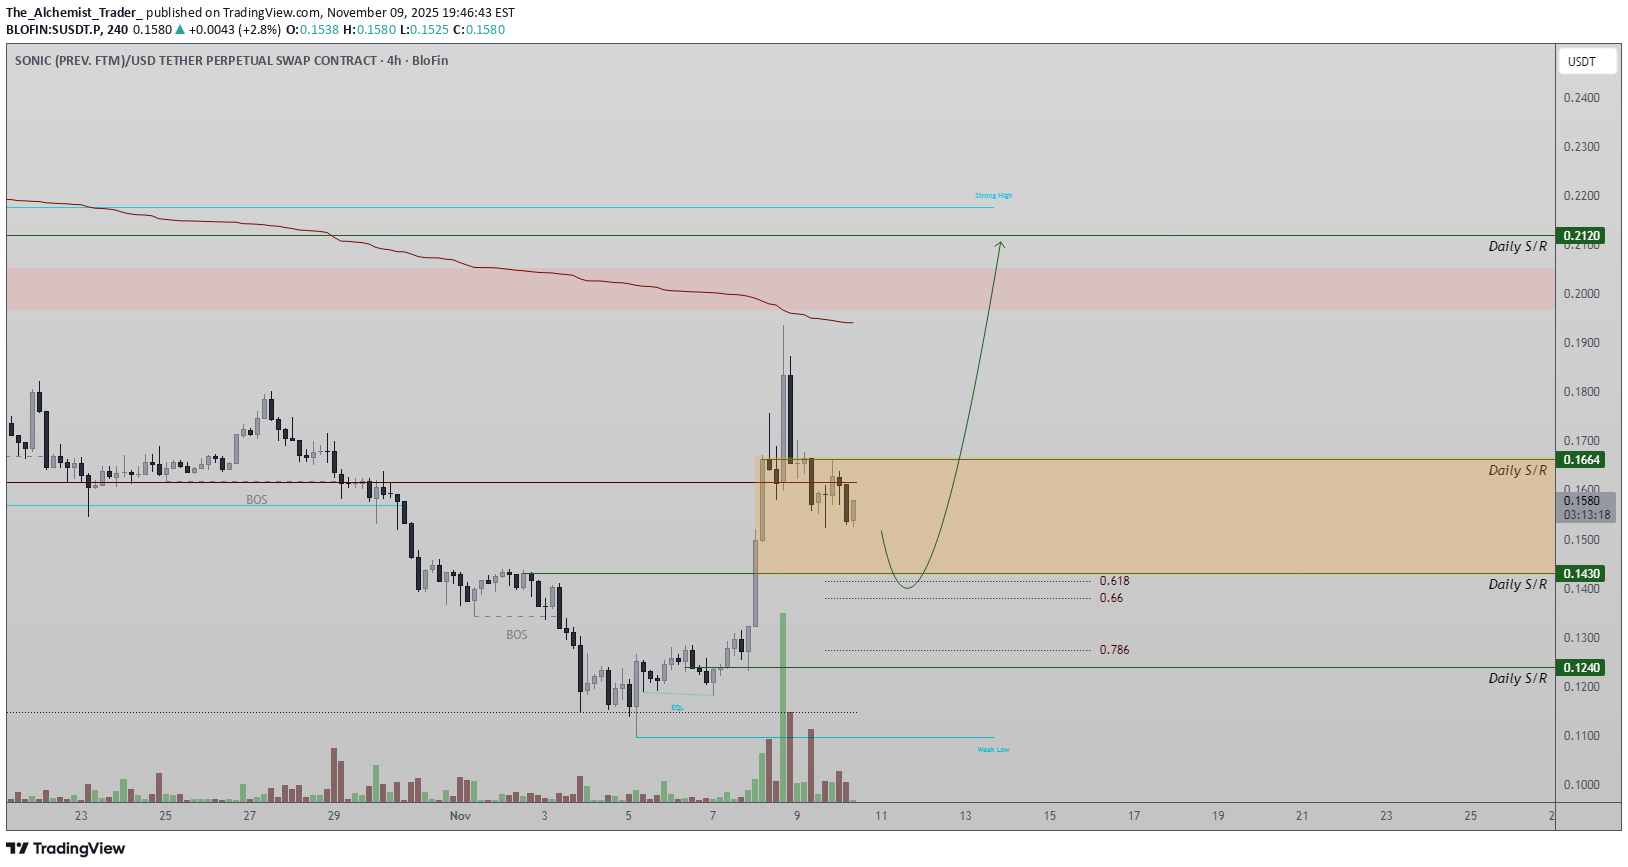
Sonic Token recently staged an impulsive rally after establishing solid support around the $0.12 mark, but momentum stalled as price front-ran resistance and corrected back below the Point of Control (POC). It’s now testing the daily support region near $0.14, which will determine whether bullish continuation can resume. - Support Zone: The $0.14 daily level is the next critical support to hold for momentum recovery. -Upside Target: Maintaining support could trigger an impulsive rally toward $0.21, the next major resistance. If Sonic Token holds above $0.14 and volume begins to build, a rotation toward higher time-frame resistance at $0.21 becomes probable. Failure to defend this level, however, would risk extending the correction toward prior support zones. Sonic Token remains technically poised for continuation, but confirmation through volume and structure is key to sustaining upside momentum.

Alpha-GoldFX
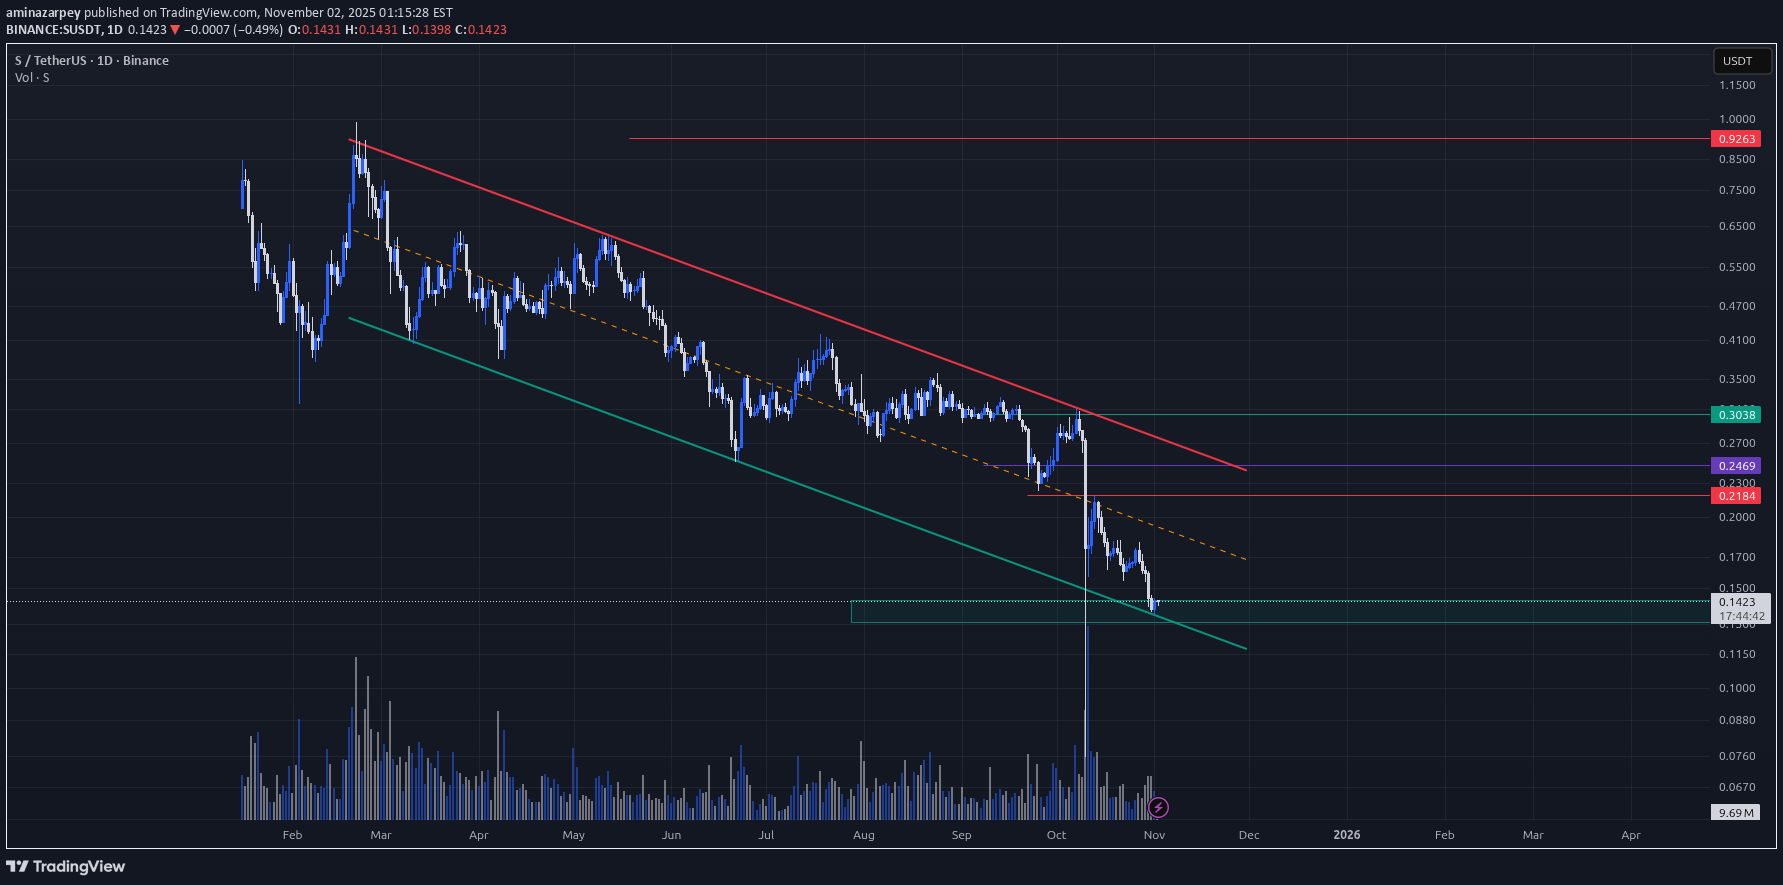
الگوی گُوِه نزولی SUSDT: آیا انفجار قیمتی 200 درصدی در راه است؟
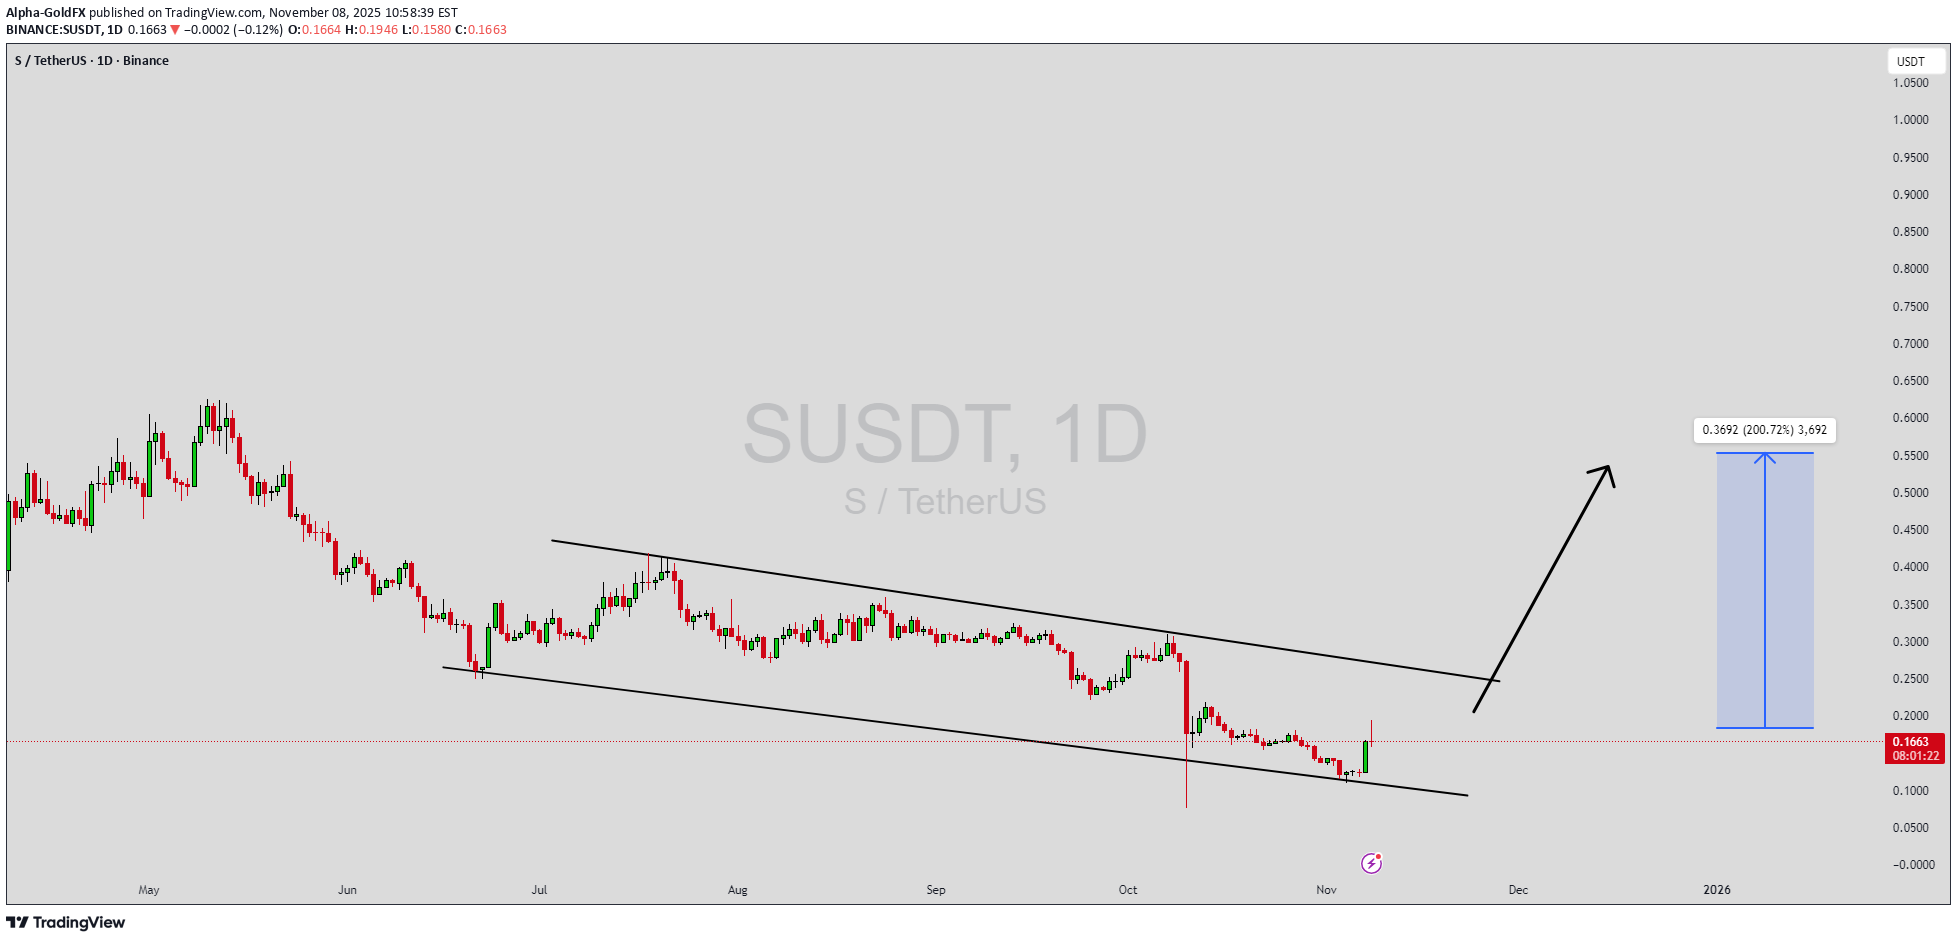
SUSDT is forming a clear falling wedge pattern, a classic bullish reversal signal that often indicates an upcoming breakout in crypto trading pairs like this one. The price has been consolidating within a narrowing range after recent dips to the multi-year support zone around $0.14-$0.16, suggesting that selling pressure is weakening while buyers are beginning to regain control near key levels like $0.1629. With good volume confirming accumulation at these lower levels amid surging trading activity up 2147% in recent sessions and whale purchases, the setup hints at a potential bullish breakout soon, especially as SkyTrade's DeFi stablecoin innovations and BNB Chain integration draw fresh momentum. The projected move could lead to an impressive gain of 190% to 200%+ once the price breaks above the wedge resistance, targeting zones up to $0.43-$0.48 and beyond in this altcoin price action. This falling wedge pattern is typically seen at the end of downtrends or corrective phases, and it represents a potential shift in market sentiment from bearish to bullish for SUSDT. Traders closely watching this crypto pair are noting the strengthening momentum as it nears a breakout zone around $0.18-$0.20, with technical indicators like RSI showing oversold bounces and fib retracement levels holding firm on the 4H and daily charts. The good trading volume adds confidence to this pattern, showing that market participants are positioning early in anticipation of a reversal, particularly with recent 3.94% surges and sustained whale accumulation signaling ecosystem growth. Investors’ growing interest in SUSDT reflects rising confidence in the project’s long-term fundamentals, including its stablecoin utility for DeFi, cross-chain bridging, and PancakeSwap liquidity, alongside current technical strength in this falling wedge setup. As of November 2025, trading volume spikes to $1.4M+ and community hype underscore real demand, making this a high-conviction opportunity for those hunting bullish reversal patterns in altcoins. If the breakout confirms with sustained volume, this could mark the start of a fresh bullish leg, with projections eyeing $0.40+ for substantial medium-term gains as buying momentum accelerates in the broader crypto recovery. ✅ Show your support by hitting the like button and ✅ Leaving a comment below! (What is You opinion about this Coin) Your feedback and engagement keep me inspired to share more insightful market analysis with you!

بهترین زمان خرید ارز دیجیتال صعودی: استراتژی معامله بر اساس EMA20 و RSI
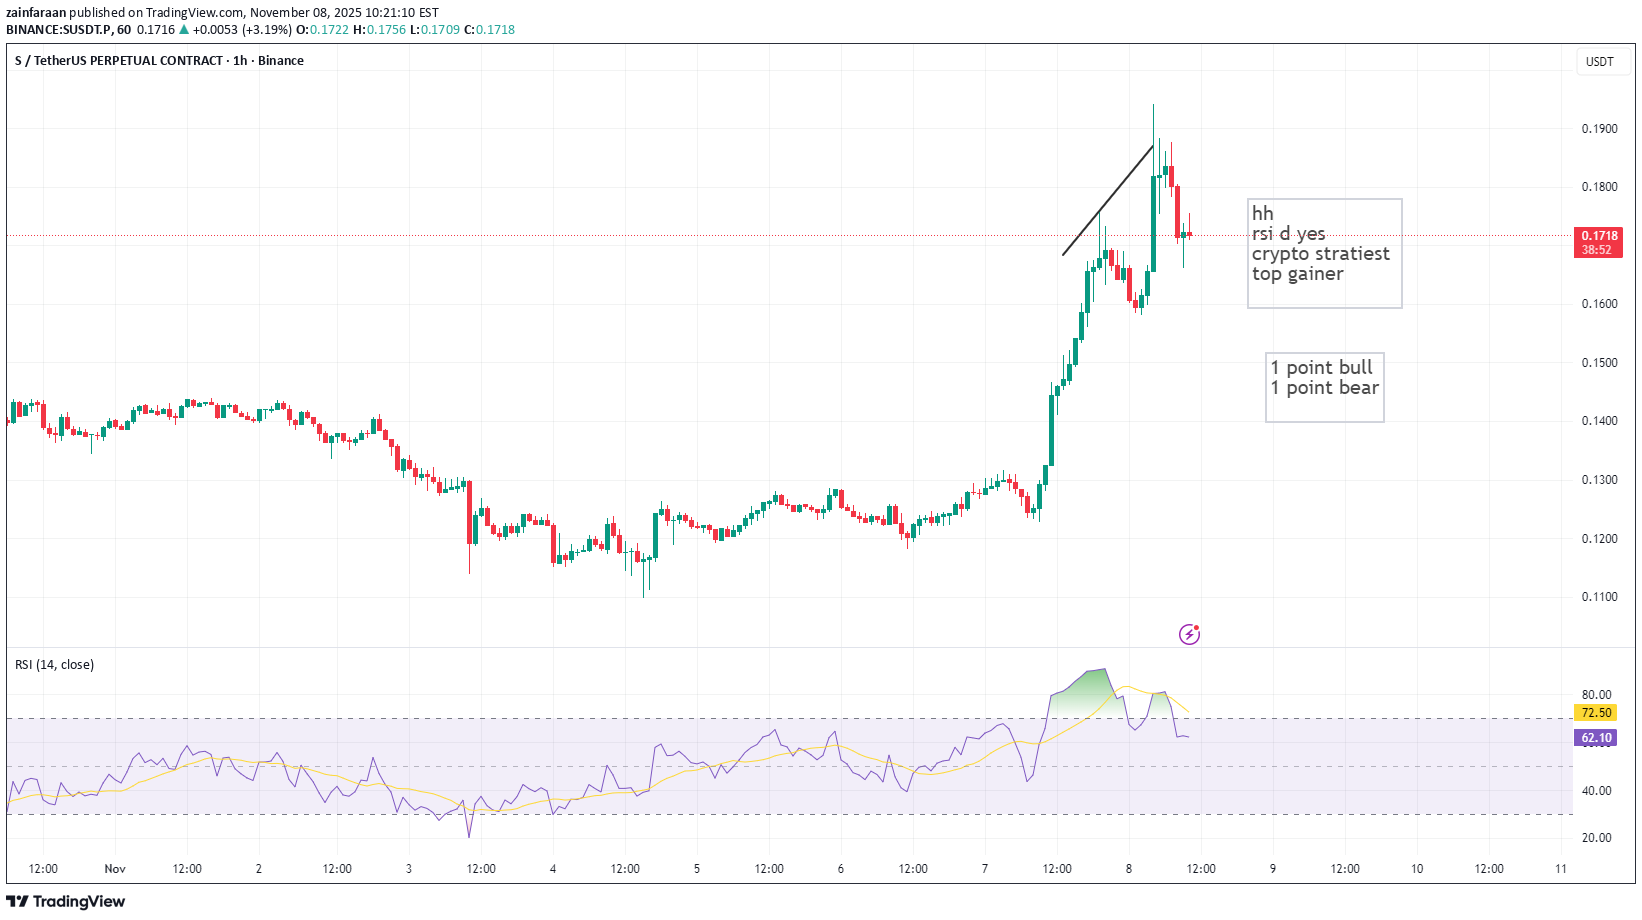
compleat higher high now higher low Ideal Trading Plan StepActionDetails 1Wait for EMA20 retestEntry near 0.160–0.165 (EMA20 zone) after pullback 2Watch RSIIf RSI stays above 50 during retest → confirms trend health 3Confirm candleLook for strong bullish candle off EMA20 4Enter longOnce new HH candle closes above 0.175 5Exit planUse ATR trailing stop or first Lower Low 6Avoid chasingDon’t buy now (after large candle) — wait for dip confirmation Summary Verdict ✅ Trend: Strong ✅ ADX: Powerful (52) ✅ RSI: Strong but extended ⚠️ RSI divergence forming — expect short pullback ➡️ Best move: Wait for EMA20 retest → buy continuation breakout.

behdark
تحلیل هفتگی ارز دیجیتال: موج اصلاحی بزرگ S آغاز شد (پیشبینی قیمت و زمانبندی)
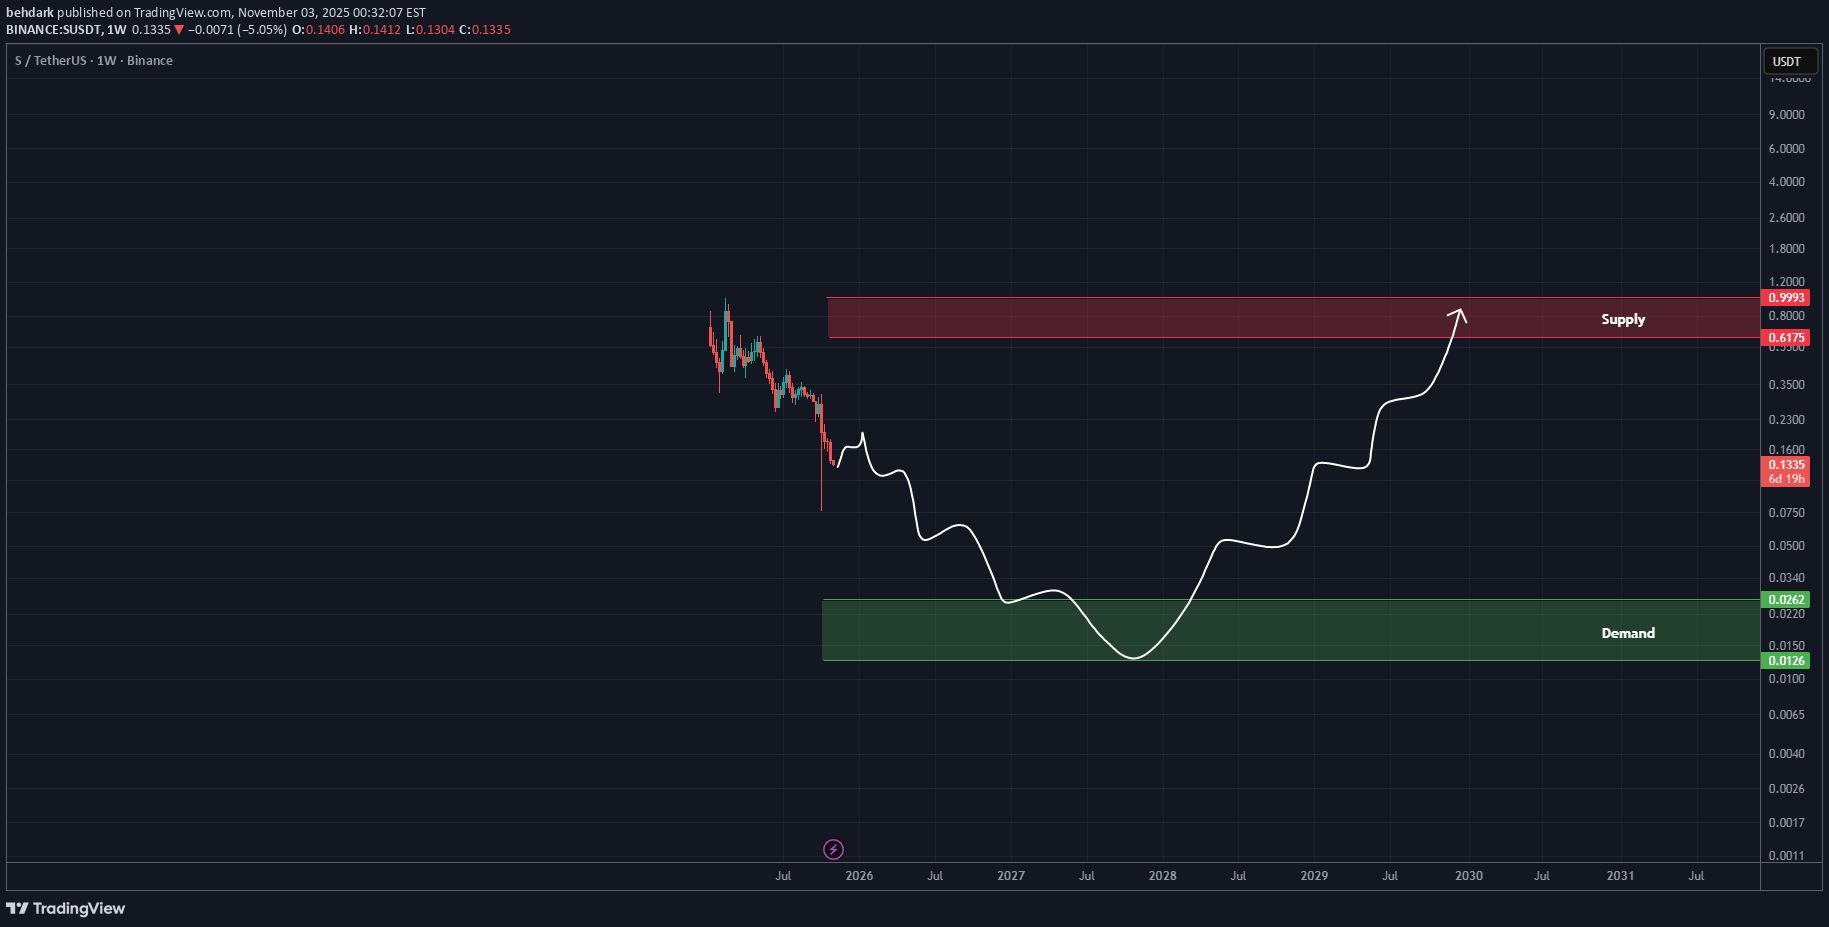
Based on the complete data of this coin | which is not fully available in this chart — From the point where we placed the red arrow on the chart, the major corrective wave S has begun. It appears that an ABC pattern has formed on the weekly timeframe, where wave B was a completed diametric structure. We are now in the large C wave, which is expected to be a long and time-consuming move both in price and duration, likely to complete within the green zone. This is our outlook on S. For risk management, please don't forget stop loss and capital management When we reach the first target, save some profit and then change the stop to entry Comment if you have any questions Thank You

سونیک (Sonic) در آستانه انفجار قیمتی؟ زمان ورود به این ارز فرا رسیده است!
I think Sonic (S/USDT) is currently sitting at a potential buy zone. The price has reached a strong support area inside a descending channel. If Bitcoin and Ethereum start their upward movement and break above $124,000 and $5,000 respectively, Sonic could deliver a strong gain, since it has been lagging behind the market for quite some time.

الگوی صعودی و واگرایی قیمت: راز پنهان قیمتهای بلندمدت (Long Susdt)
A bullish wedge pattern has formed and there is a price divergenve

famatake
Cryptocurrency سونیک s is below 0.165 dollars, this is the bitcoin shock that entered, altcoins are a good place to correct the step purchase Unfortunately, Tether has not reached below 105,000 at the moment Hey, the purchase has come down better just hold Registration and verification link in Aban Teter https://abantether.com/register?code=Z2UL Exchange registration link http://tabdeal.org/auth/register-req?ref=1dsryv Albank valid foreign exchange registration link https://www.lbank.com/fa/login/?icode=HXLN

MadWhale
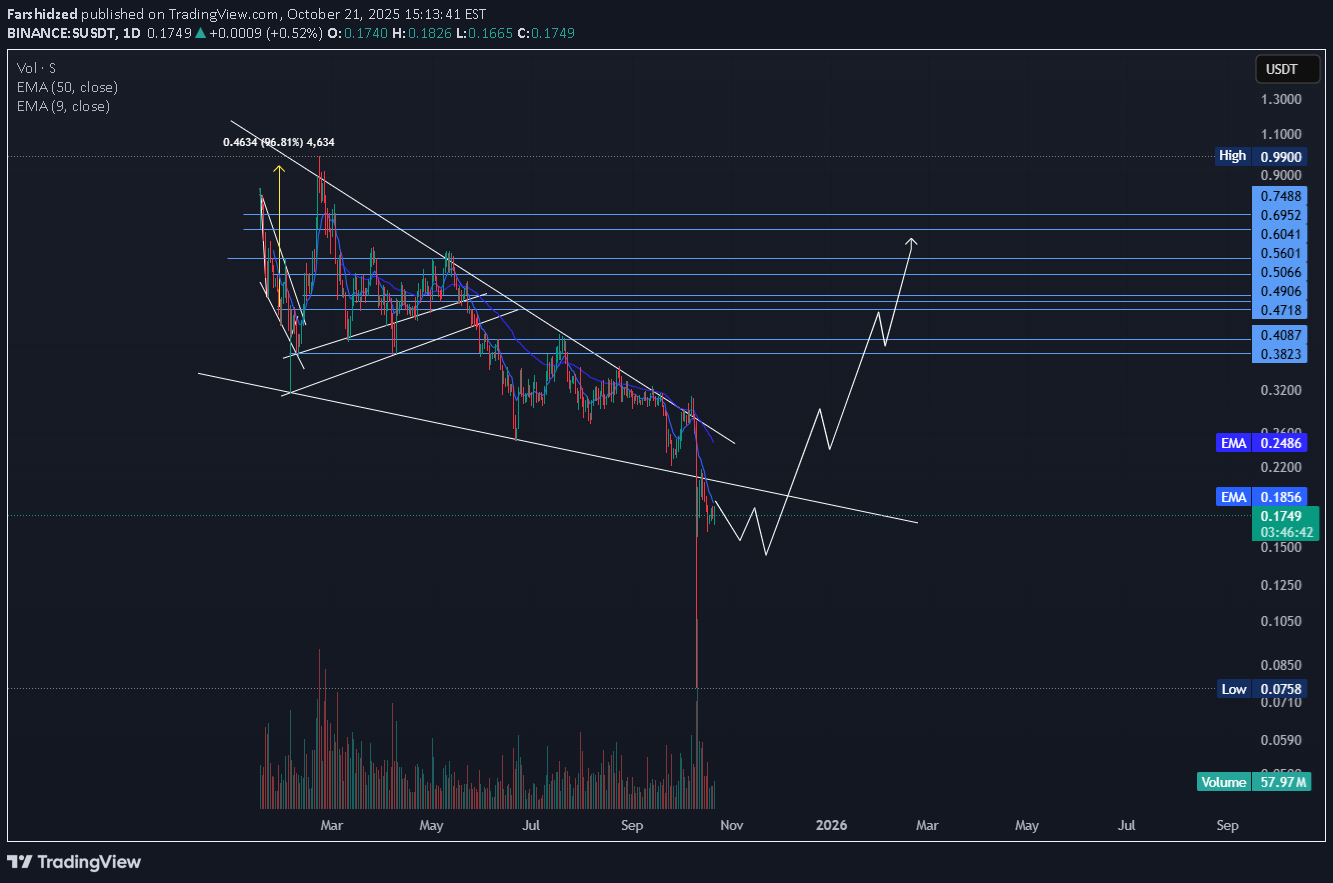
سقف قیمت جدید شیبا: آیا پتانسیل رشد 31 درصدی تا 0.21 دلار محقق میشود؟
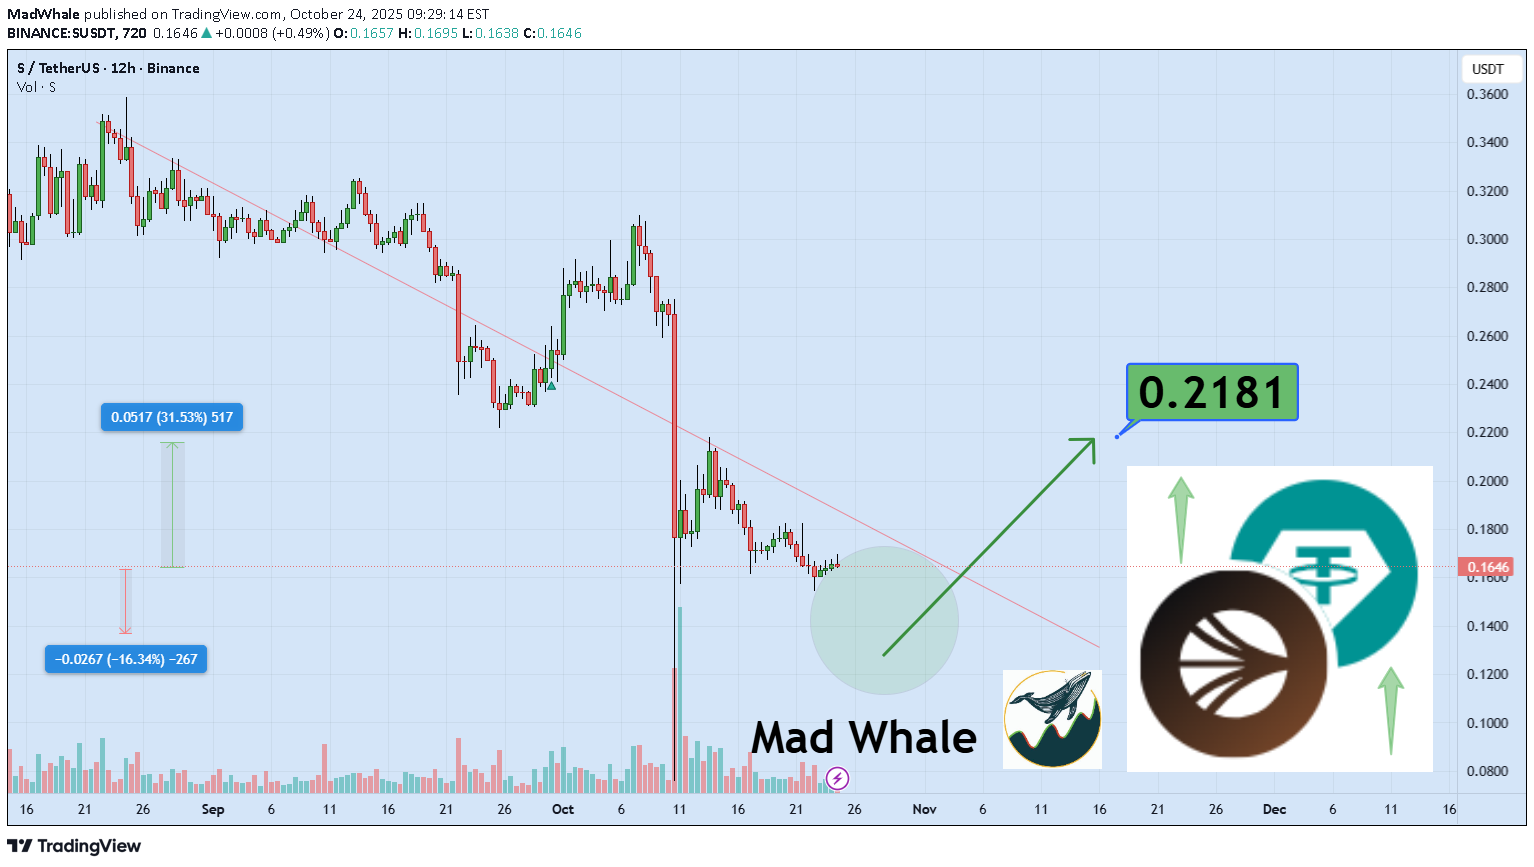
Hi the support and resistances on the chart are based on the previous data and weekly candlesticks if SUSDT holds this last support the potential of 31% gain is logical toward 0.21$

Farshidzed
سریعترین راه برای رشد انفجاری سونیک: ۳ مقاومت کلیدی و شانس بزرگ ADA!
Disclaimer
Any content and materials included in Sahmeto's website and official communication channels are a compilation of personal opinions and analyses and are not binding. They do not constitute any recommendation for buying, selling, entering or exiting the stock market and cryptocurrency market. Also, all news and analyses included in the website and channels are merely republished information from official and unofficial domestic and foreign sources, and it is obvious that users of the said content are responsible for following up and ensuring the authenticity and accuracy of the materials. Therefore, while disclaiming responsibility, it is declared that the responsibility for any decision-making, action, and potential profit and loss in the capital market and cryptocurrency market lies with the trader.