
PYTH
Pyth Network
| تریدر | نوع سیگنال | حد سود/ضرر | زمان انتشار | مشاهده پیام |
|---|---|---|---|---|
 Mike-BTDRank: 31993 | خرید | حد سود: تعیین نشده حد ضرر: تعیین نشده | 12/9/2025 |
Price Chart of Pyth Network
سود 3 Months :
سیگنالهای Pyth Network
Filter
Sort messages by
Trader Type
Time Frame
Mike-BTD
لحظه حساس بیتکوین: خیزش یا سقوط؟ تحلیل نمودار PYTH
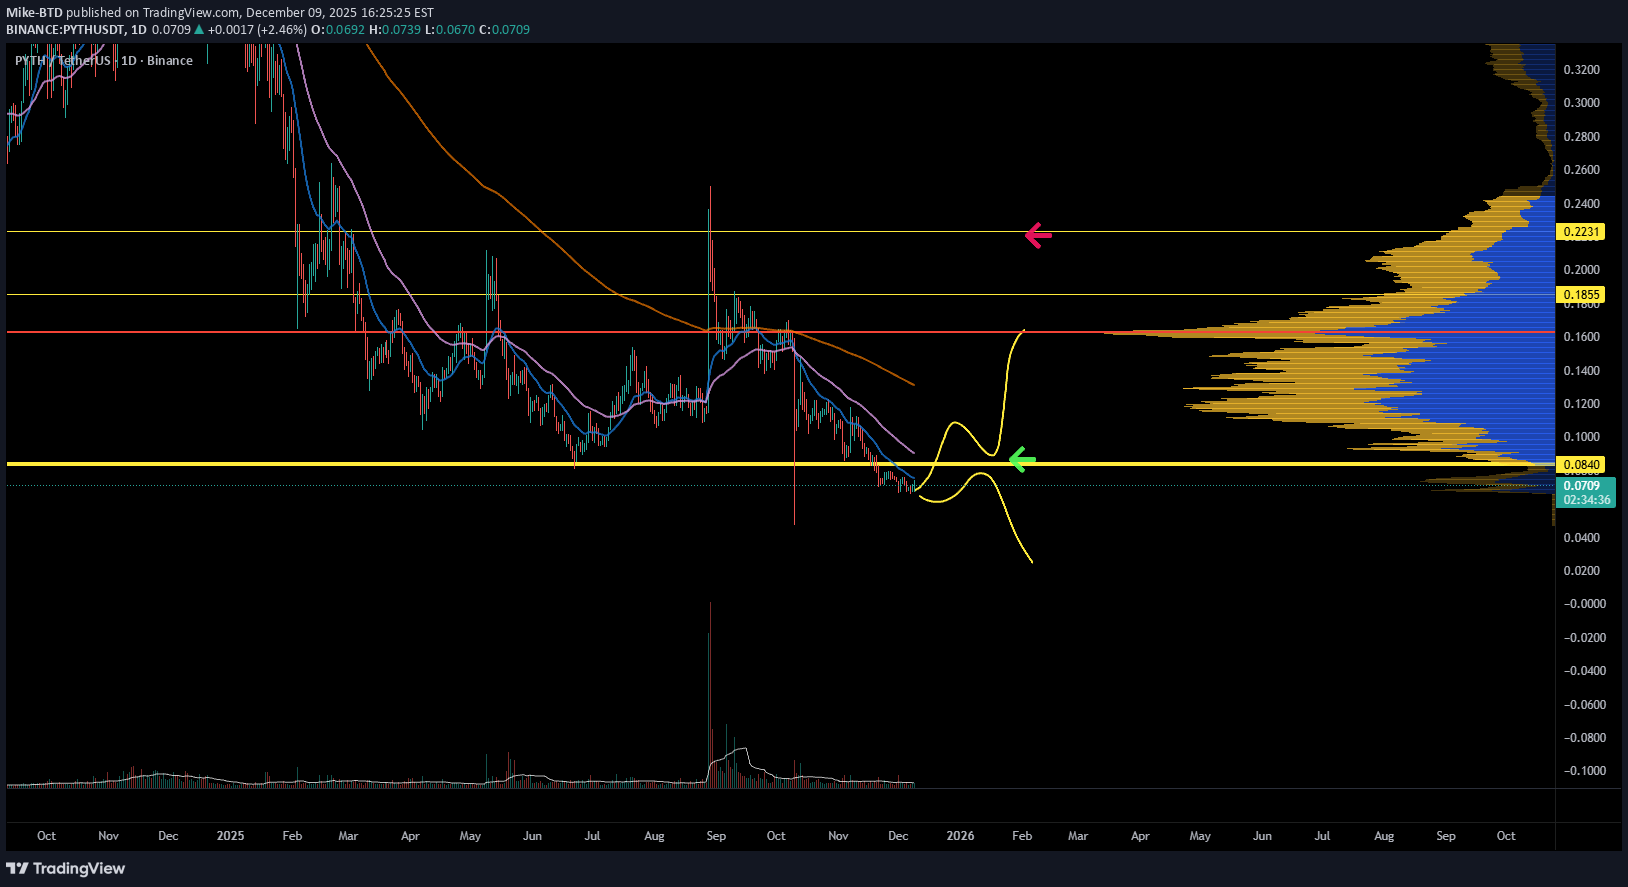
PYTH is sitting on a major demand zone, and momentum is finally showing bullish divergence. Sellers look exhausted, and the volume profile above is thin — meaning any reclaim of this level could trigger a sharp relief move. Hold this zone and PYTH has room to bounce. Lose it and the chart hunts lower liquidity. Key moment for PYTH. What’s your read?

Bithereum_io
تحلیل رمز ارز PYTH: خرید در حمایت و اهداف صعودی جذاب (تایم فریم 12 ساعته)
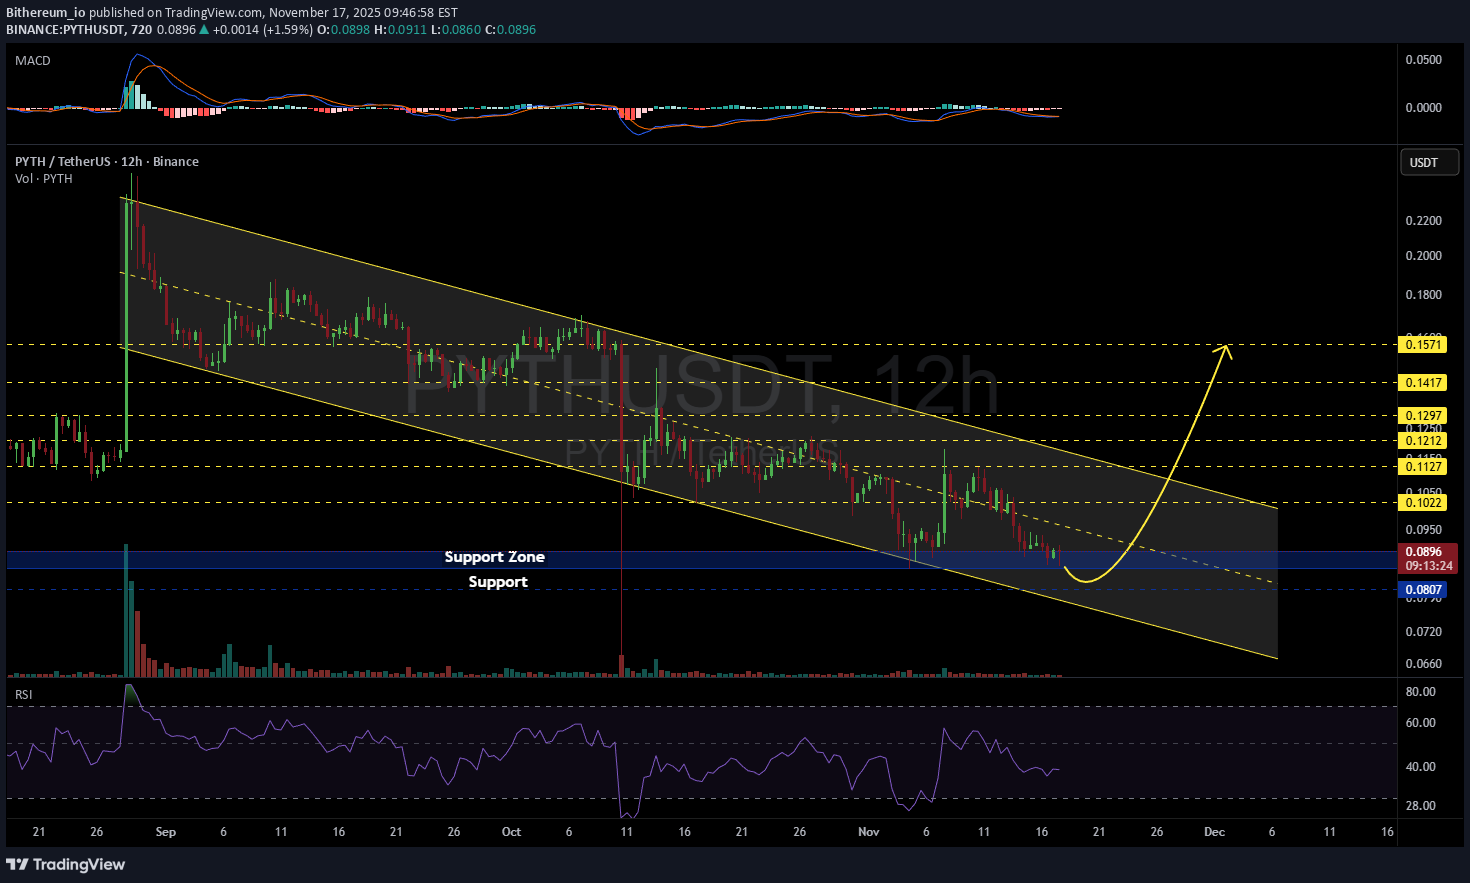
#PYTH is moving inside a descending channel on the 12H timeframe. It is currently sitting on the support zone. Consider buying a small bag here and another near the $0.0807 support level in case of a deeper dip. If we get a successful bounce, the short-term target is: 🎯 $0.1022 And if the price breaks out above the channel, the potential upside targets are: 🎯 $0.1127 🎯 $0.1212 🎯 $0.1297 🎯 $0.1417 🎯 $0.1571 ⚠️ Always remember to use a tight stop-loss and maintain proper risk management.

CryptoNuclear
PYTH/USDT: آخرین دفاع قبل از انفجار بزرگ؟ (صعود یا سقوط قطعی)
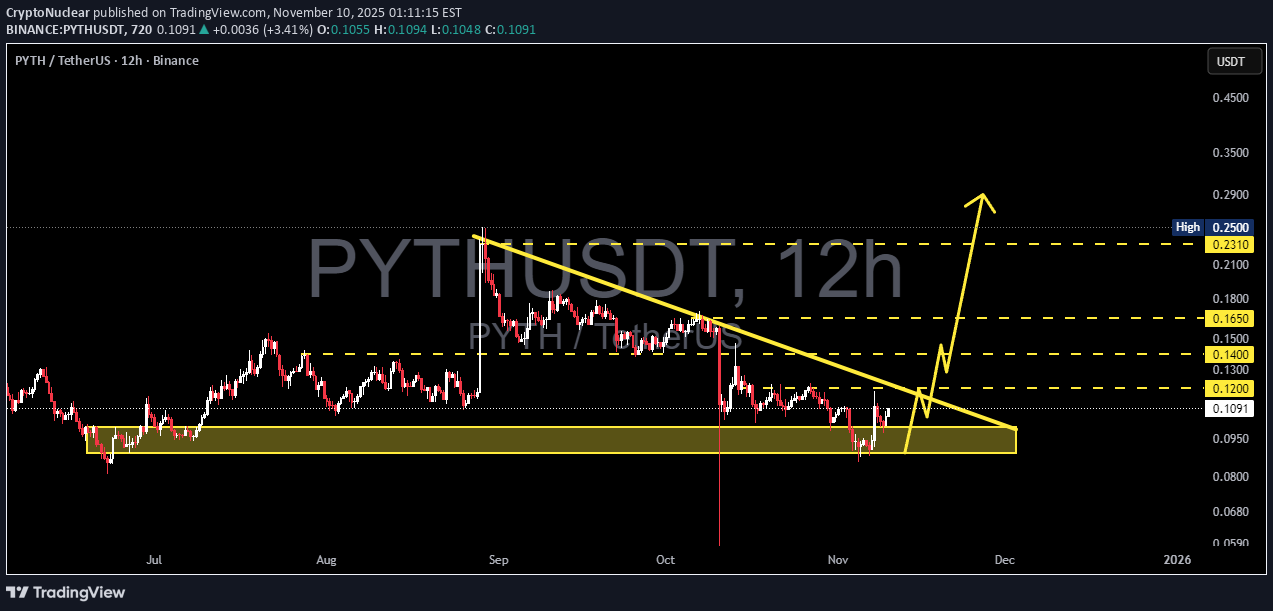
PYTH is now trading at a critical turning point, hovering right above the major demand zone at 0.100–0.089 USDT (yellow block). This area has acted as a strong defensive wall for buyers several times in the past. However, persistent lower highs under the descending trendline are showing strong selling pressure, forming a descending triangle pattern — a classic sign of market compression before a major move. As volume gradually declines, the chart suggests that energy is building up for a breakout or breakdown. The next move from this structure will likely define PYTH’s direction for the next few weeks. --- 🟢 Bullish Scenario Key condition: Breakout and 12H candle close above the descending trendline and 0.120 USDT, ideally with strong volume confirmation. Once confirmed, PYTH could start reversing its structure with the following upside targets: 🎯 Target 1: 0.140 (nearest resistance) 🎯 Target 2: 0.165 (previous supply zone) 🎯 Target 3: 0.231–0.250 (major resistance / previous high) As long as price holds above 0.100, the structure remains valid for a potential bullish reversal. Suggested stop-loss: below 0.095 (or based on personal risk tolerance). 💬 “A breakout above the trendline could be the first signal of a major reversal. Volume confirmation is key.” --- 🔴 Bearish Scenario If the price fails to break above the trendline and instead closes below 0.089 USDT, bearish momentum could accelerate sharply. A confirmed breakdown below this demand area might trigger a stop-loss cascade or panic selling, targeting: ⚠️ Target 1: 0.070 ⚠️ Target 2: 0.050 This zone represents the last stand for the bulls — losing it could shift the market into a new bearish phase. 💬 “If 0.089 breaks, strong support becomes a dangerous resistance.” --- ⚙️ Technical Summary Pattern: Descending Triangle Strong Support Zone: 0.100–0.089 Bullish Trigger: 12H close above 0.120 Bearish Trigger: 12H close below 0.089 Market Condition: Price compression under pressure — a large directional move is likely approaching. --- 💡 Trader Insight > “The longer price stays compressed under pressure, the stronger the breakout potential becomes. Direction is uncertain — but the storm is near.” #PYTH #PYTHUSDT #Crypto #TechnicalAnalysis #DescendingTriangle #Breakout #SupportResistance #CryptoChart #PriceAction #AltcoinSetup

تحلیل پایت کوین (PYTH) امروز: آیا قیمت بالای ۰.۱۱۸ تثبیت میشود و رالی ادامه مییابد؟

if today 20 oct 2025 daily close we can stand the price above 0.118 , possibly we can continue rally up

tradecitypro
تحلیل PYTH: آیا بزرگترین سقوط بازار در راه است؟ استراتژی خرید پس از ریزش سنگین!

👋 Welcome to TradeCityPro Channel! 🌐 Overview of Bitcoin Before we begin, let me remind you that we’ve moved the Bitcoin analysis section to a separate daily report at your request, so we can go into more detail about Bitcoin’s condition, price action, and dominance: 🌙 Last night, the crypto market witnessed a massive liquidation of nearly $19 billion, marking one of the biggest crashes in the history of digital assets. 📈 At this point, trading or buying in these zones isn’t logical it’s better to stay out of the market for a few days, watch the price action, and let volatility settle before making any moves. 🔥 Weekly Time Frame After a 92% drop from its all-time high, PYTH is currently consolidating below the resistance level at $0.1851. This area is crucial it’s acting as both a psychological and technical barrier where the next trend direction will be defined. 🟢 Spot & Long Entry Setup ⛏ If this weekly candle turns green and we see confirmation, that could become one of the best bullish triggers for accumulation. However, the main confirmation will be the breakout above $0.1851, which would give us a solid long entry setup. ✍️ Personally, I’m planning to open a long futures position once $0.1851 breaks, and if we later break above $0.2532, I’ll use my futures profits to buy PYTH in spot and hold for a potential longer-term recovery. 📝 Final Thoughts Stay calm, trade wisely, and let's capture the market's best opportunities! This analysis reflects our opinions and is not financial advice. Share your thoughts in the comments, and don’t forget to share this analysis with your friends! ❤️

SwingSamurai_QMA
تحلیل PYTH: آماده جهش بزرگ یا اصلاح قیمتی؟ سطوح کلیدی ورود و خروج!

Is PYTH breaking out for a strong move up or gearing for a correction? This analysis identifies key levels to watch for high-probability entries and exits. Price Levels to Watch: Resistance Zone: $0.44–$0.50 (major supply area) Intermediate Resistance: $0.1870 Current Price Support: $0.1445 Support Zone: $0.1137 Scenarios: 🔵 Bullish: Break and hold above $0.1870 could trigger a move to $0.44+. Possible gains over 100%! 🔴 Bearish: Failure to hold $0.1445 support may lead to retest of $0.0860 region. Why This Setup? Clear supply/demand zones highlight significant trader interest. Weekly timeframe support/resistance for swing trading opportunities. Focus on patient, disciplined entries with risk management

InnerCircleIDN
PYTH long by fundamental is good news
1. Widespread adoption of DeFi & CeFi → more DEXs, CEXs, and financial applications using Pyth price feeds (because they're fast and cheap). Institutions & governments → collaboration with large institutions (e.g., the US Department of Commerce) increases credibility. 3. Multi-chain expansion → the more blockchain integrations, the greater the demand for data → higher fees for publishers and stakers. 4. Active staking & governance → the PYTH token gains strong utility (staking, fee sharing, voting), driving demand. 5. Global crypto market revival → if the bull market returns, demand for data oracles will increase → Pyth's position as a next-generation oracle will become more prominent. Bottom line: Bullish if Pyth succeeds in becoming the standard oracle for "the price of everything" in on-chain finance.
SwingSamurai_QMA
PYTH/USDT – Bullish Re-Test Setup

Key Level: 0.167 (Previous Support → Now Resistance) Target: 0.18 – 0.185 Timeframe: 4H (240M) ✅ Trade Conditions: Price must reclaim and close above 0.167 on the 4-hour candle. This confirms bullish strength and breaks the previous downtrend. 🎯 Action: Enter on close above 0.167 Stop Loss: Below 0.160 (support breakdown) Take Profit: 0.18 → 0.185 💡 Why? The zone around 0.167 was strong support earlier. If bulls reclaim it with a strong close, it signals momentum shift. The path of least resistance is now toward 0.18, where prior resistance lies. 🔥 Watch for confirmation — no fakeouts. Only trade if the 4H candle closes cleanly above 0.167. #PYTH #CryptoTrading #DayTrading #Breakout #TradingView

Kod101
PYTH USDT 1 H
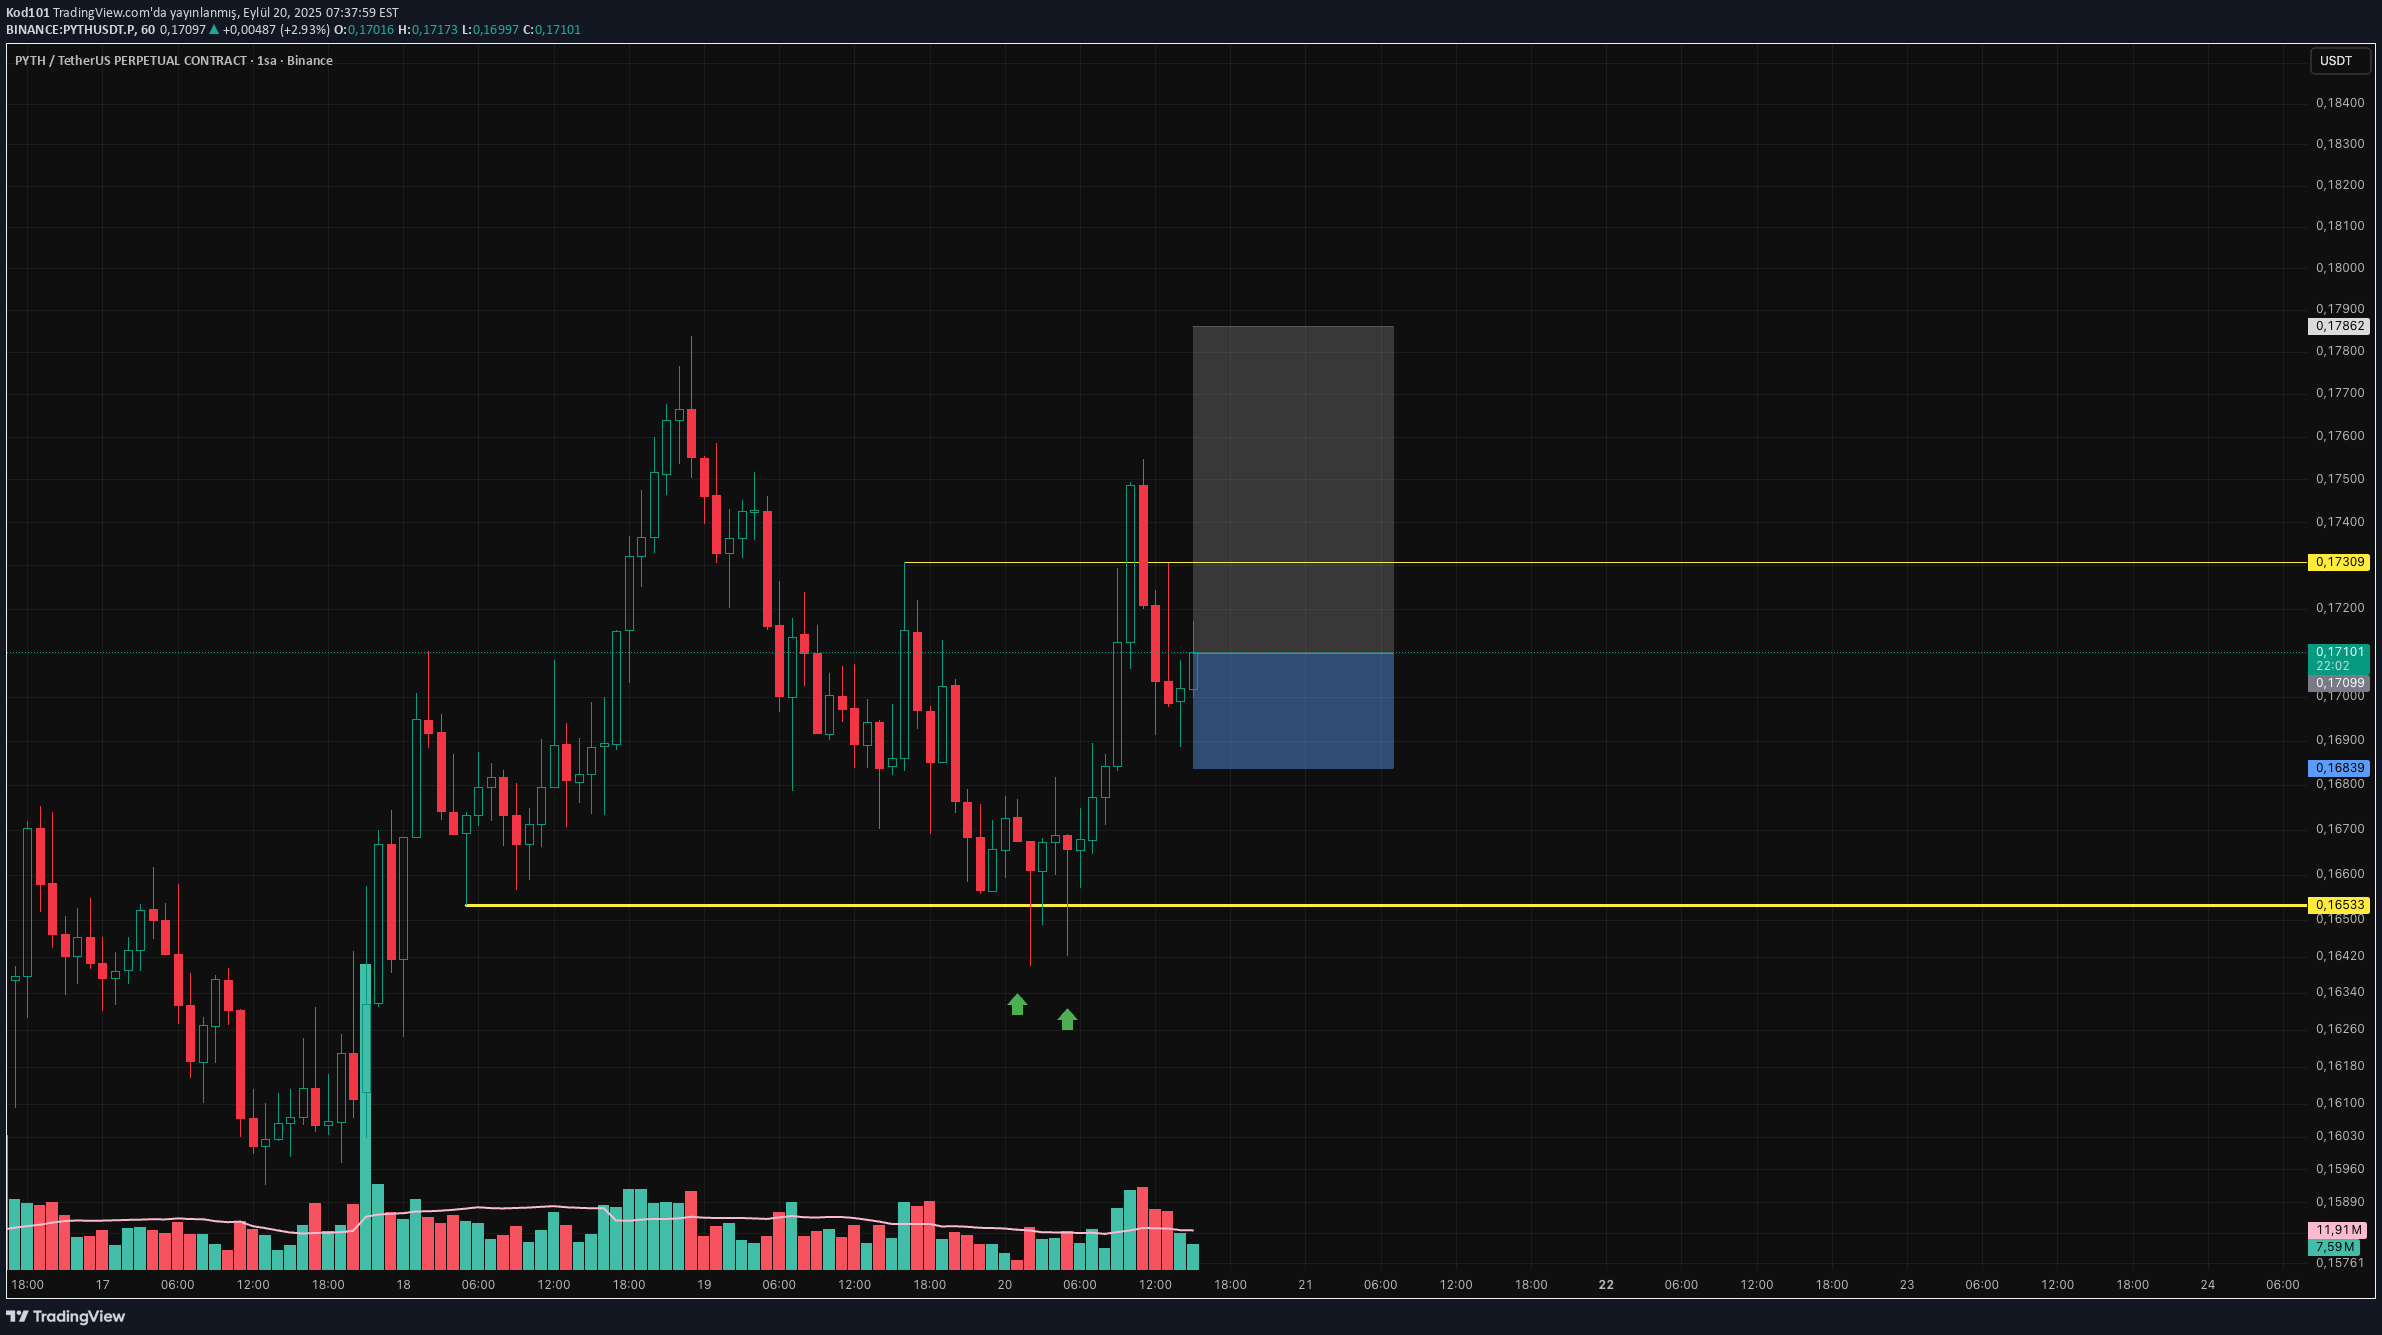
Pyth Long Giriş : 0.17104 SL : 0,16834 TP 1 : 0,17862 RR : 2,93

UmutTrades
ATOMUSDT | Short From Red Box, Long-Term Setup
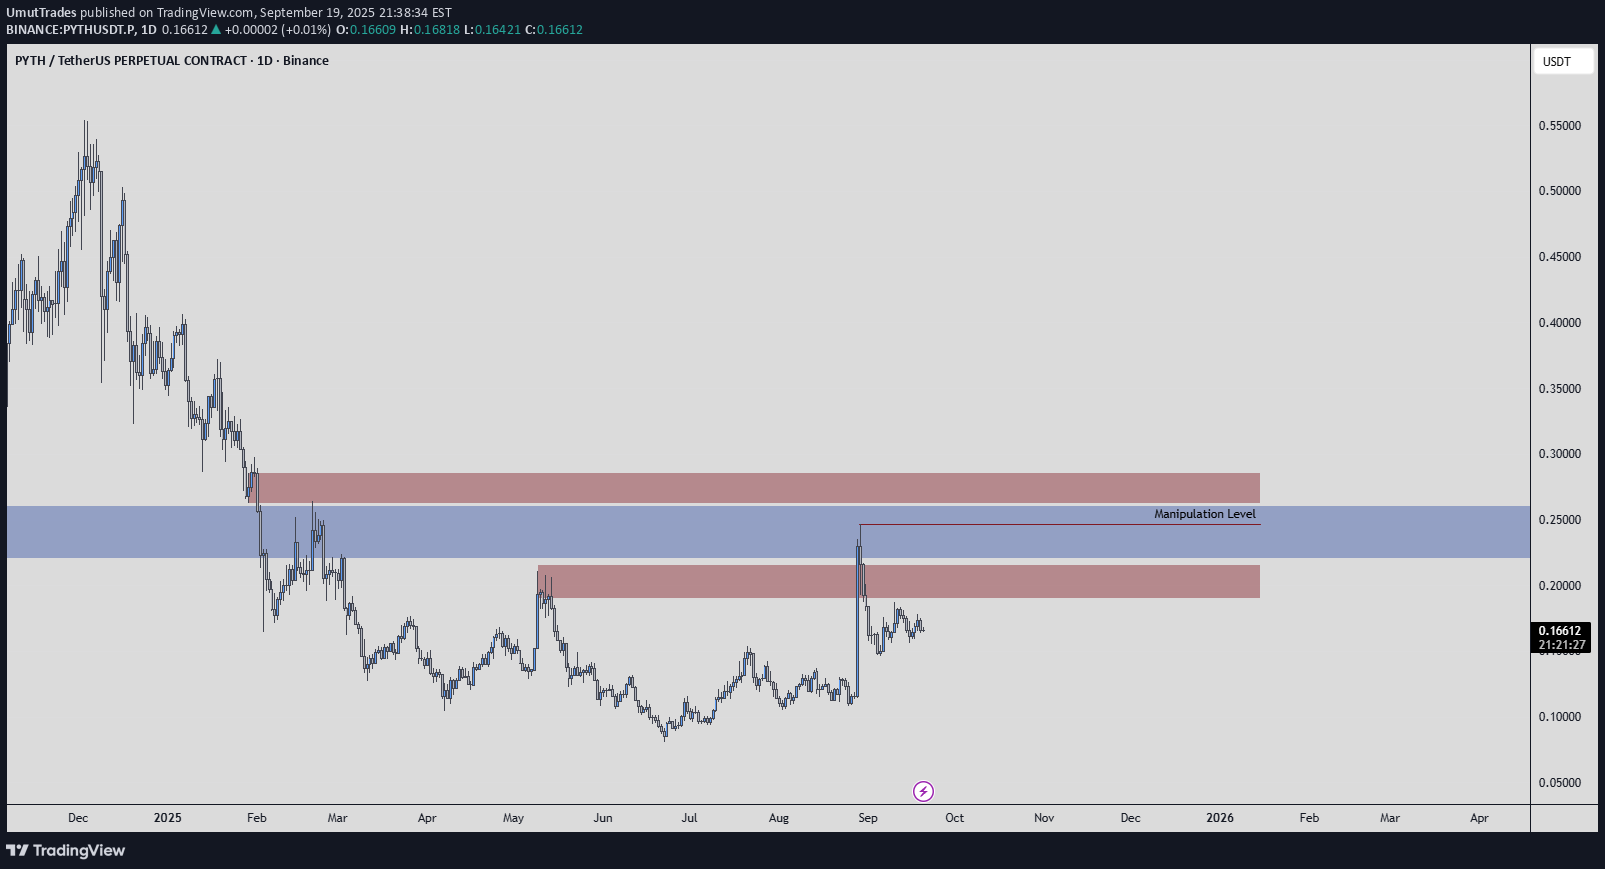
Resistance Zone; ATOMUSDT is facing heavy resistance at the red box, making it an attractive short entry zone. Structure shows sellers remain active here, and momentum hasn’t shifted yet. Risk Management; For risk management, I’m anchoring this setup with a stop at 7.9. That level is key a breakout and retest above it would invalidate the short idea and open the door for bullish continuation. Bias and Conditions; Until then, the bias stays short. CDV is not showing strong buyer commitment, and footprint still reflects selling pressure. As long as those conditions hold, the short idea has weight. Trade Style; This is a long-term play, not a quick scalp. Patience is required. 📌I keep my charts clean and simple because I believe clarity leads to better decisions. 📌My approach is built on years of experience and a solid track record. I don’t claim to know it all but I’m confident in my ability to spot high-probability setups. 📌If you would like to learn how to use the heatmap, cumulative volume delta and volume footprint techniques that I use below to determine very accurate demand regions, you can send me a private message. I help anyone who wants it completely free of charge. 🔑I have a long list of my proven technique below: 🎯 ZENUSDT.P: Patience & Profitability | %230 Reaction from the Sniper Entry 🐶 DOGEUSDT.P: Next Move 🎨 RENDERUSDT.P: Opportunity of the Month 💎 ETHUSDT.P: Where to Retrace 🟢 BNBUSDT.P: Potential Surge 📊 BTC Dominance: Reaction Zone 🌊 WAVESUSDT.P: Demand Zone Potential 🟣 UNIUSDT.P: Long-Term Trade 🔵 XRPUSDT.P: Entry Zones 🔗 LINKUSDT.P: Follow The River 📈 BTCUSDT.P: Two Key Demand Zones 🟩 POLUSDT: Bullish Momentum 🌟 PENDLEUSDT.P: Where Opportunity Meets Precision 🔥 BTCUSDT.P: Liquidation of Highly Leveraged Longs 🌊 SOLUSDT.P: SOL's Dip - Your Opportunity 🐸 1000PEPEUSDT.P: Prime Bounce Zone Unlocked 🚀 ETHUSDT.P: Set to Explode - Don't Miss This Game Changer 🤖 IQUSDT: Smart Plan ⚡️ PONDUSDT: A Trade Not Taken Is Better Than a Losing One 💼 STMXUSDT: 2 Buying Areas 🐢 TURBOUSDT: Buy Zones and Buyer Presence 🌍 ICPUSDT.P: Massive Upside Potential | Check the Trade Update For Seeing Results 🟠 IDEXUSDT: Spot Buy Area | %26 Profit if You Trade with MSB 📌 USUALUSDT: Buyers Are Active + %70 Profit in Total 🌟 FORTHUSDT: Sniper Entry +%26 Reaction 🐳 QKCUSDT: Sniper Entry +%57 Reaction 📊 BTC.D: Retest of Key Area Highly Likely 📊 XNOUSDT %80 Reaction with a Simple Blue Box! 📊 BELUSDT Amazing %120 Reaction! 📊 Simple Red Box, Extraordinary Results 📊 TIAUSDT | Still No Buyers—Maintaining a Bearish Outlook 📊 OGNUSDT | One of Today’s Highest Volume Gainers – +32.44% 📊 TRXUSDT - I Do My Thing Again 📊 FLOKIUSDT - +%100 From Blue Box! 📊 SFP/USDT - Perfect Entry %80 Profit! 📊 [ tradingview.com/chart/AAVEUSDT/RZ4eezbi-AAVEUSDT-Analysis-Retracement-Opportunity/]AAVEUSDT - WE DID IT AGAIN! I stopped adding to the list because it's kinda tiring to add 5-10 charts in every move but you can check my profile and see that it goes on..
Disclaimer
Any content and materials included in Sahmeto's website and official communication channels are a compilation of personal opinions and analyses and are not binding. They do not constitute any recommendation for buying, selling, entering or exiting the stock market and cryptocurrency market. Also, all news and analyses included in the website and channels are merely republished information from official and unofficial domestic and foreign sources, and it is obvious that users of the said content are responsible for following up and ensuring the authenticity and accuracy of the materials. Therefore, while disclaiming responsibility, it is declared that the responsibility for any decision-making, action, and potential profit and loss in the capital market and cryptocurrency market lies with the trader.