
SwingSamurai_QMA
@t_SwingSamurai_QMA

What symbols does the trader recommend buying?
Purchase History
پیام های تریدر
Filter
SwingSamurai_QMA
رالی بزرگ اتر روز: منتظر تایید نهایی در این سطوح حیاتی بمانید!
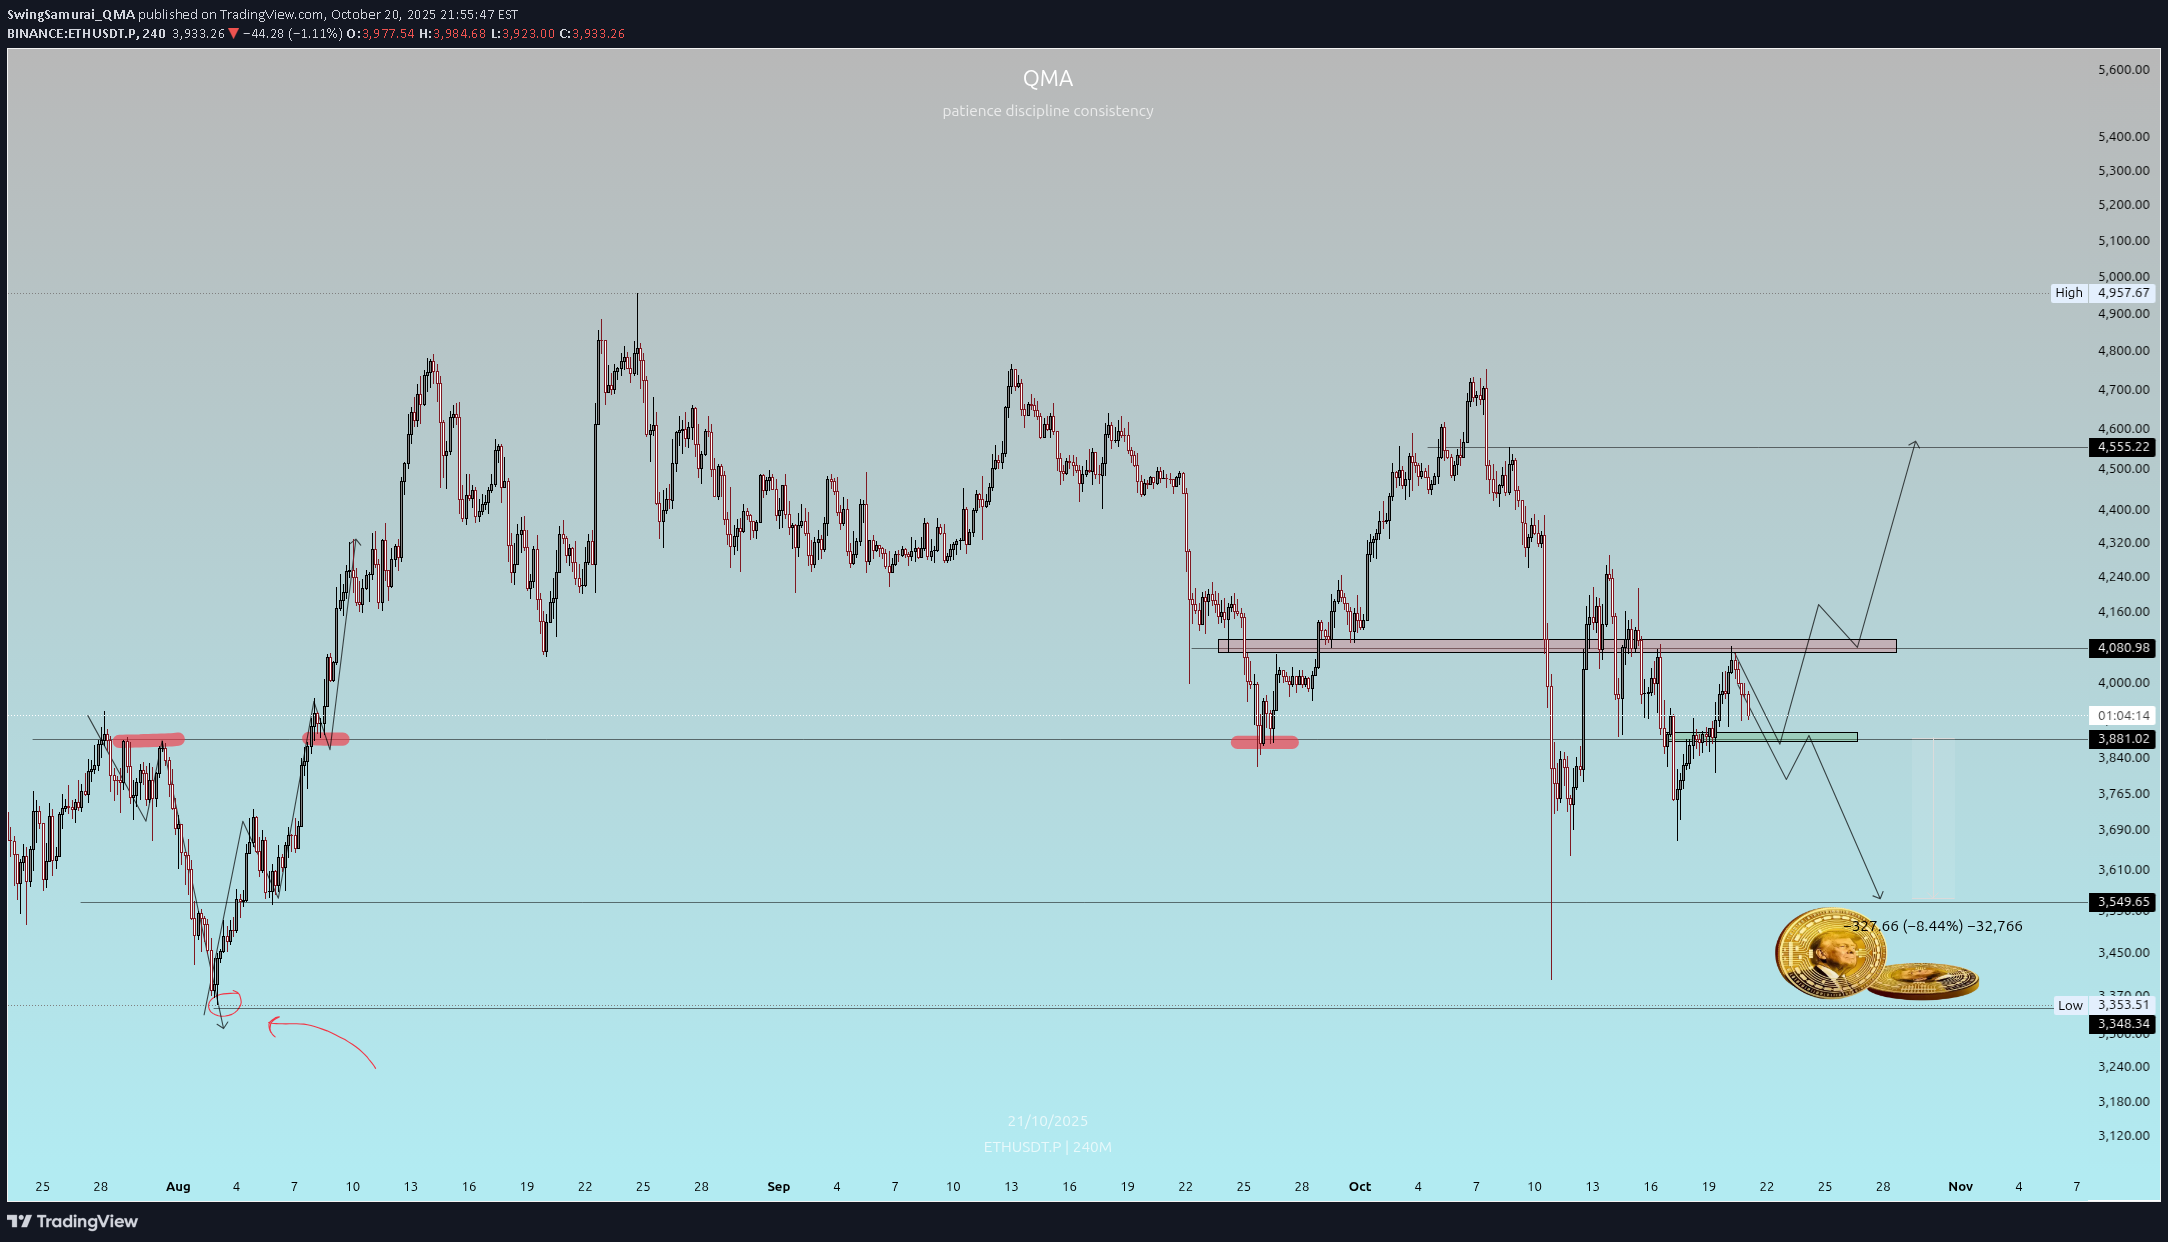
ETH. Observe Volume at those regions. Wait for Confirmation. GGs
SwingSamurai_QMA
سناریوی قیمت هایپرلیکوئید: منتظر تأیید نهایی برای ورود باشید!
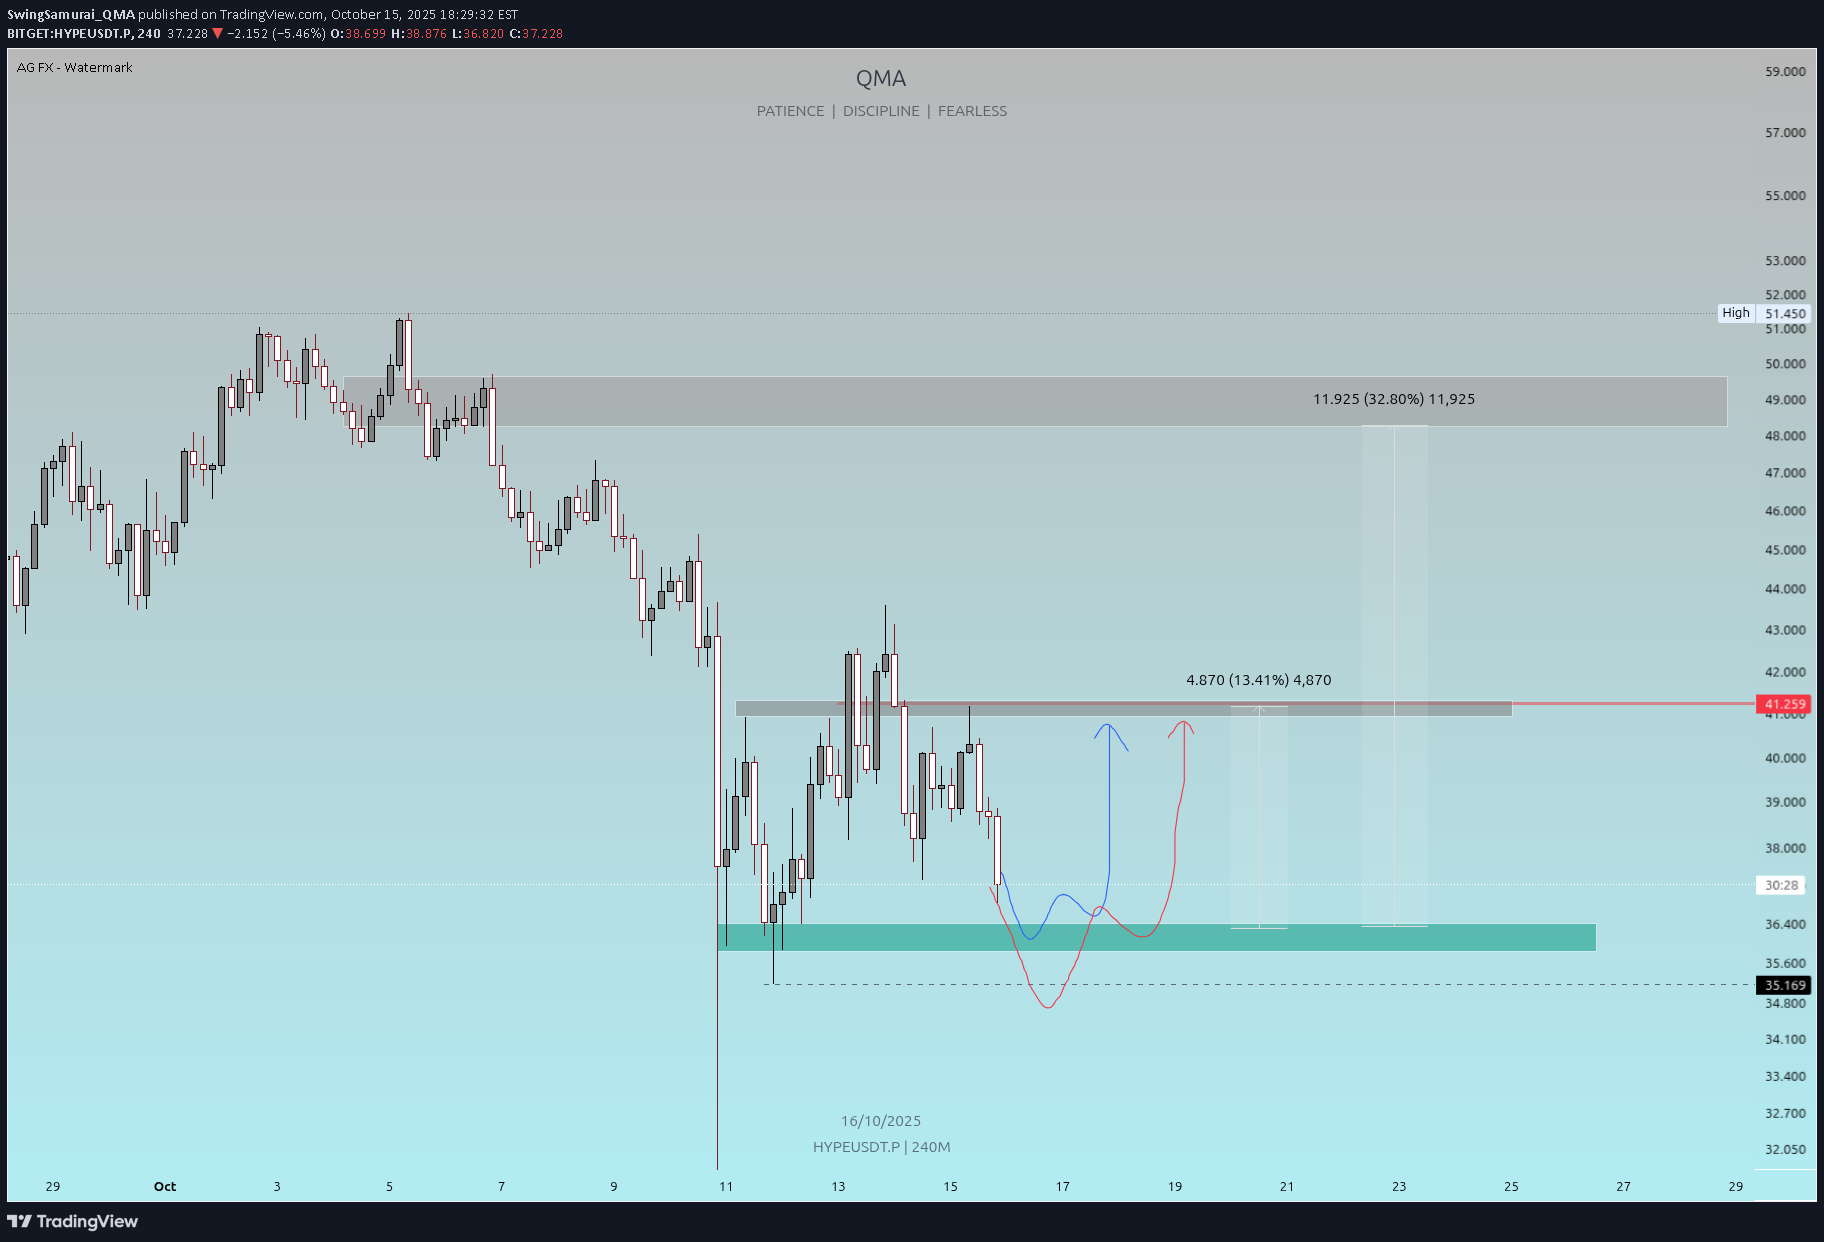
Wait for Liquidity sweep and close of candle above range on the 4hr timeframe to confirm entry. Manage risk accordingly, if price fails to close above range then entry is not valid.
SwingSamurai_QMA
تحلیل PYTH: آماده جهش بزرگ یا اصلاح قیمتی؟ سطوح کلیدی ورود و خروج!

Is PYTH breaking out for a strong move up or gearing for a correction? This analysis identifies key levels to watch for high-probability entries and exits. Price Levels to Watch: Resistance Zone: $0.44–$0.50 (major supply area) Intermediate Resistance: $0.1870 Current Price Support: $0.1445 Support Zone: $0.1137 Scenarios: 🔵 Bullish: Break and hold above $0.1870 could trigger a move to $0.44+. Possible gains over 100%! 🔴 Bearish: Failure to hold $0.1445 support may lead to retest of $0.0860 region. Why This Setup? Clear supply/demand zones highlight significant trader interest. Weekly timeframe support/resistance for swing trading opportunities. Focus on patient, disciplined entries with risk management
SwingSamurai_QMA
BTC BREAKING KEY LEVEL — $115K TO $119K MOVE INCOMING?

Bitcoin just tested $113K support and bounced hard — now eyeing $117K resistance. This setup is primed for momentum traders looking to catch the next leg up. Critical Price Action Price is hovering around the $115K psychological level, which has become the make-or-break zone for bulls. Support at $113K represents the ultimate safety net — lose this on 4-hour or daily timeframes and Bitcoin will probabilistically head lower toward retest of sub-$112K levels. The chart shows multiple touches confirming this as a legitimate demand zone where institutional buyers are stepping in. The Setup (High Probability Trade) ✅ Trade Condition: Close above $113.5K on 4H → Confirms bullish reversal and momentum shift. This breakout would signal that buyers have absorbed selling pressure and are ready to push toward liquidity pools sitting between $118K-$119K. 🎯 Target Zones: First target $117,000 as immediate resistance, then If momentum sustains, liquidity grab could extend toward $118K-$119K where October forecasts project continuation. 🛑 Stop Loss: Below $113k — this invalidates the bullish structure and suggests bears maintain control. Why This Works Strong bounce from ~ $113K base equals momentum building. This is a classic support-to-resistance move where former resistance (the $115K zone) now acts as support, creating asymmetric risk-reward for bulls. Volume analysis shows accumulation patterns consistent with institutional buying ahead of Q4 volatility. Watch for Confirmation — No Fakeouts The key is waiting for 4-hour candle close (min 1hr) above $114.5K with volume confirmation. Fakeouts are common at psychological levels, so patience prevents getting stopped out prematurely. Monitor order book depth and funding rates for additional confluence. #BTC #Bitcoin #CryptoTrading #DayTrading #Breakout #BullishSetup #TechnicalAnalysis #CryptoSignals #BTCAnalysis #TradingView
SwingSamurai_QMA
BTC/USDT – Bullish Re-Test Setup

Price just tested $115.3K support and bounced hard — now eyeing $117K resistance. ✅ Trade Condition: Close above $115.6K on 4H → Confirm bullish reversal. Otherwise Price will head lower. 🎯 Target: $117,000 → $117,500 🛑 SL: Below $115,400 🔁 Strong bounce from base = momentum build This is a classic support-to-resistance move. Watch for confirmation — no fakeouts. #BTC #Bitcoin #CryptoTrading #DayTrading #Breakout
SwingSamurai_QMA
PYTH/USDT – Bullish Re-Test Setup

Key Level: 0.167 (Previous Support → Now Resistance) Target: 0.18 – 0.185 Timeframe: 4H (240M) ✅ Trade Conditions: Price must reclaim and close above 0.167 on the 4-hour candle. This confirms bullish strength and breaks the previous downtrend. 🎯 Action: Enter on close above 0.167 Stop Loss: Below 0.160 (support breakdown) Take Profit: 0.18 → 0.185 💡 Why? The zone around 0.167 was strong support earlier. If bulls reclaim it with a strong close, it signals momentum shift. The path of least resistance is now toward 0.18, where prior resistance lies. 🔥 Watch for confirmation — no fakeouts. Only trade if the 4H candle closes cleanly above 0.167. #PYTH #CryptoTrading #DayTrading #Breakout #TradingView
SwingSamurai_QMA
BTC/USD 1H Key Levels to Watch

Resistance Zones: $119,082 - Major resistance, watch for rejection $117,857 - Secondary resistance level $116,940 - Intermediate resistance Support: * $114,000 - Critical support zone Current Setup: Price action around these levels will determine next directional move. Clean break above $119k could signal continuation higher, while failure to hold $114k support may lead to further downside. Trade Plan: Watch for volume confirmation on any breakout attempts Look for rejection/bounce signals at key levels Manage risk accordingly Not financial advice. DYOR.
SwingSamurai_QMA
ETH: Breaking 3300 is Key for Upside Momentum

Keywords: Ethereum (ETH), Cryptocurrency, Trading, Technical Analysis, Resistance, Support, Breakout, Price Action, Consolidation, Accumulation, Bullish, Bearish, Trend ETH is currently consolidating in a tight range below the crucial 3300 resistance level. This level has been acting as a significant barrier to further upside momentum. Price Action: We're witnessing a classic battle between bulls and bears. Buyers are trying to push prices higher, while sellers are defending the 3300 level. Volume has been relatively low during this consolidation phase, suggesting indecision and a potential accumulation phase. A decisive break above 3300 would be a strong bullish signal, potentially igniting a fresh wave of buying pressure. Technical Analysis: The 3300 level has acted as strong resistance on multiple occasions. A break above this level would invalidate the bearish bias and open the door for a potential move towards 3600. Conversely, a failure to break 3300 and a subsequent drop below a key support level 3200 would increase the likelihood of further downside. Trading Strategy: Wait for a decisive break above 3300. Consider entering long positions on a breakout confirmation with a stop-loss below the breakout level. Monitor volume and price action closely for any signs of weakness. Disclaimer: This is not financial advice. Do your own research and consult with a qualified financial advisor before making any investment decisions. Remember: Price action is dynamic. Markets can be unpredictable. Always practice proper risk management.
SwingSamurai_QMA
ETH Update: Pivot Point Showdown

Ethereum (ETH) is currently trading at a critical juncture, hovering around a key pivot level. This price zone represents a crucial decision point for the cryptocurrency, with the potential for a significant move in either direction. The Current Situation ETH has been consolidating in recent days, with bulls and bears locked in a tight battle for control. The pivot level, which currently sits around [insert current ETH price], is acting as a strong point of contention. Possible Scenarios Scenario 1: Bullish Reversal If bulls can muster enough strength to push ETH above the pivot level with conviction, we could see a significant upward move. This would likely be fueled by increased buying pressure and positive sentiment in the market. Scenario 2: Bearish Breakdown If bears manage to break down below the pivot level, it could trigger a sharp decline. This would likely be accompanied by increased selling pressure and negative sentiment. In this scenario, ETH could potentially drop to the support level, which sits around the 3600 range. Key Factors to Watch Trading Volume: A surge in trading volume accompanying a breakout above or below the pivot level would add conviction to the move. Momentum: Strong bullish or bearish momentum on smaller timeframes could provide clues about the direction of the next major move. News and Sentiment: Keep an eye on any major news or developments in the crypto space, as these could influence ETH's price action. The Decision Point The next few days will be crucial for ETH. The outcome of the battle at the pivot level will likely determine the direction of the next major move. Traders should remain vigilant and be prepared for volatility in the near term. Disclaimer: This is not financial advice. Please do your own research and consult with a financial professional before making any investment decisions.
SwingSamurai_QMA
Solana at a Crossroads: $240 is the Key!

Solana (SOL) has been on a wild ride, recently revisiting its all-time high. But don't break out the champagne just yet! A critical resistance level has emerged around $240, acting as a major roadblock to further gains. Here's the breakdown: $240 Resistance: This price point is a significant hurdle. Multiple attempts to break through have been rejected, indicating strong selling pressure. A decisive daily close above $240 is crucial for a renewed bull run. Downtrend Potential: Until that breakout happens, SOL appears to be in a downtrend. Expect continued downward pressure, with a potential target of $180. This area could provide strong support, setting the stage for a potential bounce. Trade Idea: Long Oppurtunity: Wait for a confirmed daily close above $240 before entering long positions. Target the previous all-time high and beyond. Short Opportunity: The current technical structure presents a compelling shorting opportunity for traders with an appropriate risk appetite. Entry points could be considered at the current price or on any failed attempts to break above $240. A prudent stop-loss would be placed above the $240 resistance level, while a price target of $180 is reasonable. Key Indicators to Watch: Daily Close: Pay close attention to the daily closing price. A close above $240 is the bullish signal we're looking for. Volume: Increased volume on a breakout above $240 would add conviction to the move. RSI: Monitor the Relative Strength Index for signs of bullish divergence, which could foreshadow a price reversal. Disclaimer: This is not financial advice. Always do your own research and manage your risk accordingly.
Disclaimer
Any content and materials included in Sahmeto's website and official communication channels are a compilation of personal opinions and analyses and are not binding. They do not constitute any recommendation for buying, selling, entering or exiting the stock market and cryptocurrency market. Also, all news and analyses included in the website and channels are merely republished information from official and unofficial domestic and foreign sources, and it is obvious that users of the said content are responsible for following up and ensuring the authenticity and accuracy of the materials. Therefore, while disclaiming responsibility, it is declared that the responsibility for any decision-making, action, and potential profit and loss in the capital market and cryptocurrency market lies with the trader.