
POWR
Powerledger
| تریدر | نوع سیگنال | حد سود/ضرر | زمان انتشار | مشاهده پیام |
|---|---|---|---|---|
 CryptoWithJamesRank: 32143 | خرید | حد سود: تعیین نشده حد ضرر: تعیین نشده | 12/30/2025 |
Price Chart of Powerledger
سود 3 Months :
سیگنالهای Powerledger
Filter
Sort messages by
Trader Type
Time Frame
CryptoWithJames
POWRUSDT UPDATE
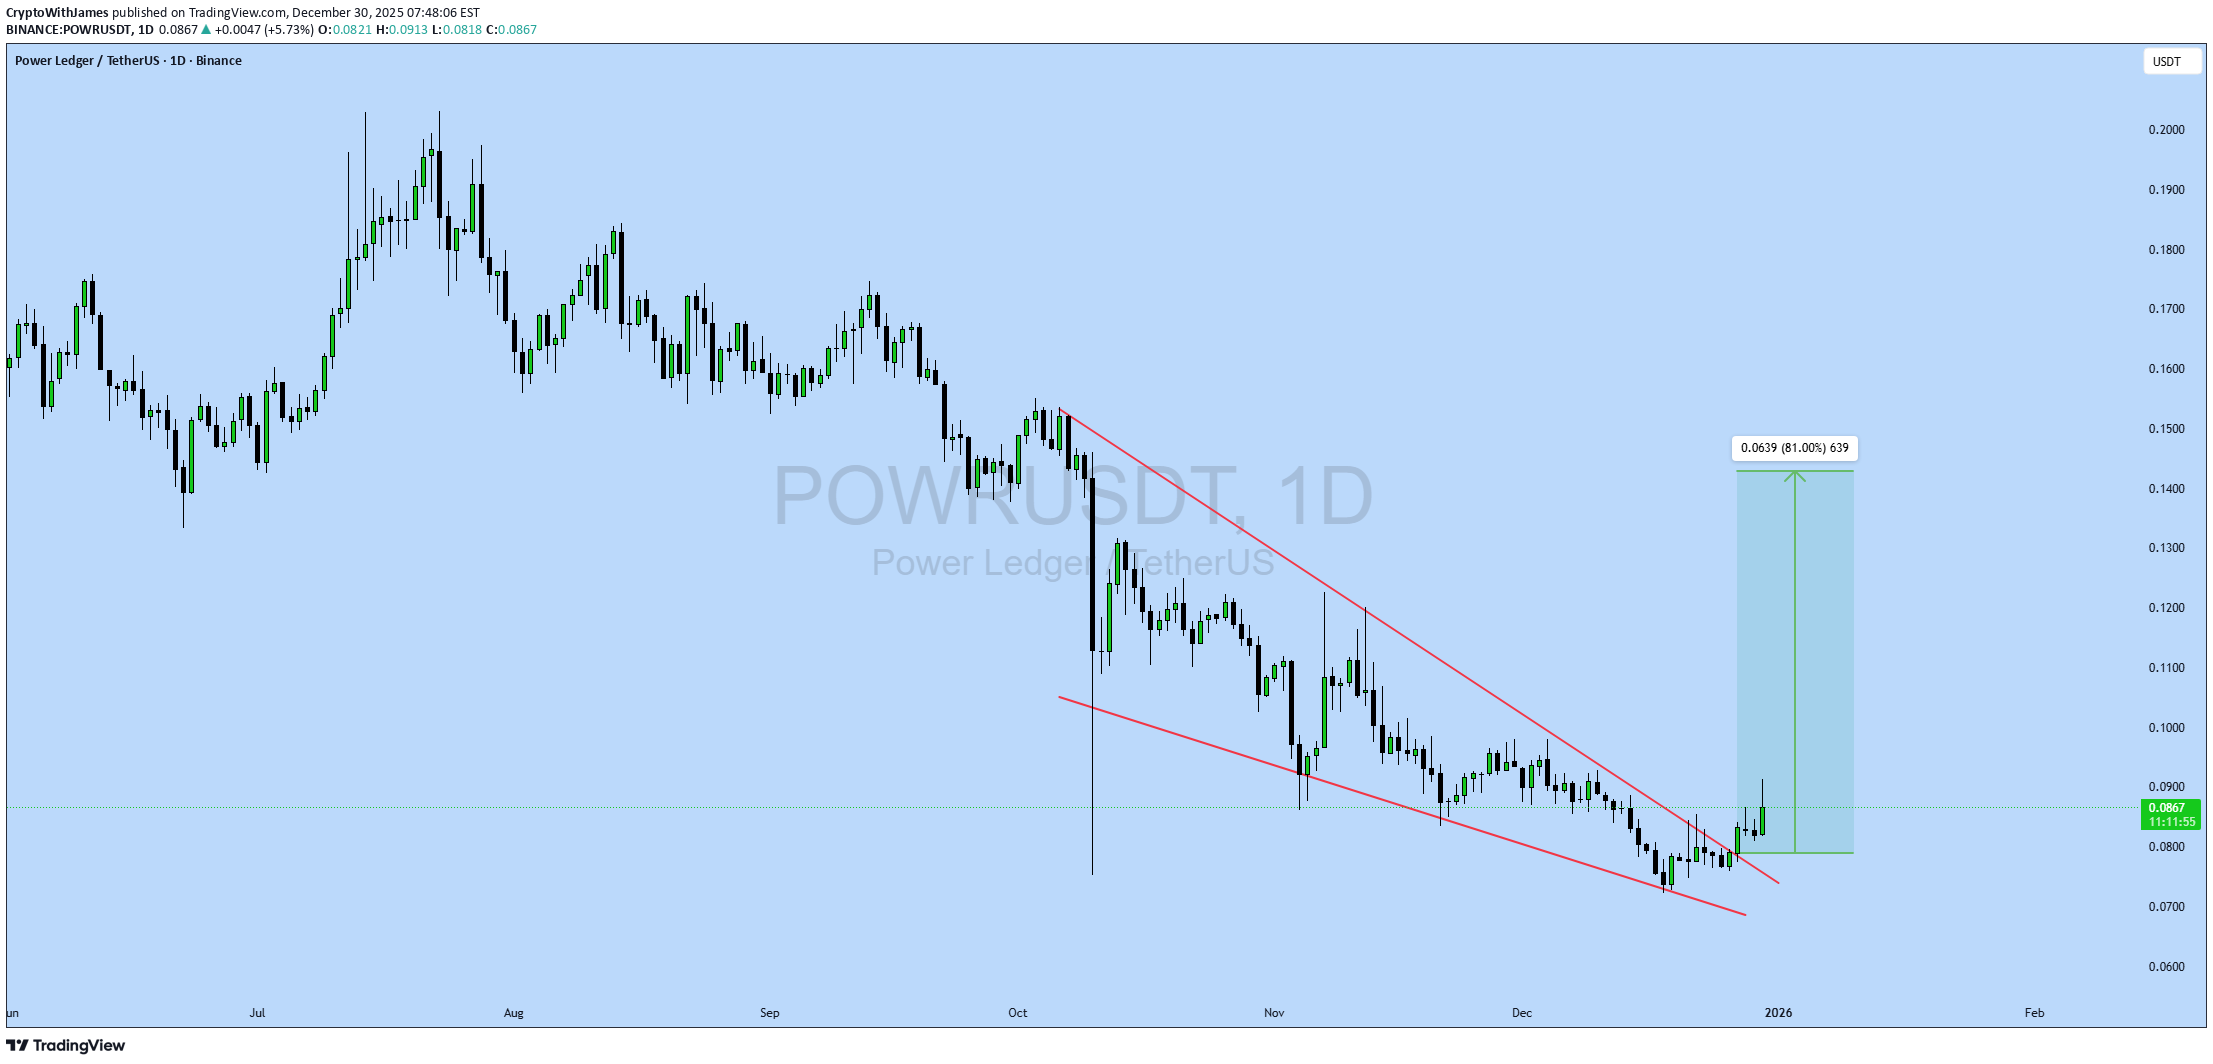
#POWR UPDATE POWR Technical Setup Pattern: Falling Wedge Pattern Current Price: 0.0859$ Target Price: 0.1500$ Target % Gain: 80.74% Technical Analysis :POWR is breaking out of a falling wedge pattern on the 1D chart, indicating bullish potential. The price has recently surged above the resistance trendline, supported by an increase in volume. The setup is validated as the price approaches the key resistance areas. Time Frame: 1D Risk Management Tip: Always use proper risk management.

Kapitalist01


Crypto-By--Ghazi
POWR/USDT IDEA

Pair: POWR/USDT Timeframe: 8H Structure: Descending trendline breakout watch POWR has been moving within a broad descending structure and is now testing the upper trendline with price pushing into the resistance zone around 0.2000. Momentum is building as it tries to break out of the prolonged downtrend. Bullish case: A confirmed breakout above 0.2050 with strong volume could trigger continuation to the upside. If that happens, the next upside levels to watch are 0.2300 and 0.2600. Look for a retest of the breakout level for a safer entry. Bearish case: If POWR fails to sustain above 0.2000 and drops back under 0.1800, we might see selling pressure resume with targets back toward 0.1600 and 0.1500. Price is at a critical decision point. Wait for clear breakout confirmation before taking a position. Set alerts and monitor volume closely.

UmutTrades
POWRUSDT: Mid-Term Analysis

Price is rising strongly, showing momentum and interest. The blue box is a fair price to join as a buyer if price pulls back. I’m not chasing while it’s pumping. If price returns to the blue box, I’ll watch for: ✅ Footprint absorption (aggressive sells met with passive buys) ✅ CDV holding or making higher lows ✅ Structure reclaim for entry confirmation If these align, I will consider a risk-managed long to ride the trend. If not, I’ll stay patient and protect capital. Plan: Let price come to me, act only with confirmation, and manage risk with discipline. 📌I keep my charts clean and simple because I believe clarity leads to better decisions. 📌My approach is built on years of experience and a solid track record. I don’t claim to know it all but I’m confident in my ability to spot high-probability setups. 📌If you would like to learn how to use the heatmap, cumulative volume delta and volume footprint techniques that I use below to determine very accurate demand regions, you can send me a private message. I help anyone who wants it completely free of charge. 🔑I have a long list of my proven technique below: 🎯 ZENUSDT.P: Patience & Profitability | %230 Reaction from the Sniper Entry 🐶 DOGEUSDT.P: Next Move 🎨 RENDERUSDT.P: Opportunity of the Month 💎 ETHUSDT.P: Where to Retrace 🟢 BNBUSDT.P: Potential Surge 📊 BTC Dominance: Reaction Zone 🌊 WAVESUSDT.P: Demand Zone Potential 🟣 UNIUSDT.P: Long-Term Trade 🔵 XRPUSDT.P: Entry Zones 🔗 LINKUSDT.P: Follow The River 📈 BTCUSDT.P: Two Key Demand Zones 🟩 POLUSDT: Bullish Momentum 🌟 PENDLEUSDT.P: Where Opportunity Meets Precision 🔥 BTCUSDT.P: Liquidation of Highly Leveraged Longs 🌊 SOLUSDT.P: SOL's Dip - Your Opportunity 🐸 1000PEPEUSDT.P: Prime Bounce Zone Unlocked 🚀 ETHUSDT.P: Set to Explode - Don't Miss This Game Changer 🤖 IQUSDT: Smart Plan ⚡️ PONDUSDT: A Trade Not Taken Is Better Than a Losing One 💼 STMXUSDT: 2 Buying Areas 🐢 TURBOUSDT: Buy Zones and Buyer Presence 🌍 ICPUSDT.P: Massive Upside Potential | Check the Trade Update For Seeing Results 🟠 IDEXUSDT: Spot Buy Area | %26 Profit if You Trade with MSB 📌 USUALUSDT: Buyers Are Active + %70 Profit in Total 🌟 FORTHUSDT: Sniper Entry +%26 Reaction 🐳 QKCUSDT: Sniper Entry +%57 Reaction 📊 BTC.D: Retest of Key Area Highly Likely 📊 XNOUSDT %80 Reaction with a Simple Blue Box! 📊 BELUSDT Amazing %120 Reaction! 📊 Simple Red Box, Extraordinary Results 📊 TIAUSDT | Still No Buyers—Maintaining a Bearish Outlook 📊 OGNUSDT | One of Today’s Highest Volume Gainers – +32.44% 📊 TRXUSDT - I Do My Thing Again 📊 FLOKIUSDT - +%100 From Blue Box! 📊 SFP/USDT - Perfect Entry %80 Profit! 📊 [https://www.tradingview.com/chart/AAVEUSDT/RZ4eezbi-AAVEUSDT-Analysis-Retracement-Opportunity/]AAVEUSDT - WE DID IT AGAIN! I stopped adding to the list because it's kinda tiring to add 5-10 charts in every move but you can check my profile and see that it goes on..
UmutTrades
POWR/USDT – One Spot, One Setup

POWR has been grinding sideways, but the real play sits down in that blue box. You know the drill: that’s where liquidity lives, and where smart money often makes its move. There’s no need for extra chatter—just wait for the confirmation trifecta.First, watch for price to dip into the blue zone. Then look for a volume surge that outperforms the last sell-off, paired with a CDV divergence that signals real buying pressure. Finally, flip over to your low-timeframe chart: a quick break below the box followed by a fast reclaim is your cue. That’s when order flow shifts from sellers to buyers, and you’re in.“I will not insist on my short idea. If the levels suddenly break upwards and do not give a downward break in the low time frame, I will not evaluate it. If they break upwards with volume and give a retest, I will look long.”Miss this, and you’ll be left watching from the sidelines. Nail it, and you catch the kind of move most traders only dream about. Keep your eyes on that blue box—when it lights up with those signals, that’s your green light.📌I keep my charts clean and simple because I believe clarity leads to better decisions.📌My approach is built on years of experience and a solid track record. I don’t claim to know it all but I’m confident in my ability to spot high-probability setups.📌If you would like to learn how to use the heatmap, cumulative volume delta and volume footprint techniques that I use below to determine very accurate demand regions, you can send me a private message. I help anyone who wants it completely free of charge.🔑I have a long list of my proven technique below:🎯 ZENUSDT.P: Patience & Profitability | %230 Reaction from the Sniper Entry🐶 DOGEUSDT.P: Next Move🎨 RENDERUSDT.P: Opportunity of the Month💎 ETHUSDT.P: Where to Retrace🟢 BNBUSDT.P: Potential Surge📊 BTC Dominance: Reaction Zone🌊 WAVESUSDT.P: Demand Zone Potential🟣 UNIUSDT.P: Long-Term Trade🔵 XRPUSDT.P: Entry Zones🔗 LINKUSDT.P: Follow The River📈 BTCUSDT.P: Two Key Demand Zones🟩 POLUSDT: Bullish Momentum🌟 PENDLEUSDT.P: Where Opportunity Meets Precision🔥 BTCUSDT.P: Liquidation of Highly Leveraged Longs🌊 SOLUSDT.P: SOL's Dip - Your Opportunity🐸 1000PEPEUSDT.P: Prime Bounce Zone Unlocked🚀 ETHUSDT.P: Set to Explode - Don't Miss This Game Changer🤖 IQUSDT: Smart Plan⚡️ PONDUSDT: A Trade Not Taken Is Better Than a Losing One💼 STMXUSDT: 2 Buying Areas🐢 TURBOUSDT: Buy Zones and Buyer Presence🌍 ICPUSDT.P: Massive Upside Potential | Check the Trade Update For Seeing Results🟠 IDEXUSDT: Spot Buy Area | %26 Profit if You Trade with MSB 📌 USUALUSDT: Buyers Are Active + %70 Profit in Total🌟 FORTHUSDT: Sniper Entry +%26 Reaction🐳 QKCUSDT: Sniper Entry +%57 Reaction📊 BTC.D: Retest of Key Area Highly Likely📊 XNOUSDT %80 Reaction with a Simple Blue Box!📊 BELUSDT Amazing %120 Reaction!📊 Simple Red Box, Extraordinary ResultsI stopped adding to the list because it's kinda tiring to add 5-10 charts in every move but you can check my profile and see that it goes on..

ONE1iMPACT
POWRUSDT: The Power Surge You Can’t Ignore!

📊 Chart Breakdown: - Current Price: $0.195- Volume: 199M (Mega whale activity! 🐋) - Key Levels: - Support: $0.1400 (Strong floor!) - Resistance: $0.4000 (Break = Hyperdrive!) 🔥 Creative Analysis: POWRUSDT just exploded with a 40% pump—but this isn’t just a fluke. The 199M volume screams institutional interest. The chart shows a V-shaped recovery from $0.12, proving dips get bought HARD. 🎯 Big Idea: "The Energy Rocket" 🚀 - Entry: $0.16 (Aggressive) or $0.145 (Safe retest) - Targets: $0.22 → $0.28 → $0.34 (FOMO zone!) - Stop Loss: Below $0.124 (Only for diamond hands!) 💡 Why This Works: - Volume Confirmation: 199M = REAL demand. - Symmetrical Bull Flag: Consolidation before next leg up! - Narrative Power: Energy tokens are HOT in 2025 (Green crypto wave!). 🚨 Meme-Worthy Twist: "POWR isn’t just a token—it’s a LIGHTNING BOLT waiting to strike! ⚡ Buy now or watch from the sidelines." 📌 Final Thought: This could be the start of a parabolic run. If it clears $0.38, then $1.00 is in play. Don’t miss the energy revolution! 👍 Like & Follow for more explosive setups! #POWR #GreenCrypto #100xPotential --- Let me know if you'd like any further refinements! 🚀.DYOR – this isn’t financial advice, it’s high-voltage hype! 🔋

blackriver85


MyCryptoParadise
Is #POWR Bouncing Before the Breakdown? Don’t Get Caught

Yello, Paradisers. Have you spotted how quietly #POWR is building up a sneaky trap? This move by #PowerLedger could wipe out impatient bulls and overly confident bears in one go:💎#POWRUSDT is currently trading inside a clean descending channel structure, where both resistance and support levels have been perfectly respected over the past few weeks. The most recent bounce from the lower boundary (around 0.1169) was anticipated, but let’s be clear — this move is still within a bearish market structure.💎The price is approaching a key resistance level near 0.155–0.160, which also aligns with the descending trendline. A temporary spike higher to test this area — even up to 0.179 — is likely, but don’t get fooled. These types of moves are often engineered to liquidate early short positions before the true direction resumes. Classic bull trap behavior.💎As long as #POWR remains below the critical resistance zone at 0.180, there is no bullish market shift. This is the invalidation point for any bearish setup — and the price must close and hold above this level to suggest a sustained trend reversal. Until then, this is just another lower high in a broader downtrend.💎On the downside, the key support levels to monitor are 0.1169, and then 0.0901 — where the strong historical support lies. If the price fails to hold 0.1169, a sharper markdown move into the 0.09 zone becomes increasingly likely. Volume remains muted and momentum indicators are not showing any strong reversal signals yet. Until we see a breakout and confirmation, every bounce is just an opportunity for the market to trap late longs.Patience and precision are key in these conditions wait for strong confirmation before making your moves.MyCryptoParadiseiFeel the success🌴

Cryptonic_Trading
Power is gonna increase It's bullish Power!

POWRUSDT POWER Ledger has formed an ascending Triangle which means the price is gonna increase soon!No break out yet! but the price will increase accordingly!⚠️ Disclaimer:This is not financial advice. Always manage your risks and trade responsibly.👉 Follow me for daily updates,💬 Comment and like to share your thoughts,📌 And check the link in my bio for even more resources!Let’s navigate the markets together—join the journey today! 💹✨

Ren_MomentumTrader
POWR/USDT

Key Level Zone : 0.2980 - 0.3000HMT v4.1 detected. The setup looks promising, supported by a previous upward/downward trend with increasing volume and momentum, presenting an excellent reward-to-risk opportunity.HMT (High Momentum Trending):HMT is based on trend, momentum, volume, and market structure across multiple timeframes. It highlights setups with strong potential for upward movement and higher rewards.Whenever I spot a signal for my own trading, I’ll share it. Please note that conducting a comprehensive analysis on a single timeframe chart can be quite challenging and sometimes confusing. I appreciate your understanding of the effort involved.Important Note :Role of Key Levels:- These zones are critical for analyzing price trends. If the key level zone holds, the price may continue trending in the expected direction. However, momentum may increase or decrease based on subsequent patterns.- Breakouts: If the key level zone breaks, it signals a stop-out. For reversal traders, this presents an opportunity to consider switching direction, as the price often retests these zones, which may act as strong support-turned-resistance (or vice versa).My Trading RulesRisk Management- Maximum risk per trade: 2.5%.- Leverage: 5x.Exit StrategyProfit-Taking:- Sell at least 70% on the 3rd wave up (LTF Wave 5).- Typically, sell 50% during a high-volume spike.- Adjust stop-loss to breakeven once the trade achieves a 1.5:1 reward-to-risk ratio.- If the market shows signs of losing momentum or divergence, ill will exit at breakeven.The market is highly dynamic and constantly changing. HMT signals and target profit (TP) levels are based on the current price and movement, but market conditions can shift instantly, so it is crucial to remain adaptable and follow the market's movement.If you find this signal/analysis meaningful, kindly like and share it.Thank you for your support~Sharing this with love!HMT v2.0:- Major update to the Momentum indicator- Reduced false signals from inaccurate momentum detection- New screener with improved accuracy and fewer signalsHMT v3.0:- Added liquidity factor to enhance trend continuation- Improved potential for momentum-based plays- Increased winning probability by reducing entries during peaksHMT v3.1:- Enhanced entry confirmation for improved reward-to-risk ratiosHMT v4.0:- Incorporated buying and selling pressure in lower timeframes to enhance the probability of trending moves while optimizing entry timing and scalingHMT v4.1:- Enhanced take-profit (TP) target by incorporating market structure analysis
Disclaimer
Any content and materials included in Sahmeto's website and official communication channels are a compilation of personal opinions and analyses and are not binding. They do not constitute any recommendation for buying, selling, entering or exiting the stock market and cryptocurrency market. Also, all news and analyses included in the website and channels are merely republished information from official and unofficial domestic and foreign sources, and it is obvious that users of the said content are responsible for following up and ensuring the authenticity and accuracy of the materials. Therefore, while disclaiming responsibility, it is declared that the responsibility for any decision-making, action, and potential profit and loss in the capital market and cryptocurrency market lies with the trader.