
Crypto-By--Ghazi
@t_Crypto-By--Ghazi

What symbols does the trader recommend buying?
Purchase History
پیام های تریدر
Filter
Crypto-By--Ghazi
لحظه حساس ZEN/USDT: آیا منتظر پامپ ۲۰ تا ۴۰ درصدی هستیم یا سقوط؟
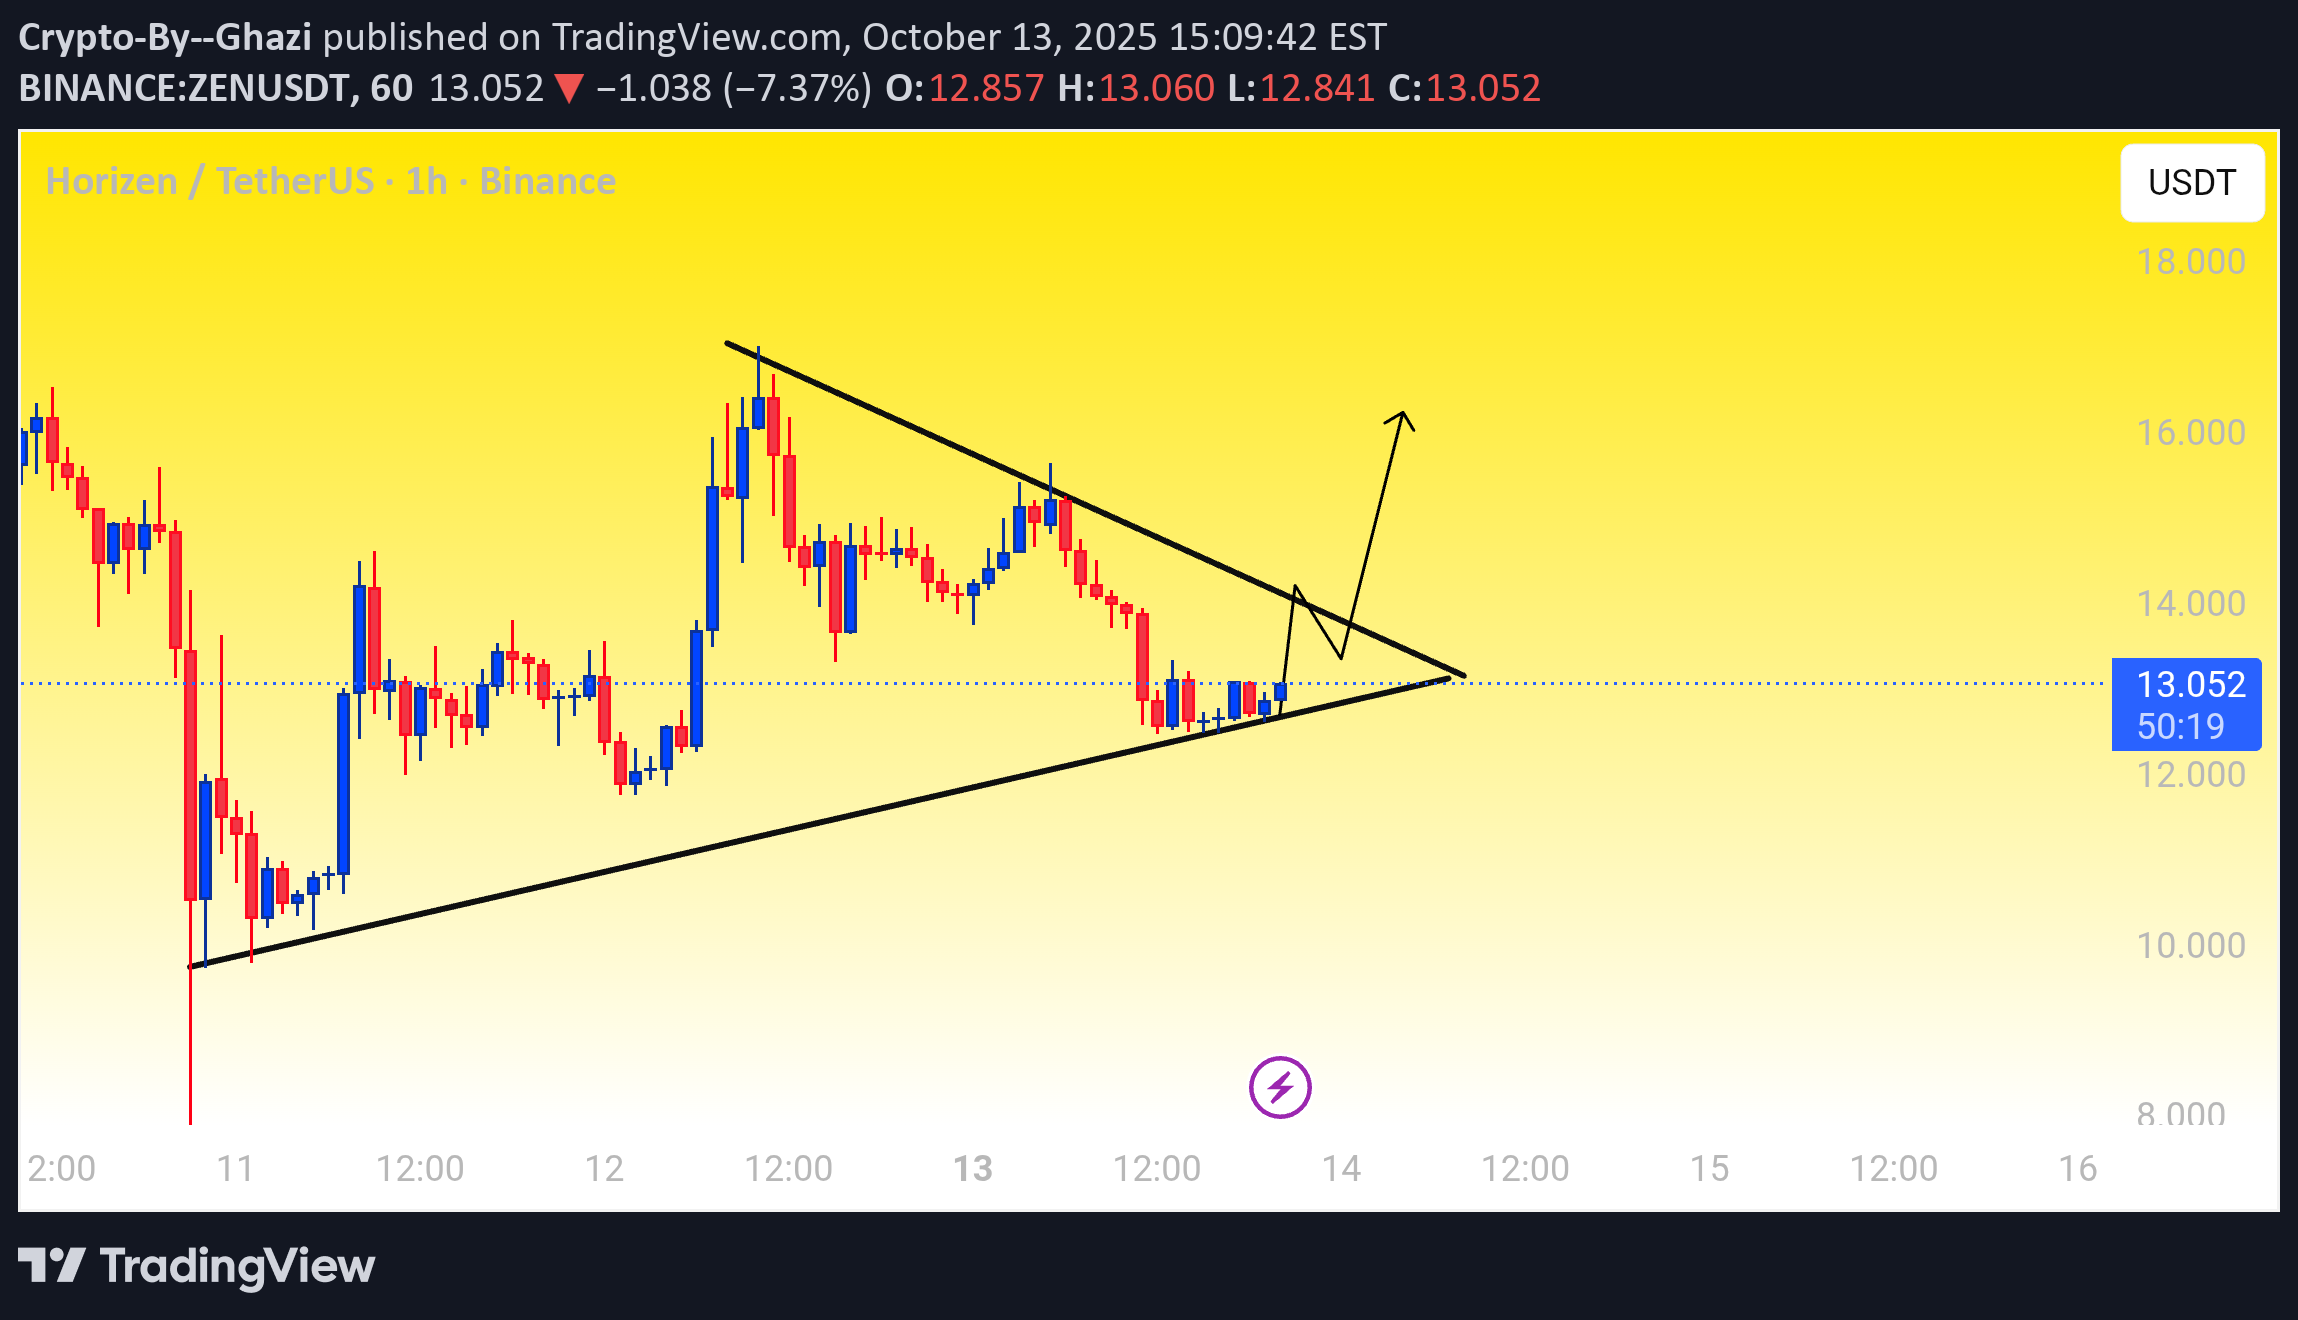
Z ZEN/USDT — Hold or Die Moment ZEN is currently testing a key trendline support — this level is absolutely crucial for its next move. If it holds successfully, we can expect a strong 20–40% pump in the short term. However, if it breaks below, momentum could fade quickly. Keep eyes on this level and trade with caution. Always DYOR and manage your risk!
Crypto-By--Ghazi
نبرد حیاتی بیت کوین: راز حفظ حمایت برای رسیدن به اوج یا سقوط زیر 90 هزار دلار!

Crypto-By--Ghazi

Crypto-By--Ghazi
AlgoUsdt Idea

ALGOUSDT UPDATE: ALGO is currently trading around $0.2350. ALGO is breaking down a symmetrical triangle on the daily time frame. The possible scenarios are if the price successfully breaks the triangle and gives a daily close, then we may see bearish momentum in #ALGO. Otherwise, if it pumps from here and trades inside the triangle again, then it may go towards the upper resistance trendline of the triangle. Keep an eye on it.
Crypto-By--Ghazi
DASHUSDT TRADING IDEA
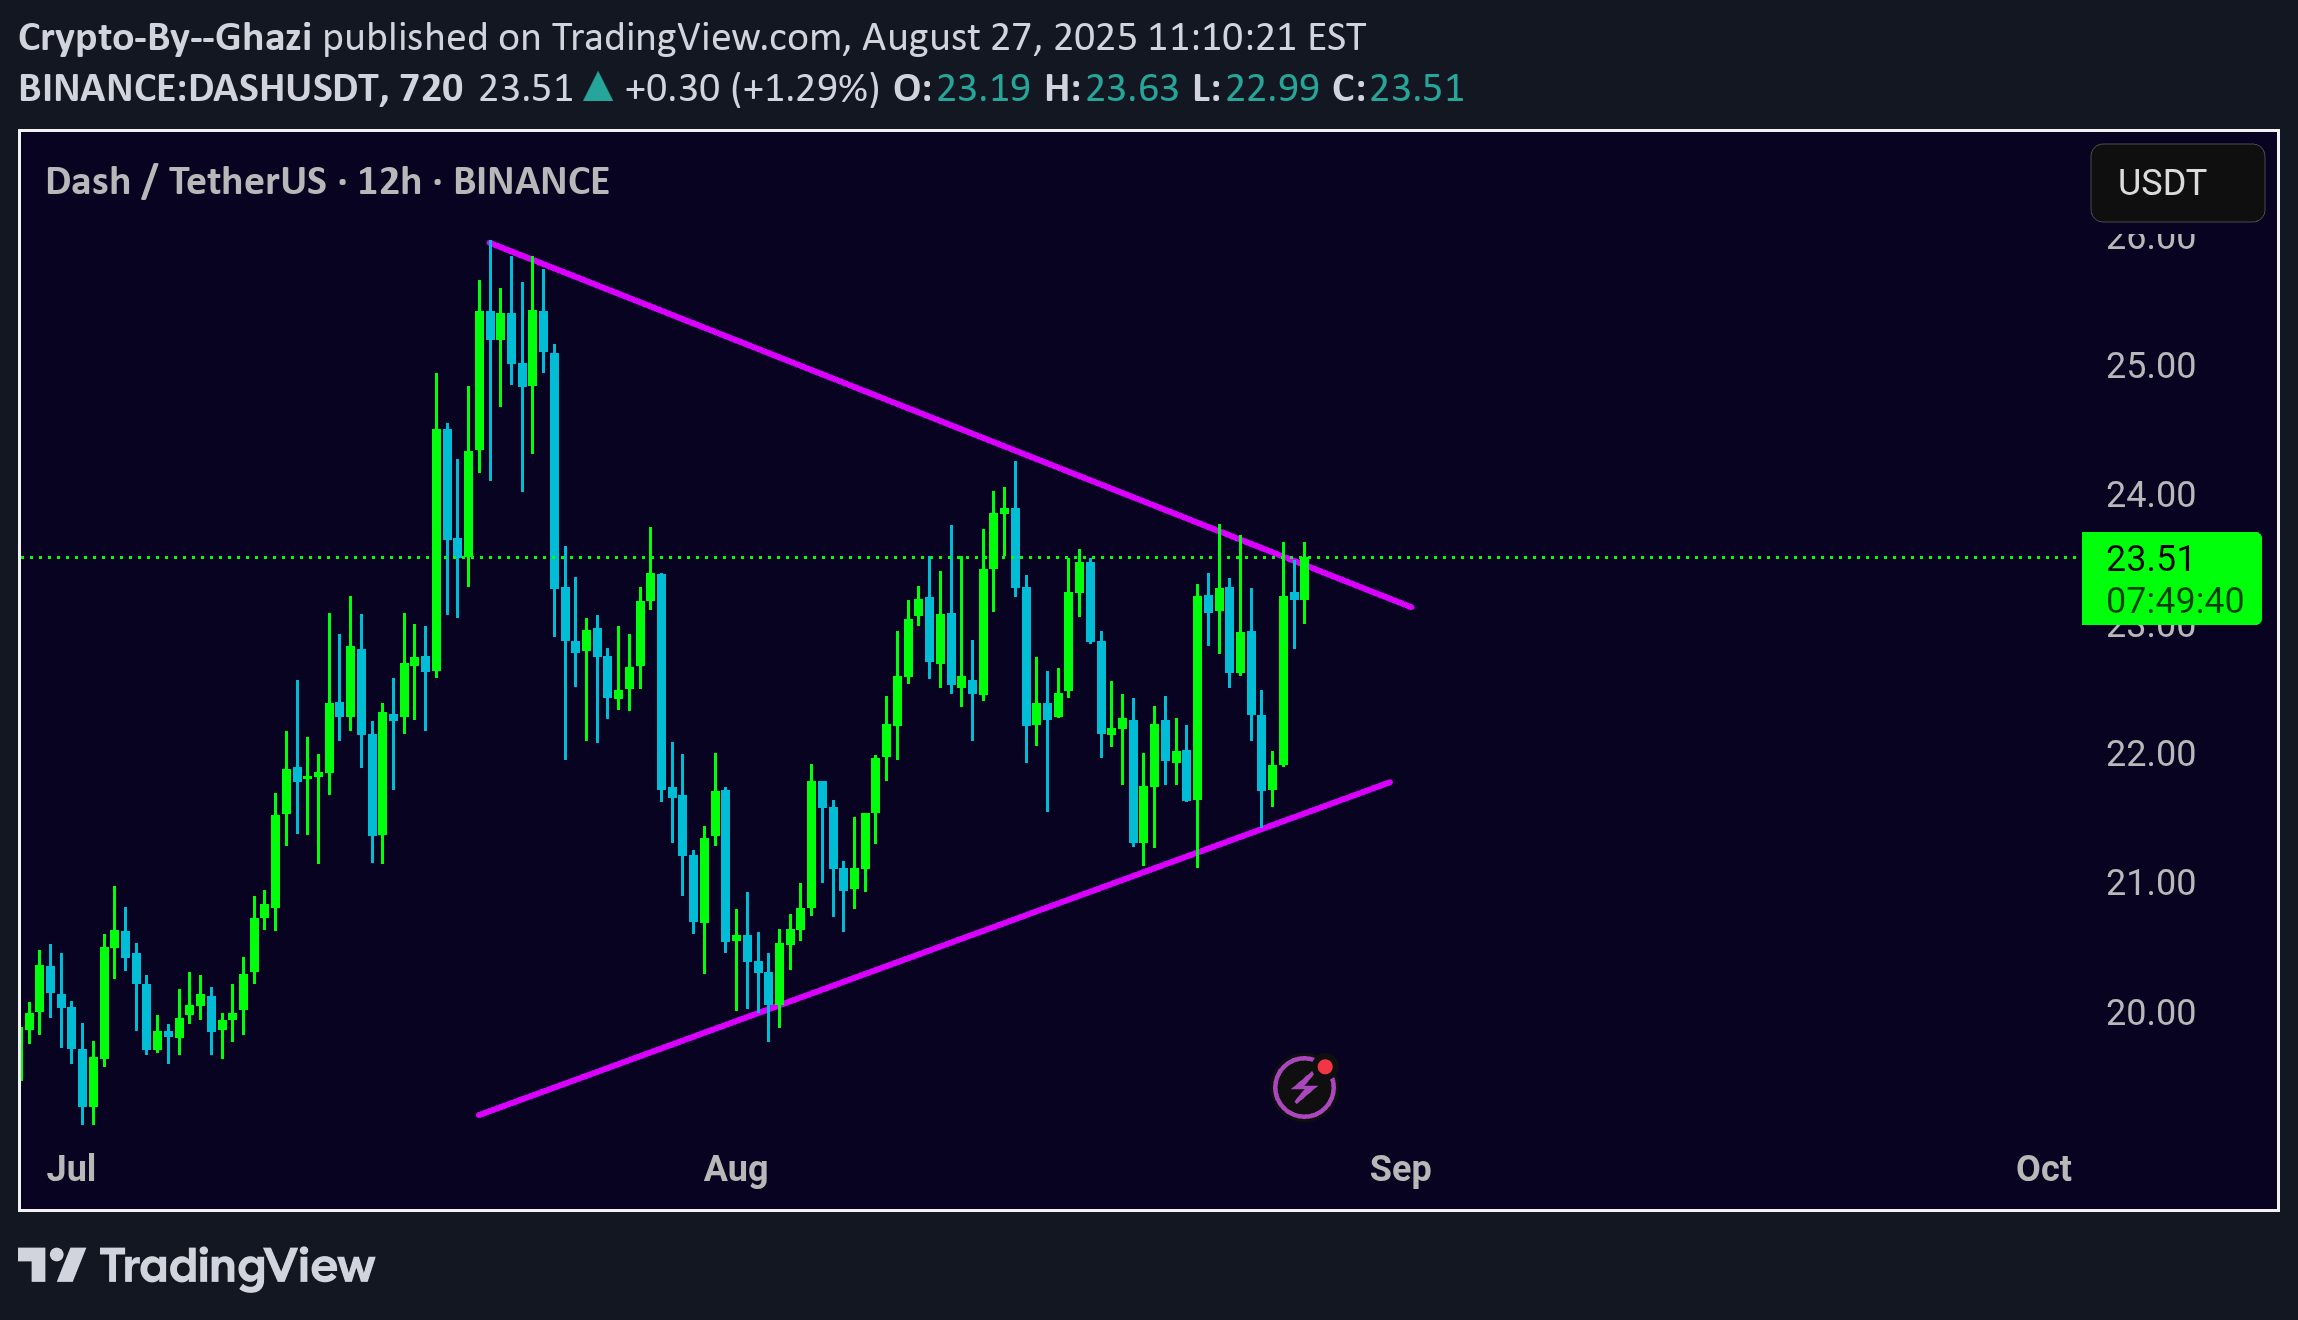
Traders can open their Buy Trades after the breakout is confirmed. 🔴 SL @ 22.80 🔵 TP1 @ 25.00 🔵 TP2 @ 28.00 🔵 TP3 @ 30.00 What are these signals based on? 📊 Classical Technical Analysis 📈 Price Action Candlesticks 📉 Fibonacci 🔵 RSI, Moving Average, Ichimoku, Bollinger Bands ⚠️ Risk Warning: Trading Forex, CFDs, Crypto, Futures, and Stocks involves a risk of loss. Please consider carefully if such trading is appropriate for you. Past performance is not indicative of future results. If you liked our ideas, please support us with your likes 👍 and comments.
Crypto-By--Ghazi
Trading Setup for PortalUSDT

Trading Setup for PortalUSDT A breakout has been observed in the PortalUSDT pair, signaling the potential for a significant upward movement. The market has recently broken above a key resistance level, followed by a retest of that level, presenting a solid opportunity for bullish trades. Trade Entry and Targets: ⬆️ Buy Now or Buy on Pullback to 0.04500 🔴 Stop Loss (SL): 0.04000 🔵 Take Profit (TP1): 0.05400 🔵 Take Profit (TP2): 0.06000 🔵 Take Profit (TP3): 0.06300 Risk Management: Set your stop loss at 0.04000 to limit potential losses in case the support does not hold. The take profit levels are set at strategic points to capture gains as the price moves higher: 0.05400, 0.06000, and 0.06300. Maintain a balanced risk-to-reward ratio by managing position sizes and entry points carefully. Risk Warning: 🚨 Crypto trading involves high volatility and significant risk. Only trade with margin you are prepared to lose. ⚠️ Past performance does not guarantee future results. Please ensure proper risk management. If you like this setup, give a thumbs-up 👍 and share your thoughts or any questions in the comments! Disclaimer: The information and setups shared are for educational purposes only and do not constitute financial advice. Always conduct your own research and analysis before making any trading decisions.
Crypto-By--Ghazi
THETA Breakout Retest Done – Eyeing 20% Pump!

THETA has successfully broken out of its descending trendline (purple) and completed a clean retest. Price is now consolidating above the breakout zone, indicating strength and buyer control. If this level holds, we could see a 15–20% upside move in the short term, with momentum possibly pushing towards the \$0.075–\$0.080 zone. Key Points: * ✅ Trendline breakout confirmed * ✅ Retest completed successfully * 📈 Bullish structure forming on lower timeframes * 🎯 Short-term target: +15–20% from current levels Trading Plan: * Entry: Above breakout & retest level ($0.056–$0.058) * SL: Below retest zone ($0.054–$0.055) * TP1: $0.070 * TP2: $0.078–$0.080 Note: Maintain risk management and trail stop-loss as price moves in your favor.
Crypto-By--Ghazi
Btc Update

BTC is moving within a falling wedge and is making its fourth breakout attempt. A successful breakout and retest of the wedge would confirm a bullish trend, while rejection could signal further movement within the wedge.
Crypto-By--Ghazi
BTC Symmetrical Triangle – Decision Time Soon

BTCUSDT Idea (2H Chart) BTC is consolidating inside a symmetrical triangle, creating pressure for a breakout. Price is currently ranging between 116K–120K, with volatility compressing. Patience is key here — don’t rush entries. A confirmed breakout or breakdown will give the real direction. Break above the triangle = bullish continuation Break below = further correction ahead Wait for 2H close outside the pattern with volume Watch levels: * Upside: 120K → 124K → 128K * Downside: 116K → 112K → 108K Setup is maturing — breakout is just a matter of time. Let the chart lead, not emotions.BTC update This is not a good trading zone right now, better to wait a few hours. 👀 Looking at this chart I’m leaning bearish for now, let’s see how it plays out.
Crypto-By--Ghazi
POWR/USDT IDEA

Pair: POWR/USDT Timeframe: 8H Structure: Descending trendline breakout watch POWR has been moving within a broad descending structure and is now testing the upper trendline with price pushing into the resistance zone around 0.2000. Momentum is building as it tries to break out of the prolonged downtrend. Bullish case: A confirmed breakout above 0.2050 with strong volume could trigger continuation to the upside. If that happens, the next upside levels to watch are 0.2300 and 0.2600. Look for a retest of the breakout level for a safer entry. Bearish case: If POWR fails to sustain above 0.2000 and drops back under 0.1800, we might see selling pressure resume with targets back toward 0.1600 and 0.1500. Price is at a critical decision point. Wait for clear breakout confirmation before taking a position. Set alerts and monitor volume closely.
Disclaimer
Any content and materials included in Sahmeto's website and official communication channels are a compilation of personal opinions and analyses and are not binding. They do not constitute any recommendation for buying, selling, entering or exiting the stock market and cryptocurrency market. Also, all news and analyses included in the website and channels are merely republished information from official and unofficial domestic and foreign sources, and it is obvious that users of the said content are responsible for following up and ensuring the authenticity and accuracy of the materials. Therefore, while disclaiming responsibility, it is declared that the responsibility for any decision-making, action, and potential profit and loss in the capital market and cryptocurrency market lies with the trader.