
OGN
Origin Protocol
| تریدر | نوع سیگنال | حد سود/ضرر | زمان انتشار | مشاهده پیام |
|---|---|---|---|---|
No results found. | ||||
Price Chart of Origin Protocol
سود 3 Months :
سیگنالهای Origin Protocol
Filter
Sort messages by
Trader Type
Time Frame

sladkamala123
رشد انفجاری OGNUSDT: مسیر آینده این ارز دیجیتال چیست؟
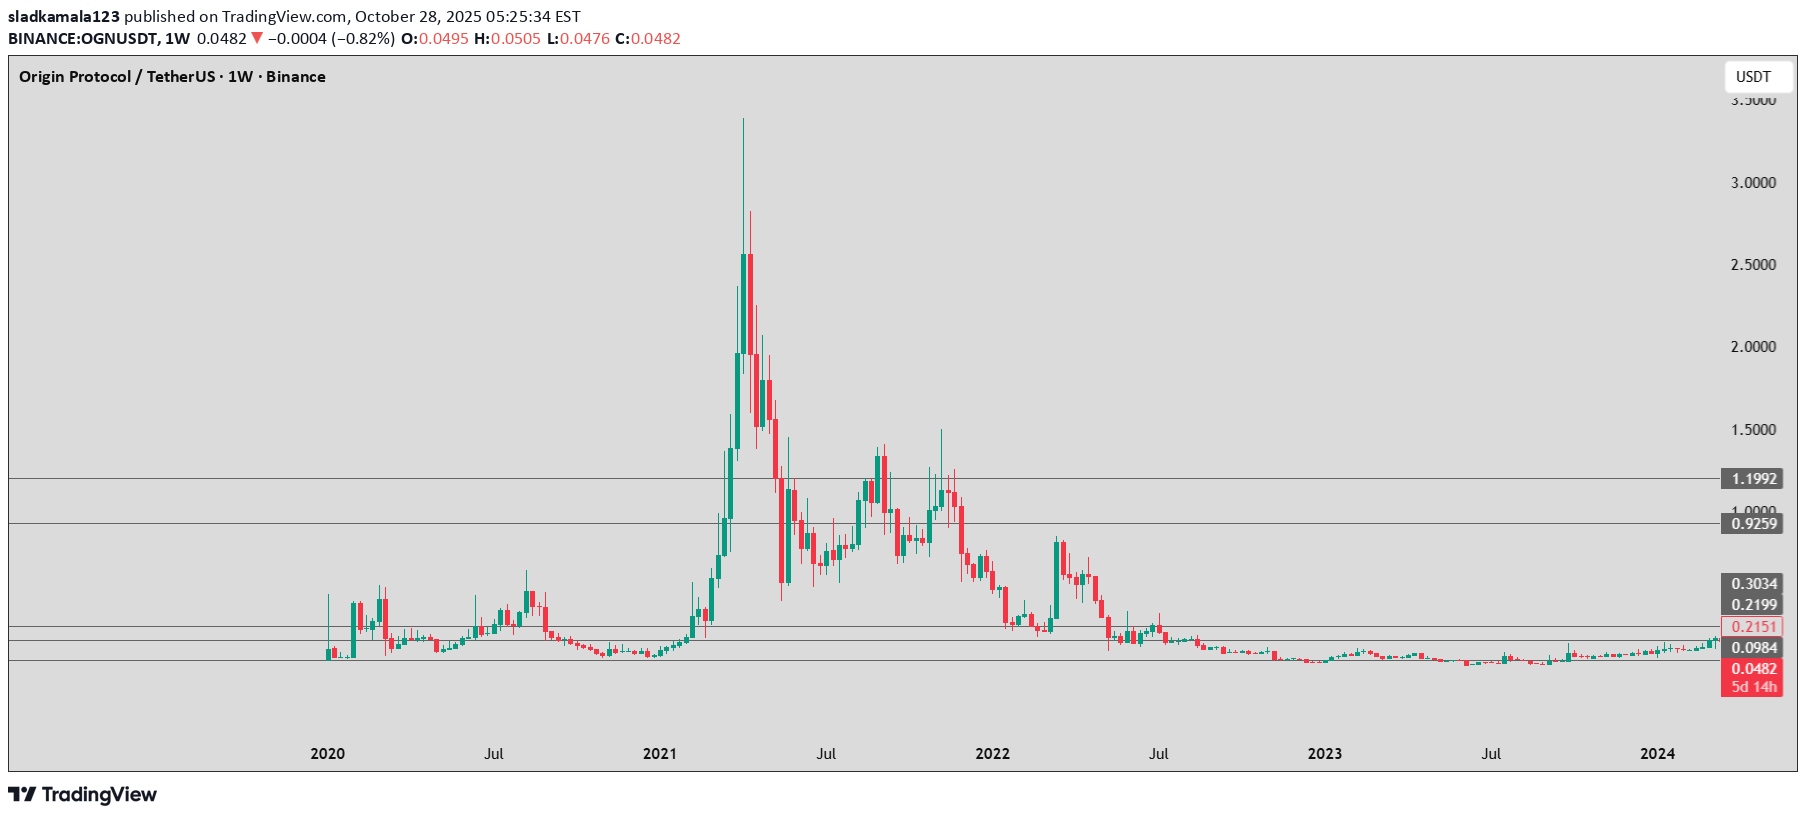
It"s interesting for future growth. The trend is clear. We"ll see where it goes.

ZEUS_Market_Alerts
OGN ANALYSIS
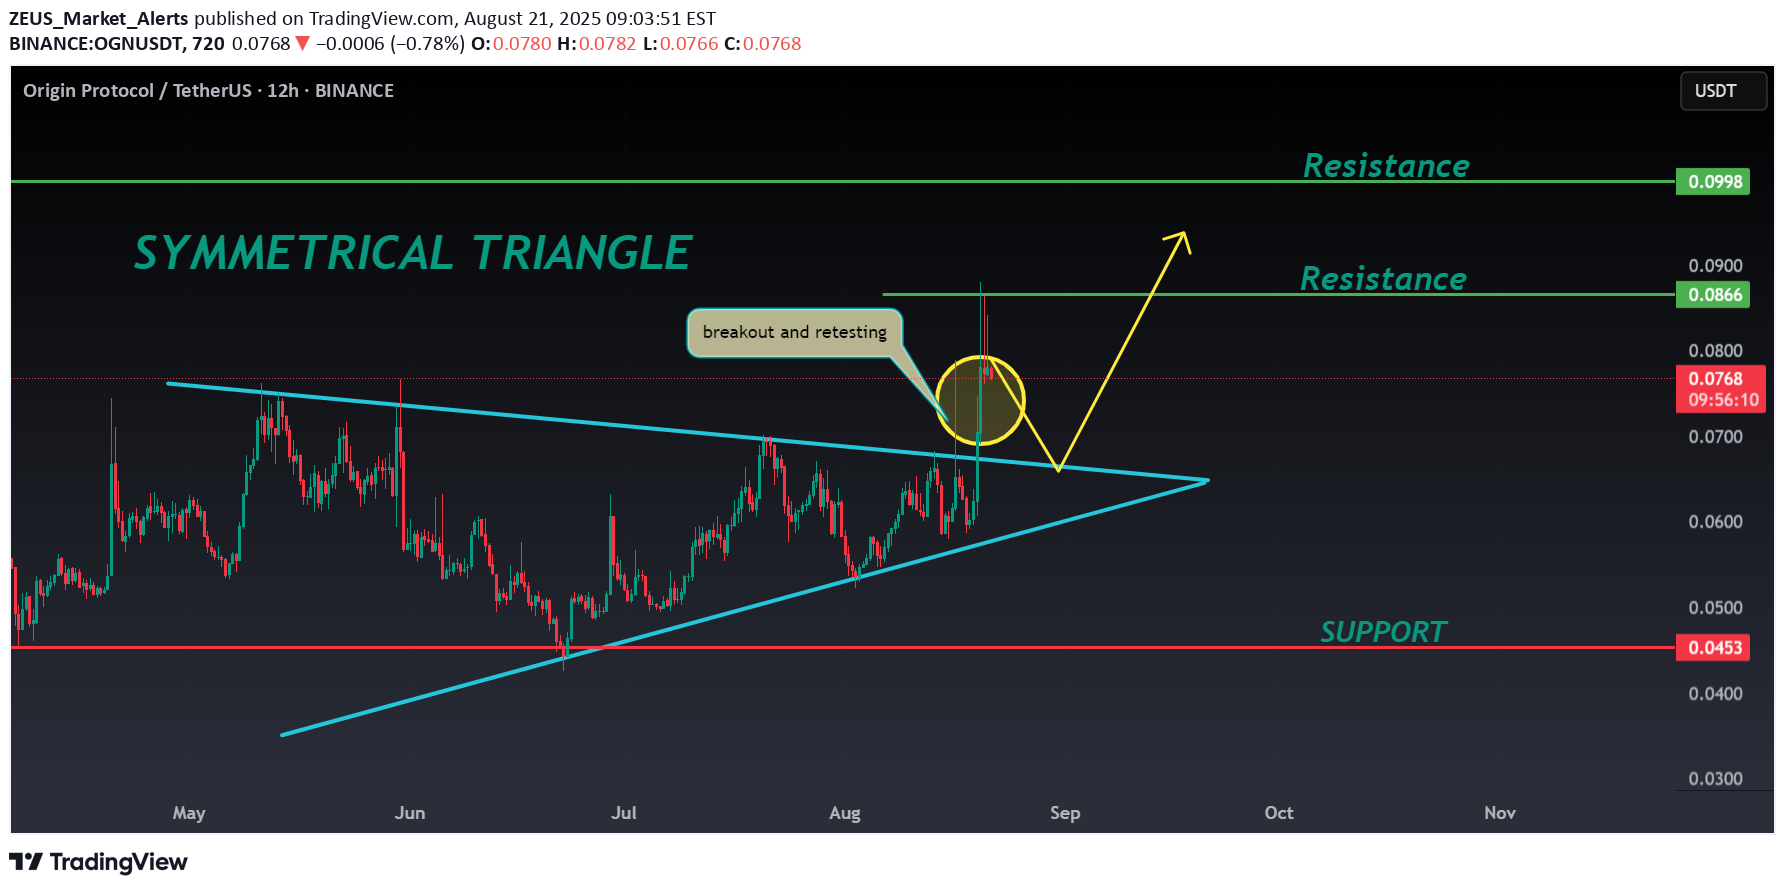
🔮#OGN Analysis 💰💰 #OGN is trading in a symmetrical triangle in a weekly time frame and breakouts with high volume and we could see a bullish momentum in #OGN. Before that we will see little bit bearish movement towards its support zone and that a bullish movement. 🔖 Current Price: $0.0768 ⏳ Target Price: $0.0998 ⁉️ What to do? - We can trade according to the chart and make some profits in #OGN. Keep your eyes on the chart, observe trading volume and stay accustom to market moves.💲💲 🏷Remember, the crypto market is dynamic in nature and changes rapidly, so always use stop loss and take proper knowledge before investments. #OGN #Cryptocurrency #Pump #DYOR

AltcoinPiooners
$OGN Overbought Edge: 4H Trading Breakdown
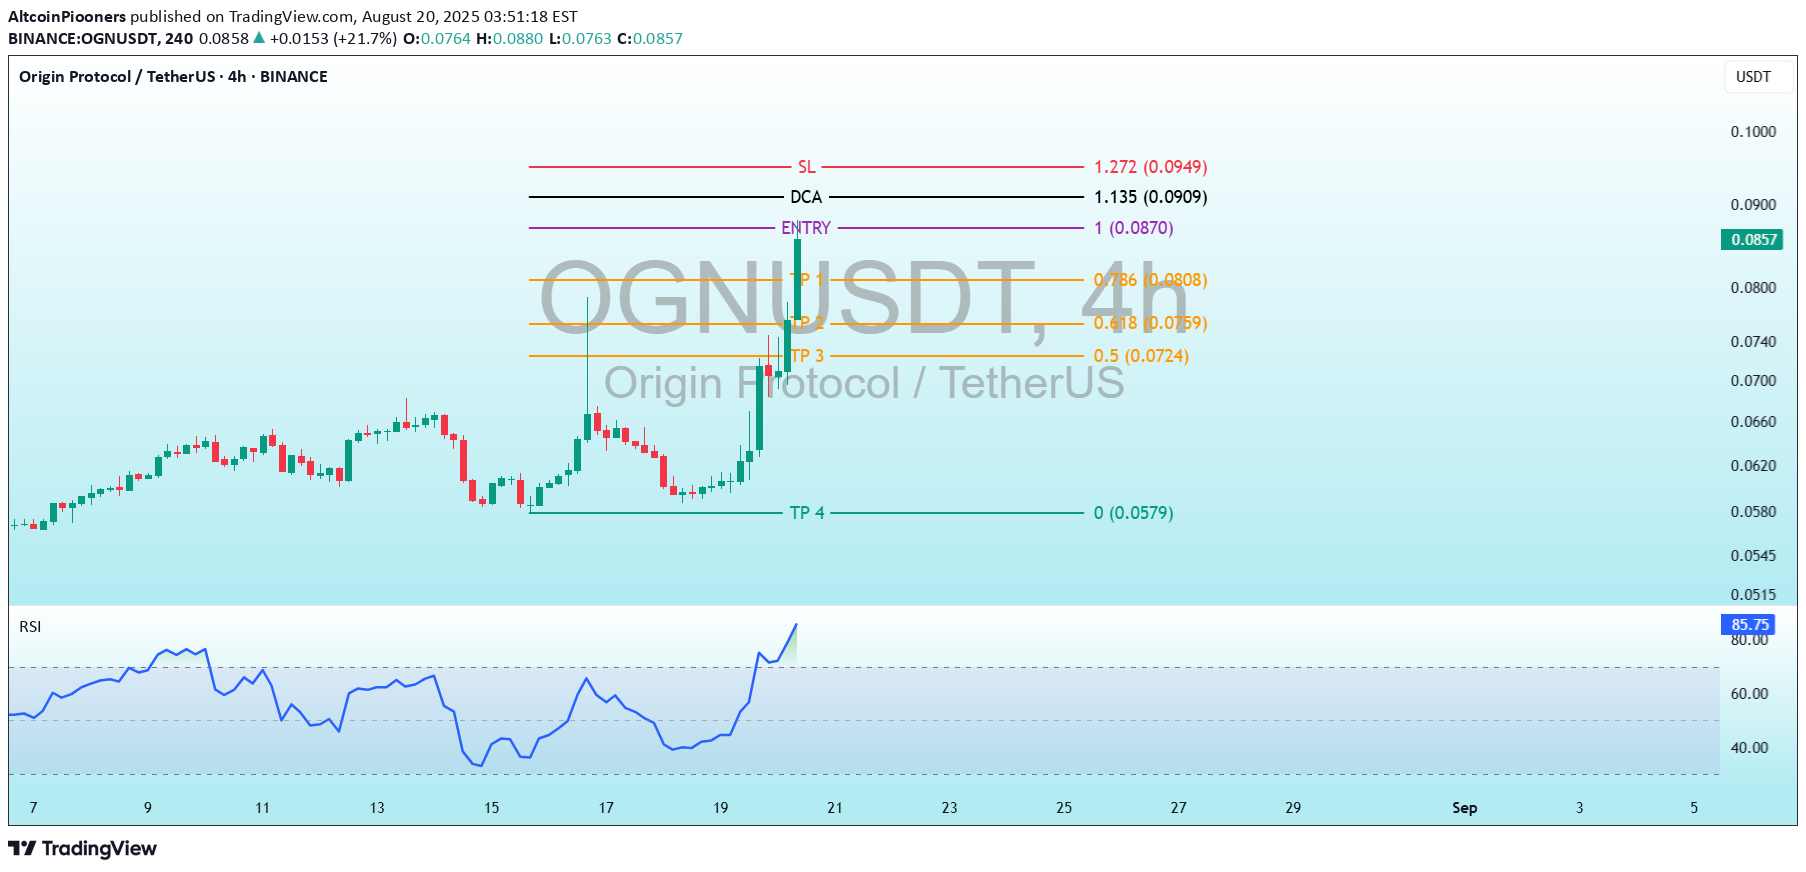
OGNUSDT Trading Levels (Exact Values from the Chart):Entry: 1.00 (0.0870 - 0.0860 USDT) - The planned initial purchase level. DCA (Dollar-Cost Averaging): 1.135 (0.0909 USDT) - An additional buying point if the price rises. SL (Stop Loss): 1.272 (0.0949 USDT) - The level to limit losses. TP (Take Profit):TP1: 0.786 (0.0808 USDT) TP2: 0.618 (0.0759 USDT) TP3: 0.5 (0.0724 USDT) TP4: 0 (0.0579 USDT) - A notably lower target, likely an error or long-term projection. RSI (Relative Strength Index) Indicator: The RSI value is 85.30, which is deeply in the overbought territory (above 70 and nearing 90). This indicates the price was overextended at that time, suggesting a potential reversal or correction. Analysis and Interpretation:Strategy: The chart employs Fibonacci levels to set entry, exit, and loss points. The entry is precisely at 0.0870 - 0.0860 USDT, with a DCA at 0.0909 USDT if the price increases, and a stop loss at 0.0949 USDT to safeguard capital. Profit Targets: TP1 to TP3 are derived from Fibonacci retracement levels (0.786, 0.618, 0.5), reflecting a structured approach to securing profits as the price declines from its peak. TP4 at 0.0452 USDT is significantly below the current price and seems inconsistent, possibly indicating a typo or a long-term speculative target. RSI: The RSI of 85.30 at the chart's timestamp signals a strong overbought condition. Given the 18-hour gap, the RSI may have moderated, but the pullback observed suggests the market may have started correcting. Recommendation: Monitor the current price around the entry level (0.0870 - 0.0860 USDT) and DCA (0.0909 USDT). Since the chart is 18 hours old and the RSI was overbought, the price may have adjusted. The slight pullback at 0.0949 USDT supports this possibility. Exercise caution with new entries and consider checking the latest price and RSI.

chethanlobo11
OGN-BULLISH
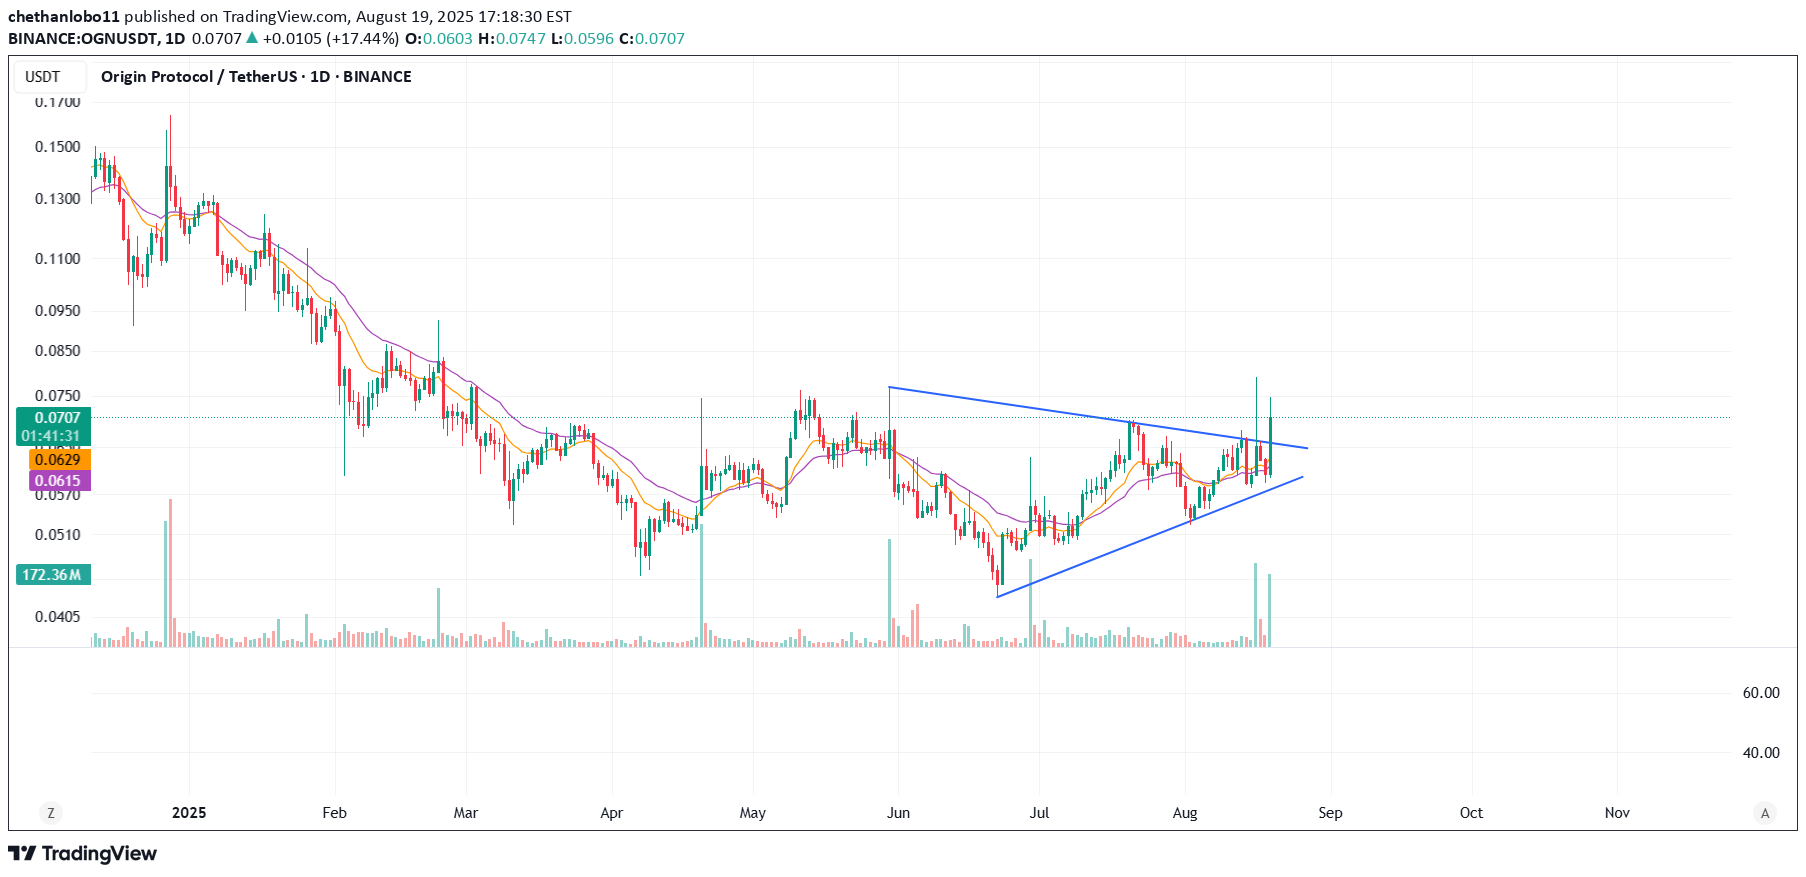
OGN – Symmetrical Triangle Breakout in Play 🚀 Origin Protocol has been consolidating inside a well-defined symmetrical triangle since June, forming higher lows and lower highs. The price is now attempting a breakout with strong daily momentum (+17%). 🔹 Support Zone: $0.062 – $0.064 🔹 Breakout Level / Resistance: $0.072 – $0.075 Bullish Scenario: A confirmed breakout above $0.075, accompanied by increased volume, could trigger a strong move higher. The measured move from the triangle projects targets towards $0.12 – $0.125. Key resistance levels to watch along the way: $0.085 $0.095 – $0.10 Final target: $0.12 Bearish Scenario: If the breakout fails and price closes back below $0.062, the pattern would be invalidated, with possible pullbacks towards $0.055 and $0.048.Two days ago, OGN was testing the breakout zone of its symmetrical triangle. Since then, price has confirmed strength with a decisive close above $0.072–$0.075 and continuation today. Volume has expanded, adding conviction to the breakout. The structure now looks increasingly bullish, with the next Fib retracement levels lining up well with upside targets. 🔹 Support Zone (Confirmed Retest Area): $0.072 – $0.075 🔹 Immediate Resistance Levels: • $0.085 (local high) • $0.095 – $0.10 • $0.12 (triangle measured move + Fib 0.618 zone) ⚡ Bullish Outlook: Continuation above $0.085 opens room for acceleration towards $0.095 – $0.10, with $0.12 remaining the major upside target in this breakout. ⚠️ Bearish Invalidations: If OGN loses the $0.072–$0.075 breakout zone on a daily close, the bullish setup weakens. Below $0.064 would invalidate the breakout entirely and expose $0.055 – $0.048 again. 📊 Bias: Breakout confirmation + volume expansion → bullish momentum intact.

CryptoWithJames
OGNUSDT UPDATE
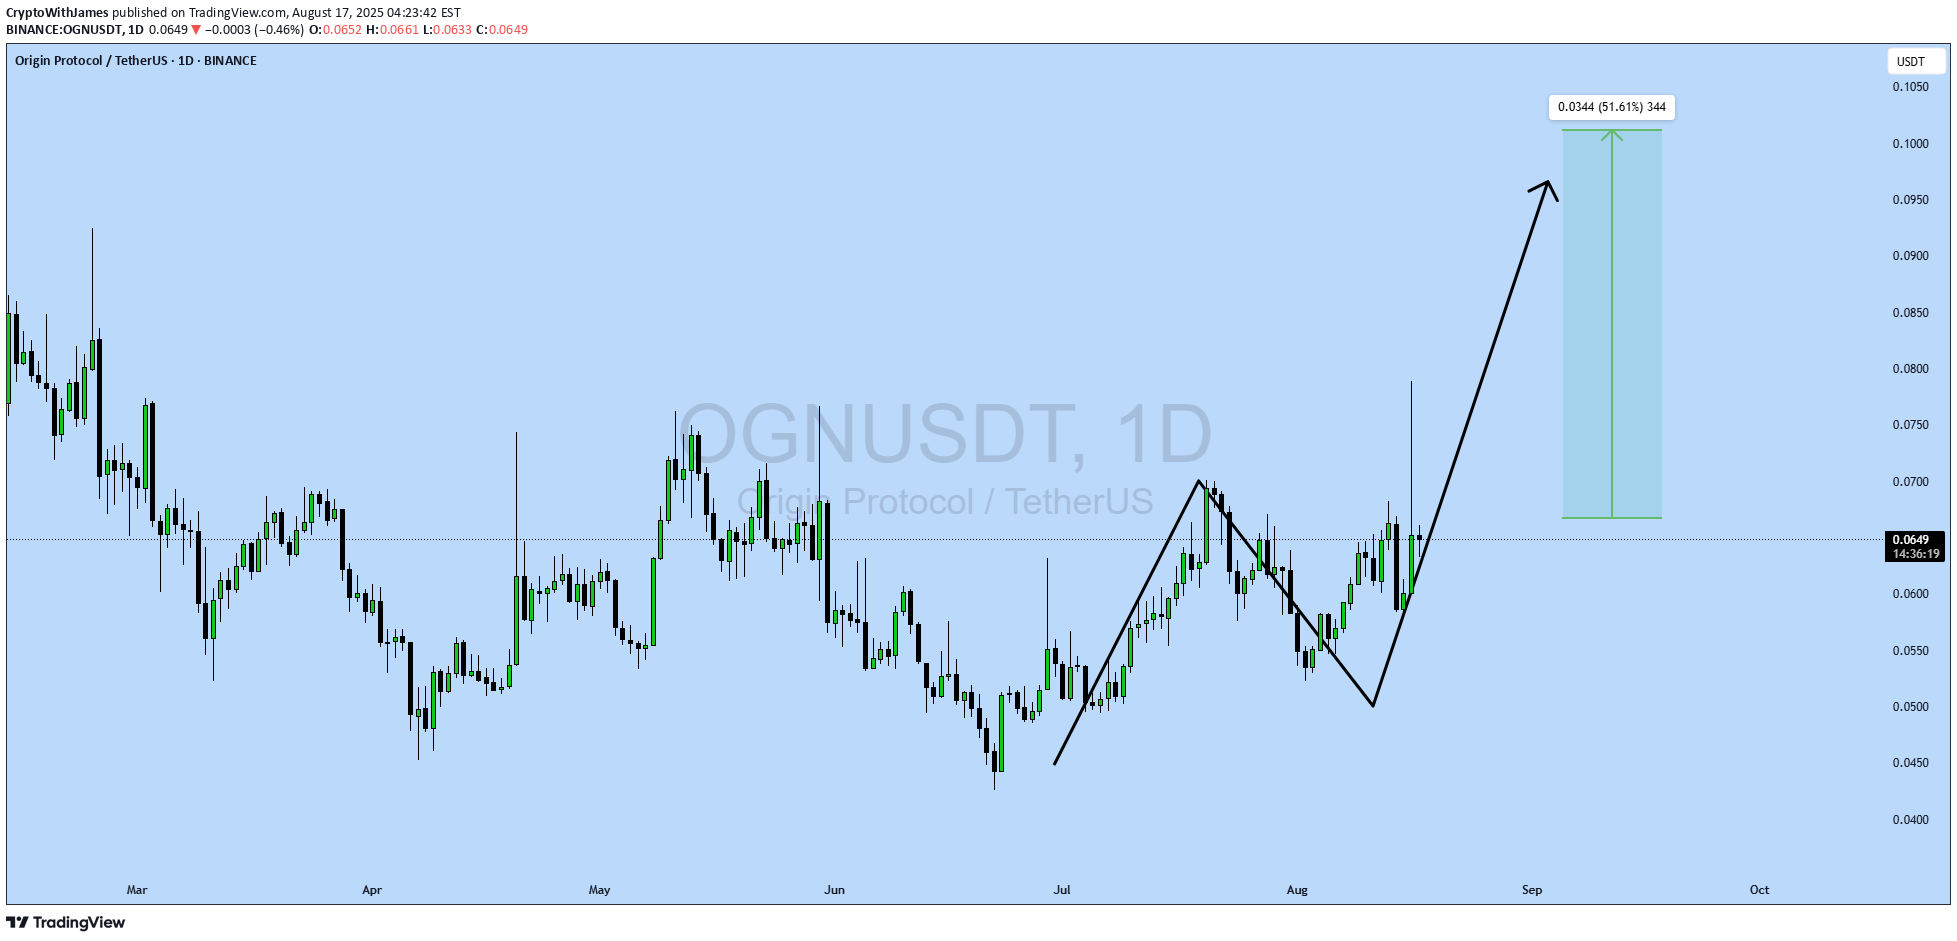
#OGN UPDATE OGN Technical Setup Pattern: Bullish Wave Pattern Current Price: $0.0649 Target Price: $0.10 Target % Gain: 51.61% Technical Analysis: OGN is showing a bullish wave formation on the 1D chart, with higher lows and strong upward momentum. Price has reclaimed key support near $0.06 and is gearing toward the $0.10 resistance zone, confirming bullish continuation. Time Frame: 1D Risk Management Tip: Always use proper risk management.

MyCryptoParadise
#OGN Ready For a Massive Bullish Move | Must Watch For Bulls

Yello, Paradisers! Is #OriginProtocol about to explode to the upside, or is this a bull trap in disguise waiting to liquidate the impatient? Let’s break down what’s brewing on #OGNUSDT: 💎After forming a clean ascending channel, #OGN has been respecting both the ascending resistance and ascending support levels. Price is currently trading just above the 50 EMA, which has been acting as a dynamic support line since early July. This structure shows clear buyer interest around the $0.058–$0.062 zone—an area that aligns with volume cluster support. 💎The bullish scenario remains valid as long as #OGNUSD holds above the demand zone between $0.0499–$0.0580, and especially if it stays above the 50 EMA. As long as this structure is maintained, we could see a bounce toward the moderate resistance level at $0.076, where previous sellers stepped in and price stalled. 💎If buyers can break through that moderate resistance with strength and rising volume, the next key target lies at $0.092, which aligns with a strong resistance level and high-volume node on the visible range. This area is likely to trigger a reaction, so traders should remain agile. 💎However, if price breaks down below the demand zone, this would invalidate the current bullish setup and open the door for a potential move back toward the $0.045–$0.040 area. A broader shakeout would likely accompany this and could trap many late long entries. Stay patient, Paradisers. Let the breakout confirm, and only then do we strike with conviction. MyCryptoParadise iFeel the success🌴💎Boom! #OGNUSDT is dancing to our tune; it followed our projected path and reached above moderate resistance to deliver 68.41% gains. 💎What’s your take on this development? Could we see another breakout soon? Let us know your thoughts below! 👇

Alireza_kamali
$OGN
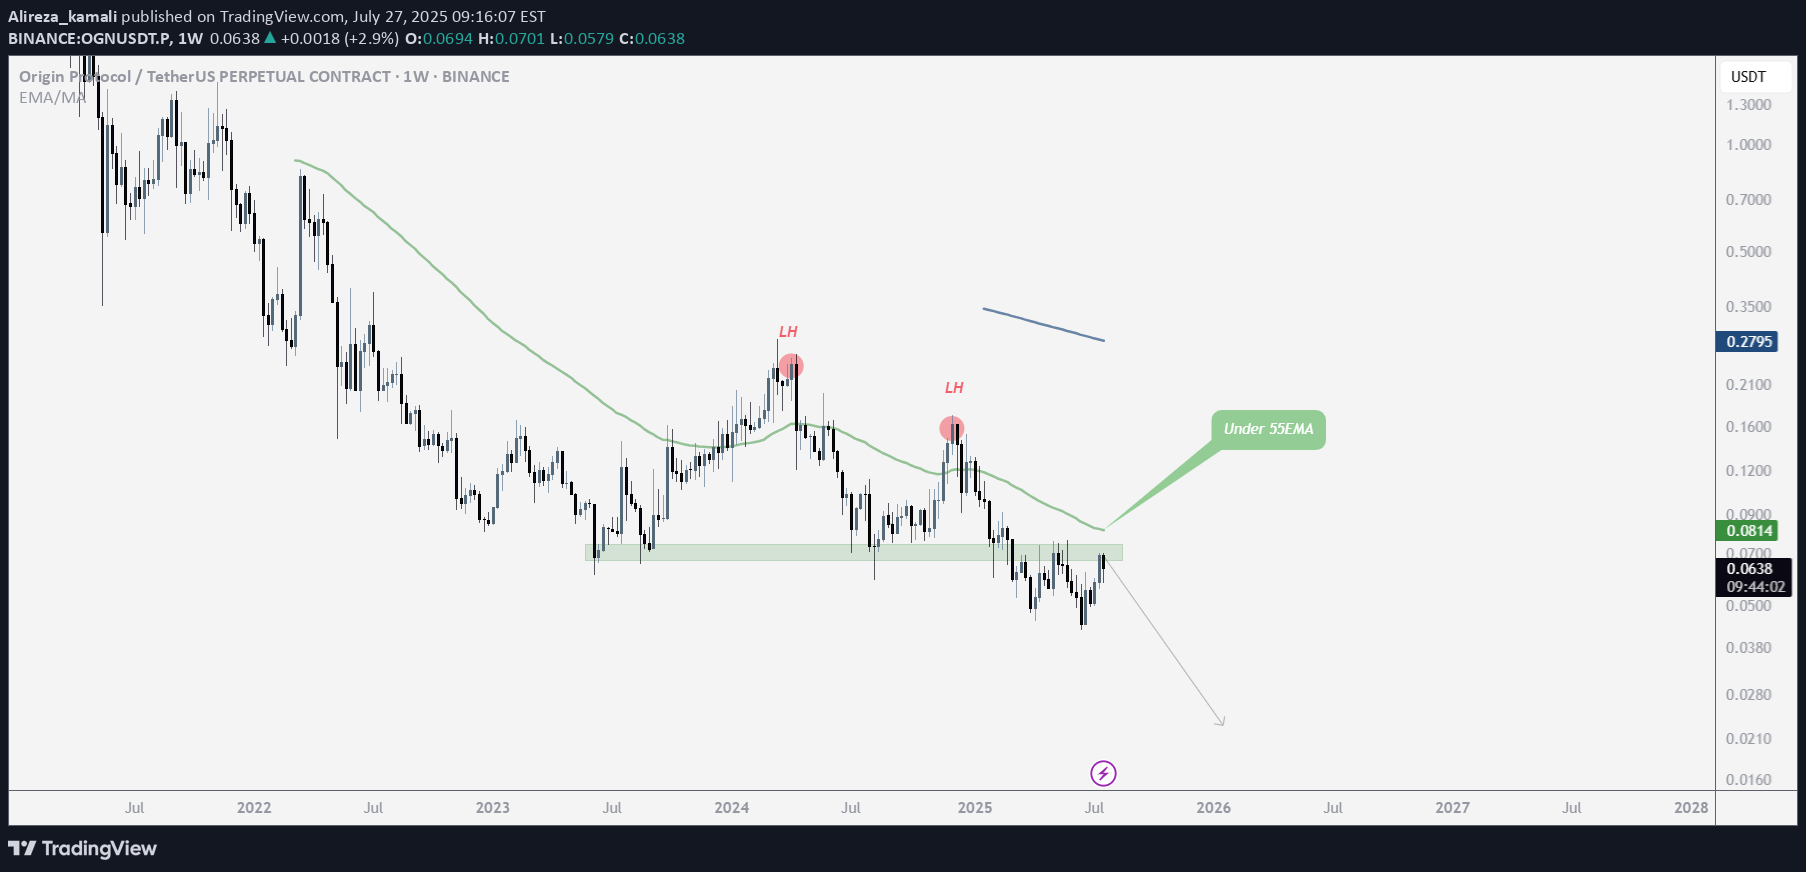
OGN is in a broader downtrend on the weekly timeframe, consistently forming lower highs (LH). This presents a good opportunity to consider entering a short position. It's worth keeping an eye on it

CryptoNuclear
OGNUSDT Breakout Alert Descending Trendline Reversal

📊 Pattern and Market StructureDescending Trendline Breakout:OGN has successfully broken out of a long-standing descending trendline, signaling a potential shift from a bearish to a bullish trend.Strong Accumulation Zone / Key Support:The price has consistently respected the $0.04268 - $0.05402 support area, forming a solid demand zone with multiple rejections and prolonged consolidation.Potential Reversal Formation:A double bottom / base consolidation pattern seems to be forming within the support zone, reinforcing the likelihood of a bullish reversal.📈 Bullish ScenarioIf the breakout is confirmed (price holds above and successfully retests the trendline), the bullish targets will be:1. $0.06229 – minor resistance, likely first retest area.2. $0.07000 - $0.07432 – previous horizontal resistance zone.3. $0.08118 – prior distribution zone.4. $0.09500 - $0.10302 – mid-range supply zone.5. $0.11000 - $0.12733 – medium-term potential target.6. $0.14601 - $0.16232 – longer-term target on strong momentum.📌 A daily candle close above $0.06229 with significant volume could confirm further bullish continuation.📉 Bearish ScenarioIf the breakout turns out to be a false breakout, and price falls back below the support zone ($0.05402):Expect a drop toward:$0.04268 – the next major support level.A breakdown below this may lead to $0.03800 or the formation of a new lower low.Possible bearish triggers:Rejection at $0.06229 or above.Weak breakout volume.Overall bearish sentiment in the crypto market.📌 Conclusion:The descending trendline breakout indicates a potential bullish reversal.Strong support at the base adds confluence to the setup.Bullish scenario currently has higher probability, but confirmation and volume are crucial for sustained upside.#OGNUSDT #CryptoAnalysis #TechnicalAnalysis #AltcoinBreakout #CryptoSignals #BullishReversal #DescendingTrendline #BreakoutAlert #OGN #OriginProtocol

Alpha-GoldFX
OGNUSDT Forming Descending Channel

OGNUSDT is displaying a promising reversal opportunity as it forms a clear descending channel on the daily chart. This technical setup signals that Origin Protocol could be gearing up for a breakout move, especially with the recent price action testing the upper boundary of the channel. A successful breakout above this resistance zone could unlock significant upside potential, setting the stage for a healthy bullish wave that traders will want to monitor closely.Volume analysis for OGNUSDT is equally supportive, showing consistent buying interest that hints at accumulation by investors positioning early for a trend reversal. With good volume backing the price action, the probability of a confirmed breakout above the descending channel increases, which can accelerate momentum buying and attract fresh capital inflows. This kind of setup often draws the attention of swing traders and trend-followers looking for high-probability moves.The expected gain for OGNUSDT in this scenario sits around 60% to 70%+, which is a reasonable target given the recent lows and the potential to reclaim previous levels of support turned resistance. The broader market sentiment towards altcoins is also improving, with many investors rotating funds into projects with strong recovery patterns. Origin Protocol’s fundamentals, coupled with this technical outlook, make it an appealing candidate for medium-term gains.Traders should keep an eye on daily closes above the channel resistance and watch for confirmation signals like retests and continuation candles. Managing risk is key, but with investors taking renewed interest in this project, OGNUSDT is a crypto pair worth keeping on the watchlist for the next breakout phase.✅ Show your support by hitting the like button and✅ Leaving a comment below! (What is You opinion about this Coin)Your feedback and engagement keep me inspired to share more insightful market analysis with you!

MasterAnanda
Origin Protocol 1110% Target Explained & 3000% Prev-Bull Market

Origin Protocol has been moving within a massive broadening channel since December 2022. Now trading within its lower boundary. The upper boundary works as resistance while the lower boundary works as support. Whenever the action starts to happen close to the lower boundary this becomes a buy-opportunity, this entry can be used either for the short- or long-term. With the current market situation, the best focus is long-term. A 6 months time window.Origin Protocol (OGNUSDT) produced a 3,000%+ bullish wave back in the 2021 bull market. We know for a fact now that this pair can produce wild gains. The price that launched this wave was 0.1068, the peak was 3.39. In comparison, the bottom in 2025 stands at 0.0426. The next peak can be anything but we have plenty of room available for growth. On the chart I have a 1,110% target and this is an easy one. This project is likely to grow 2,000% or more. Can be 3,000%. 1,110% is the safe, strong, easy target.Thank you for reading.Namaste.
Disclaimer
Any content and materials included in Sahmeto's website and official communication channels are a compilation of personal opinions and analyses and are not binding. They do not constitute any recommendation for buying, selling, entering or exiting the stock market and cryptocurrency market. Also, all news and analyses included in the website and channels are merely republished information from official and unofficial domestic and foreign sources, and it is obvious that users of the said content are responsible for following up and ensuring the authenticity and accuracy of the materials. Therefore, while disclaiming responsibility, it is declared that the responsibility for any decision-making, action, and potential profit and loss in the capital market and cryptocurrency market lies with the trader.