
chethanlobo11
@t_chethanlobo11

What symbols does the trader recommend buying?
Purchase History
پیام های تریدر
Filter
chethanlobo11
COTI/USDT – Symmetrical Triangle Breakout

COTI has been consolidating inside a symmetrical triangle for several months, with lower highs and higher lows squeezing the price action. 🔎 Key Observations Price has now broken out of the triangle resistance with a strong green daily candle. Volume increased significantly on the breakout, confirming buyer participation. RSI (14) is at 55.9, trending upward and above the neutral 50 mark, showing improving momentum. Price is currently trading at $0.0551, above the key breakout zone around $0.052 – $0.053. 📊 Bullish Scenario Holding above $0.052 keeps the breakout valid. First resistance: $0.060 Next resistance: $0.070 (major psychological level). Break and close above $0.070 could open the path toward $0.080 – $0.090. ⚠️ Bearish Scenario If price falls back below $0.052, it may re-enter the triangle range. Key supports: $0.050 – $0.048 $0.045 (triangle base and crucial support) A breakdown below $0.045 would invalidate the bullish setup.
chethanlobo11
DOGE/USDT: Symmetrical Triangle Coils for a Major Breakout

The DOGE/USDT pair is in a long-term symmetrical triangle pattern, a classic continuation pattern that suggests a significant price movement is imminent. This pattern is formed by a series of lower highs and higher lows, creating a narrowing trading range. The price is currently at a critical decision point, testing the upper resistance line of the triangle. Key Technical Analysis: Symmetrical Triangle Pattern: This pattern has been forming since mid-2020. The base of this triangle, from the low around $0.0011 to the high near $0.45, represents a massive price range. Target Price Calculation: The standard way to calculate a target price for a symmetrical triangle breakout is to measure the height of the pattern's base and project it from the breakout point. Base Height: The widest part of the triangle spans from approximately $0.0011 to $0.45, a difference of about $0.4489. Breakout Point: A confirmed breakout would likely occur above the current resistance level, which is near $0.295. Target Price: Projecting the base height from the breakout point ($0.295 + $0.4489) gives us a long-term target of approximately $0.7439. Potential Scenarios & Trade Plan: Bullish Scenario: A decisive close above the triangle's upper trend line, ideally with a significant increase in volume, would confirm a bullish breakout. Entry: A confirmed breakout and retest of the upper trend line as support. Target: The first major target is $0.7439. Subsequent targets would be the all-time high and potential price discovery beyond that. Invalidation/Stop-Loss: A move back inside the triangle or a close below the lower trend line would invalidate the bullish thesis. A tight stop-loss could be placed just below the breakout level. Bearish Scenario: A breakdown below the triangle's lower trend line, particularly on high volume, would be a strong bearish signal.
chethanlobo11
CHZ
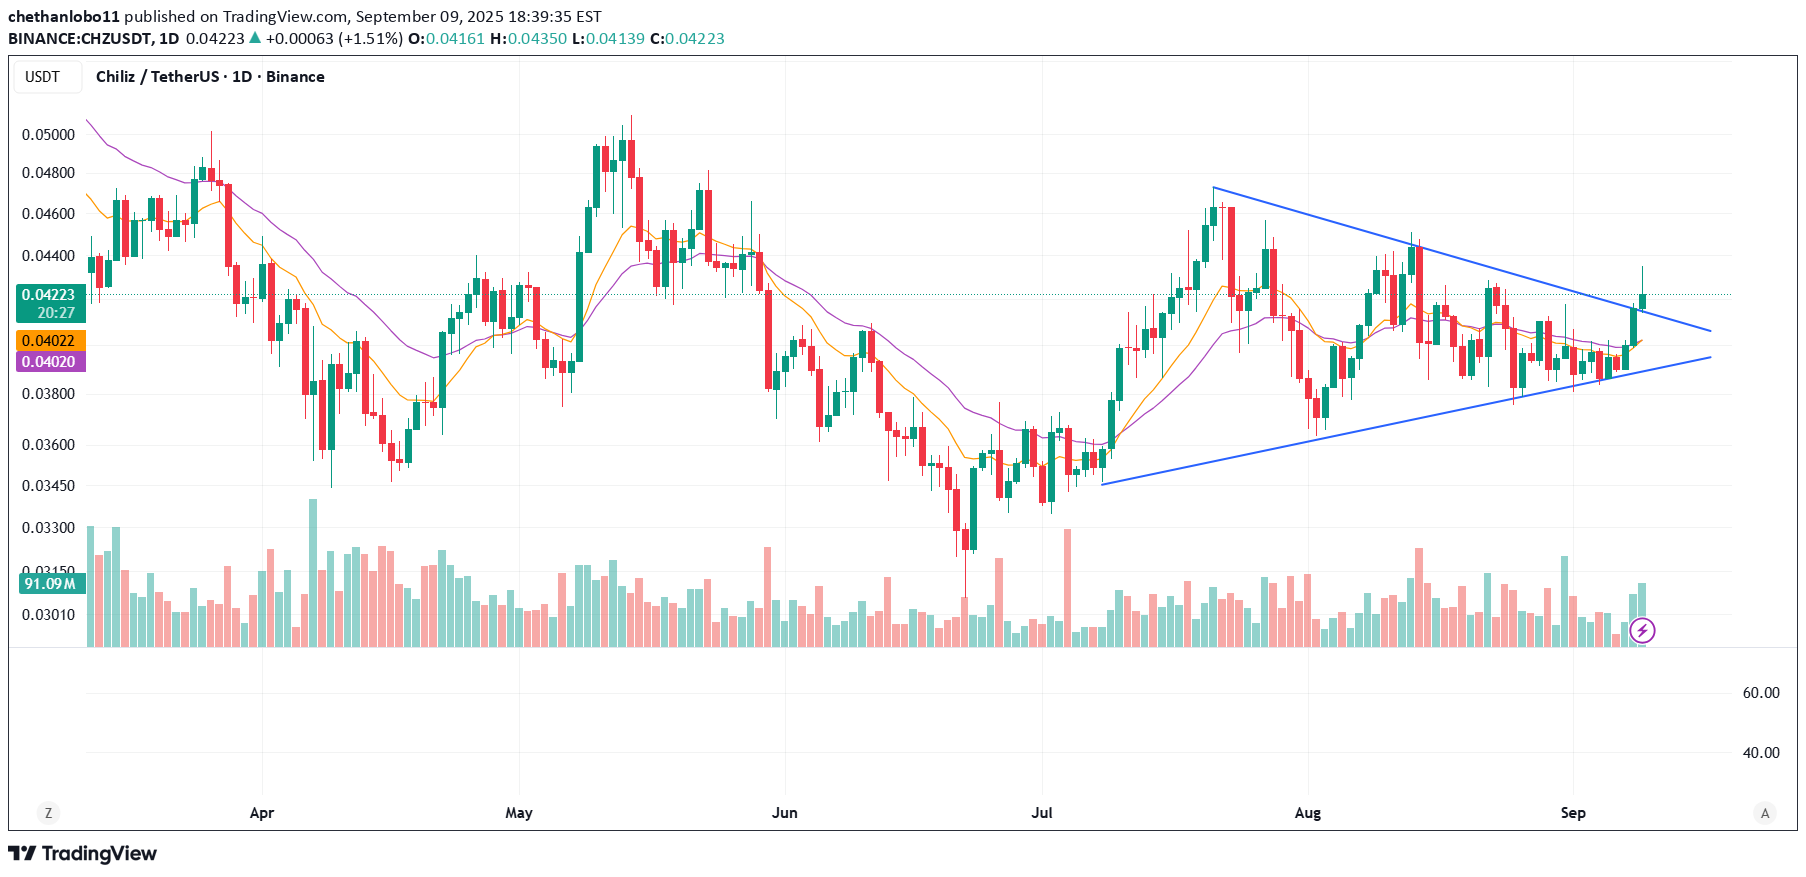
🔍 Technical Analysis Pattern – Symmetrical Triangle Price has been consolidating inside a symmetrical triangle (blue trendlines). These triangles usually indicate a continuation pattern, but since CHZ was in a sideways-to-down trend before, breakout direction is crucial. Breakout The latest candle has broken out above the upper trendline with good bullish momentum. Volume is higher than previous sessions → confirming breakout strength. Moving Averages Short-term MA (orange) and longer-term MA (purple) are flat but now starting to curve upward. Price has closed above both MAs, strengthening bullish sentiment. Support & Resistance Immediate support: ~0.041 USDT (former triangle resistance, now turned into support). First resistance: ~0.0445 – 0.045 USDT (recent swing highs). Next resistance: ~0.048 – 0.050 USDT (psychological level). Volume A clear increase in volume during breakout, which is key for validation. 📈 Scenarios Bullish Case (likely): If price sustains above 0.041 USDT, breakout could push CHZ toward 0.045 and possibly 0.048 – 0.050 in the short term. Bearish Case (risk): If price falls back below 0.041, the breakout may turn into a fakeout, sending price back into the triangle (bearish).
chethanlobo11
Floki- Symmetrical Triangle, Big Move ahead

FLOKI has been consolidating for months inside a symmetrical triangle on the daily chart. The range is getting tighter, suggesting a large breakout move is near. 🔹 Pattern Higher lows + lower highs forming a triangle structure. Volume gradually declining, a typical pre-breakout signal. 🔹 Key Levels Support (lower trendline): 0.0000100 – 0.0000105 Resistance (upper trendline): 0.0000125 – 0.0000130 🔹 Targets on Breakout Bullish breakout: 0.0000140 → 0.0000160 → 0.0000185 Bearish breakdown: 0.0000090 → 0.0000075 📌 Outlook: FLOKI is in a make-or-break zone. A daily close above 0.0000130 with volume could fuel a strong bullish rally. Failure to hold support at 0.0000100 may lead to downside.
chethanlobo11
DOGE - SYMMETRICAL TRIANGLE FORMING

DOGE has been consolidating inside a symmetrical triangle on the daily timeframe. This pattern shows higher lows and lower highs, suggesting compression before a decisive move. 🔹 Pattern Price is cooling between support and resistance trendlines. Volume has been declining, which is typical before a breakout. 🔹 Key Levels Support (lower trendline): 0.20 – 0.21 Resistance (upper trendline): 0.25 – 0.26 🔹 Targets on Breakout Bullish breakout: 0.28 → 0.32 → 0.36 Bearish breakdown: 0.19 → 0.16
chethanlobo11
FIO

FIO has been consolidating in a symmetrical triangle since April, with lower highs and higher lows compressing price into a tight apex. Recently, price broke above the upper trendline near 0.0205 and is now retesting the breakout zone around 0.019–0.020. 📊 Technical Outlook Triangle breakout confirmed with volume expansion. Current retest is on lighter volume, which is constructive. Short-term MAs are flipped beneath price, supporting bullish structure. 📈 Upside levels to watch 0.0215–0.0220 (immediate resistance) 0.0240–0.0255 0.0280–0.0300 0.0330–0.0350 🔎 Measured Move Target Triangle height ≈ 0.019 Breakout projection → 0.0205 + 0.019 ≈ 0.039–0.040 ⚠️ Invalidation Daily close below 0.0185 risks a failed breakout and return inside the pattern. Deeper breakdown <0.0170 opens 0.0150.
chethanlobo11
HBAR-SYMMETRICAL TRIANGLE BREAKOUT

Hedera has been consolidating inside a massive symmetrical triangle since late 2023. The structure is clear, with higher lows from November 2023 and lower highs from April 2024. Price is now trading near the apex, suggesting a decisive move is imminent. 🔹 Support Zone: $0.20 – $0.21 🔹 Resistance Zone: $0.25 – $0.27 Bullish Scenario: A confirmed breakout above $0.27 with strong volume could trigger a major rally. The measured move from the triangle projects targets towards $0.55 – $0.60. Key resistance levels to watch on the way up: $0.30 $0.35 $0.45 Final target: $0.55+ Bearish Scenario: If price breaks below $0.20, the triangle setup would fail, with possible pullbacks towards $0.18 → $0.15 → $0.12.
chethanlobo11
OGN-BULLISH
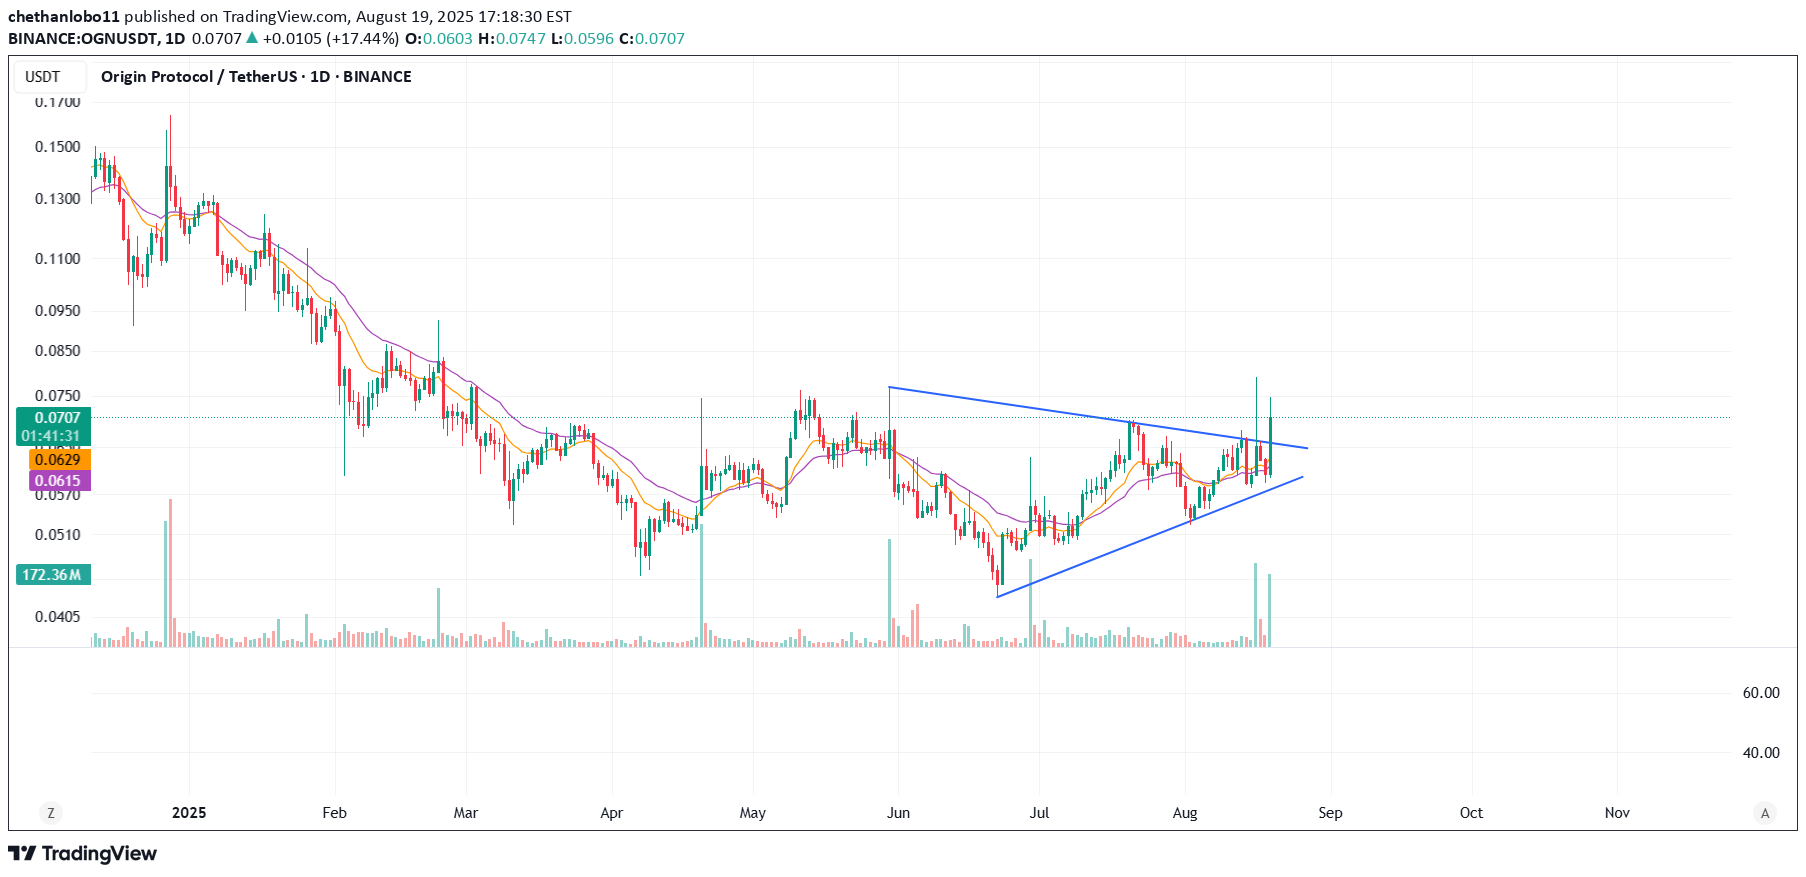
OGN – Symmetrical Triangle Breakout in Play 🚀 Origin Protocol has been consolidating inside a well-defined symmetrical triangle since June, forming higher lows and lower highs. The price is now attempting a breakout with strong daily momentum (+17%). 🔹 Support Zone: $0.062 – $0.064 🔹 Breakout Level / Resistance: $0.072 – $0.075 Bullish Scenario: A confirmed breakout above $0.075, accompanied by increased volume, could trigger a strong move higher. The measured move from the triangle projects targets towards $0.12 – $0.125. Key resistance levels to watch along the way: $0.085 $0.095 – $0.10 Final target: $0.12 Bearish Scenario: If the breakout fails and price closes back below $0.062, the pattern would be invalidated, with possible pullbacks towards $0.055 and $0.048.Two days ago, OGN was testing the breakout zone of its symmetrical triangle. Since then, price has confirmed strength with a decisive close above $0.072–$0.075 and continuation today. Volume has expanded, adding conviction to the breakout. The structure now looks increasingly bullish, with the next Fib retracement levels lining up well with upside targets. 🔹 Support Zone (Confirmed Retest Area): $0.072 – $0.075 🔹 Immediate Resistance Levels: • $0.085 (local high) • $0.095 – $0.10 • $0.12 (triangle measured move + Fib 0.618 zone) ⚡ Bullish Outlook: Continuation above $0.085 opens room for acceleration towards $0.095 – $0.10, with $0.12 remaining the major upside target in this breakout. ⚠️ Bearish Invalidations: If OGN loses the $0.072–$0.075 breakout zone on a daily close, the bullish setup weakens. Below $0.064 would invalidate the breakout entirely and expose $0.055 – $0.048 again. 📊 Bias: Breakout confirmation + volume expansion → bullish momentum intact.
chethanlobo11
BAL
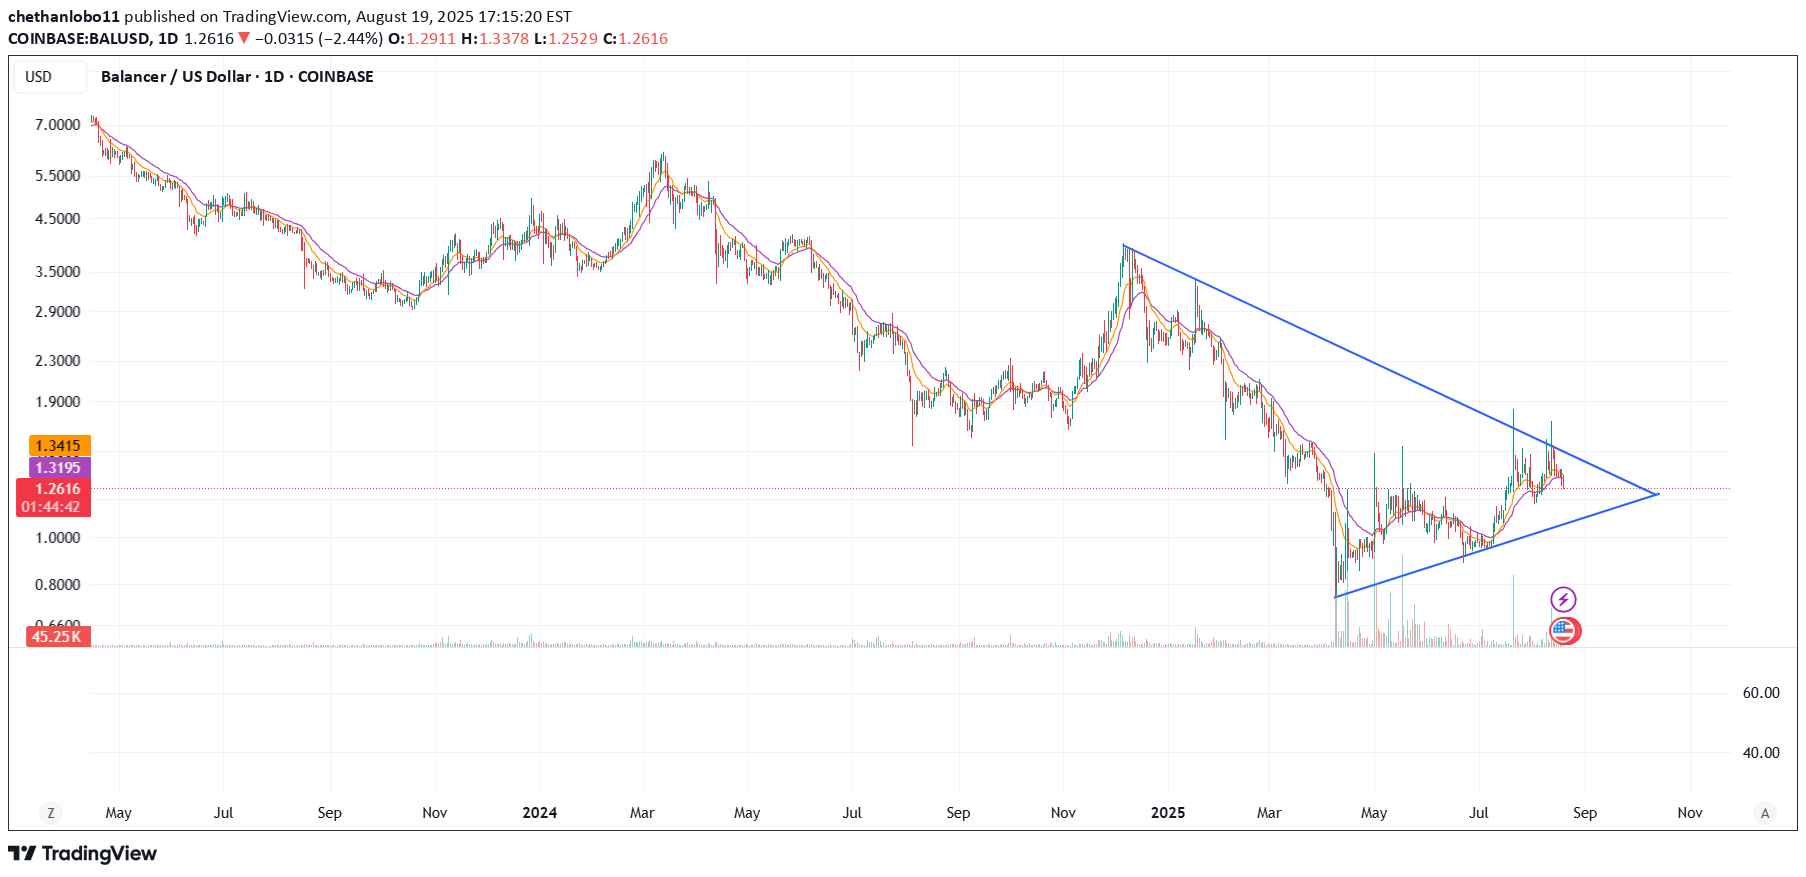
BAL/USDT – Symmetrical Triangle Breakout Watch 🚀 Balancer is currently trading inside a well-formed symmetrical triangle on the daily timeframe. The price has been consolidating between $1.10 support and $1.50 resistance, and is now approaching the apex of the pattern – a breakout move looks imminent. 🔹 Pattern: Symmetrical Triangle (valid structure, converging trendlines) 🔹 Support: ~$1.10 – $1.15 🔹 Resistance: ~$1.45 – $1.50 Breakout Scenarios: ✅ Bullish Case: A decisive breakout above $1.50 with strong volume could trigger a rally. Based on the triangle’s height, the measured move target projects towards $4.00 – $4.80. Key levels to watch on the way up are $1.90 → $2.30 → $3.00. ❌ Bearish Case: A breakdown below $1.10 may invalidate the setup, with possible retests of $0.85 and even $0.65.
Disclaimer
Any content and materials included in Sahmeto's website and official communication channels are a compilation of personal opinions and analyses and are not binding. They do not constitute any recommendation for buying, selling, entering or exiting the stock market and cryptocurrency market. Also, all news and analyses included in the website and channels are merely republished information from official and unofficial domestic and foreign sources, and it is obvious that users of the said content are responsible for following up and ensuring the authenticity and accuracy of the materials. Therefore, while disclaiming responsibility, it is declared that the responsibility for any decision-making, action, and potential profit and loss in the capital market and cryptocurrency market lies with the trader.