Technical analysis by chethanlobo11 about Symbol CHZ on 9/9/2025

chethanlobo11
CHZ
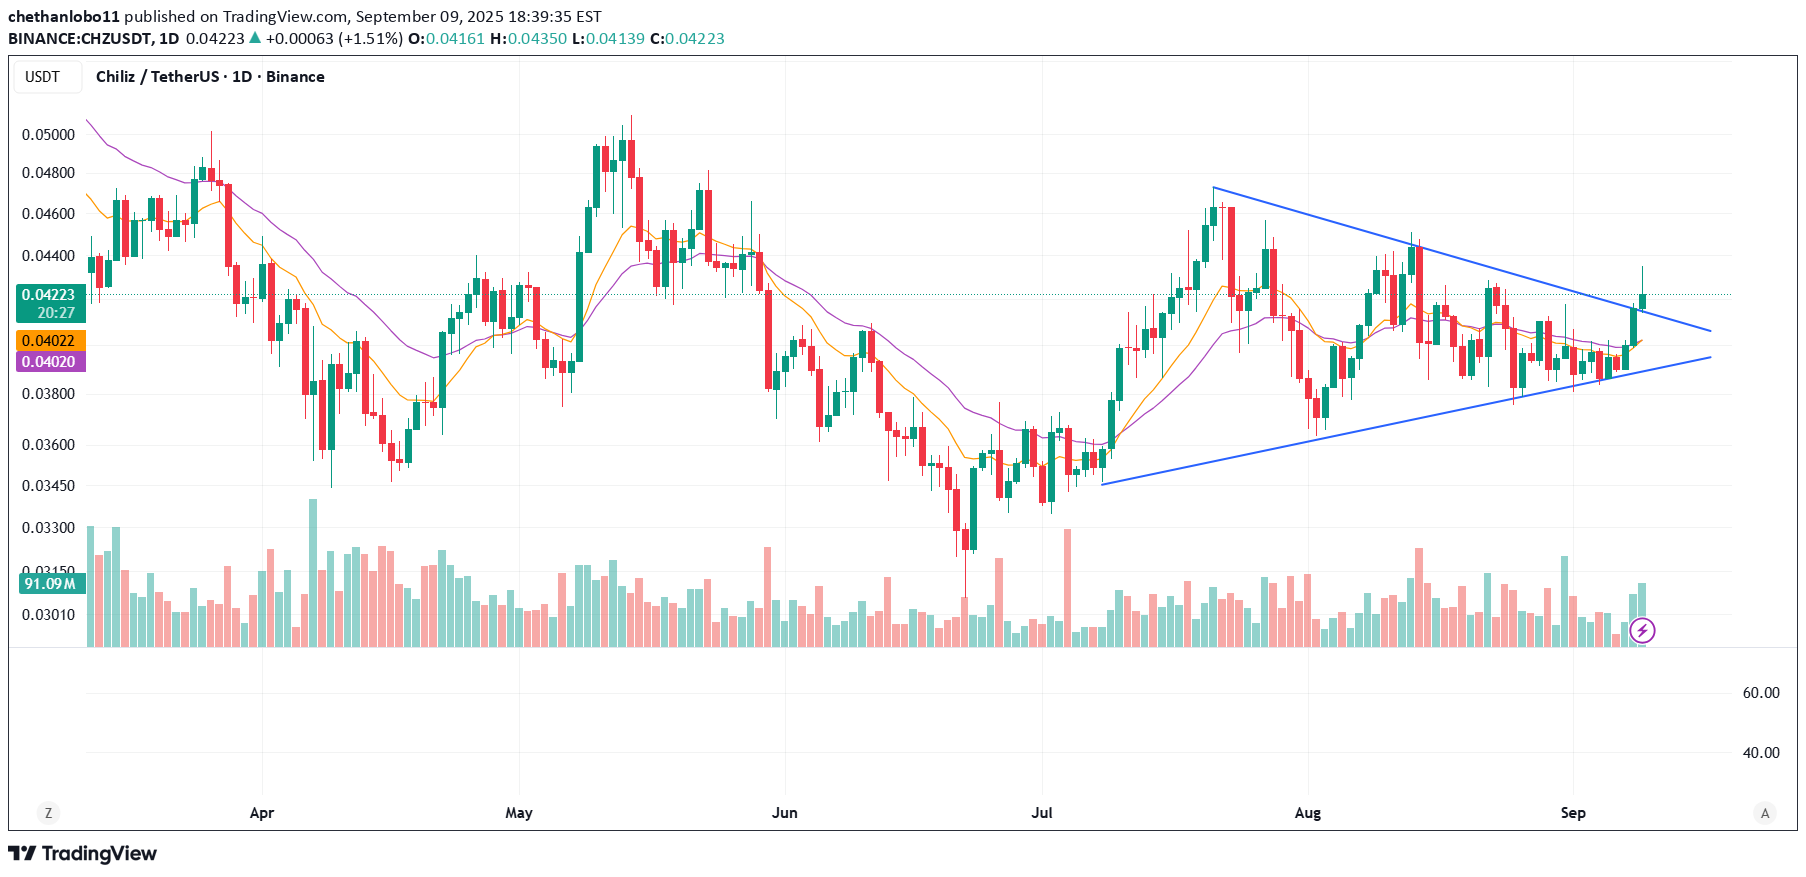
🔍 Technical Analysis Pattern – Symmetrical Triangle Price has been consolidating inside a symmetrical triangle (blue trendlines). These triangles usually indicate a continuation pattern, but since CHZ was in a sideways-to-down trend before, breakout direction is crucial. Breakout The latest candle has broken out above the upper trendline with good bullish momentum. Volume is higher than previous sessions → confirming breakout strength. Moving Averages Short-term MA (orange) and longer-term MA (purple) are flat but now starting to curve upward. Price has closed above both MAs, strengthening bullish sentiment. Support & Resistance Immediate support: ~0.041 USDT (former triangle resistance, now turned into support). First resistance: ~0.0445 – 0.045 USDT (recent swing highs). Next resistance: ~0.048 – 0.050 USDT (psychological level). Volume A clear increase in volume during breakout, which is key for validation. 📈 Scenarios Bullish Case (likely): If price sustains above 0.041 USDT, breakout could push CHZ toward 0.045 and possibly 0.048 – 0.050 in the short term. Bearish Case (risk): If price falls back below 0.041, the breakout may turn into a fakeout, sending price back into the triangle (bearish).