
ZEUS_Market_Alerts
@t_ZEUS_Market_Alerts

What symbols does the trader recommend buying?
Purchase History
پیام های تریدر
Filter
ZEUS_Market_Alerts
تحلیل فلۆکی: آیا زمان ورود فرا رسیده است؟ پیشبینی قیمت و اهداف صعودی!

📊 #FLOKI Analysis ✅There is a formation of Falling Wedge Pattern on daily chart with a breakout and currently pullback from its major resistance zone 🧐 Pattern signals potential bullish movement incoming in few days 👀Current Price: $0.00010 🚀 Target Price: $0.00015 ⚡️What to do ? 👀Keep an eye on #FLOKI price action and volume. We can trade according to the chart and make some profits⚡️⚡️ #FLOKI #Cryptocurrency #TechnicalAnalysis #DYOR
ZEUS_Market_Alerts
تحلیل تکنیکال فیچر (FET): مثلث نزولی شکل گرفت؛ آیا رشد انفجاری در راه است؟

📊#FET Analysis ✅There is a formation of Descending triangle pattern on daily chart🧐 Pattern signals potential bullish movement incoming after the breakout of the pattern 👀Current Price: $0.600 🚀 Target Price: $0.700 ⚡️What to do ? 👀Keep an eye on #FET price action and volume. We can trade according to the chart and make some profits⚡️⚡️ #FET #Cryptocurrency #TechnicalAnalysis #DYOR
ZEUS_Market_Alerts
تحلیل بیتکوین امروز: منتظر ریزش باشیم یا صعود بزرگ؟ سطوح حیاتی و نقاط ورود!

🔮 #BTC Analysis 🚀🚀 💲💲 #BTC is trading between support and resistance area. There is a potential rejection again from its resistance zone and pullback from support zone. If #BTC breaks the major resistance zone then we would see a bullish move or else we will get a downfall towards its major support zone 💸Current Price -- $1,21,800 ⁉️ What to do? - We have marked crucial levels in the chart [ #BTC ]. We can trade according to the chart and make some profits. 🚀💸 #BTC #Cryptocurrency #DYOR
ZEUS_Market_Alerts
ACE ANALYSIS
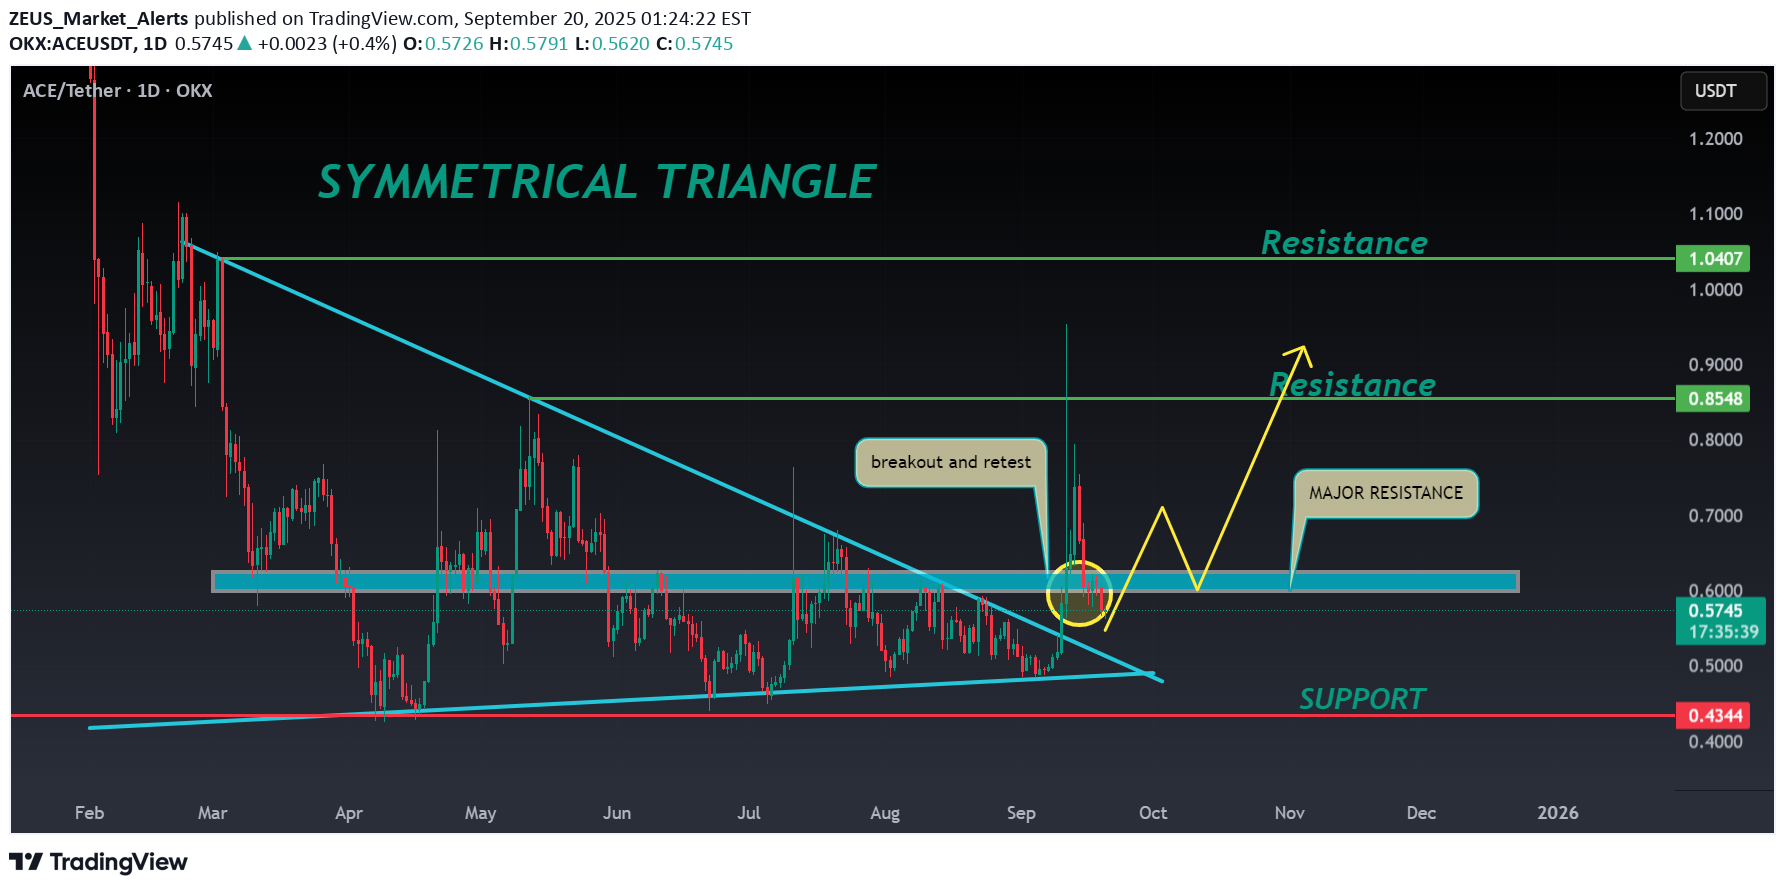
🔮#ACE Analysis 💰💰 #ACE is trading in a symmetrical triangle in a weekly time frame and breakouts with high volume and we could see a bullish momentum in #ACE. Before that we will see little bit retest and then bullish movement 🔖 Current Price: $0.5745 ⏳ Target Price: $0.8548 ⁉️ What to do? - We can trade according to the chart and make some profits in #ACE. Keep your eyes on the chart, observe trading volume and stay accustom to market moves.💲💲 #ACE #Cryptocurrency #Pump #DYOR
ZEUS_Market_Alerts
JOE ANALYSIS
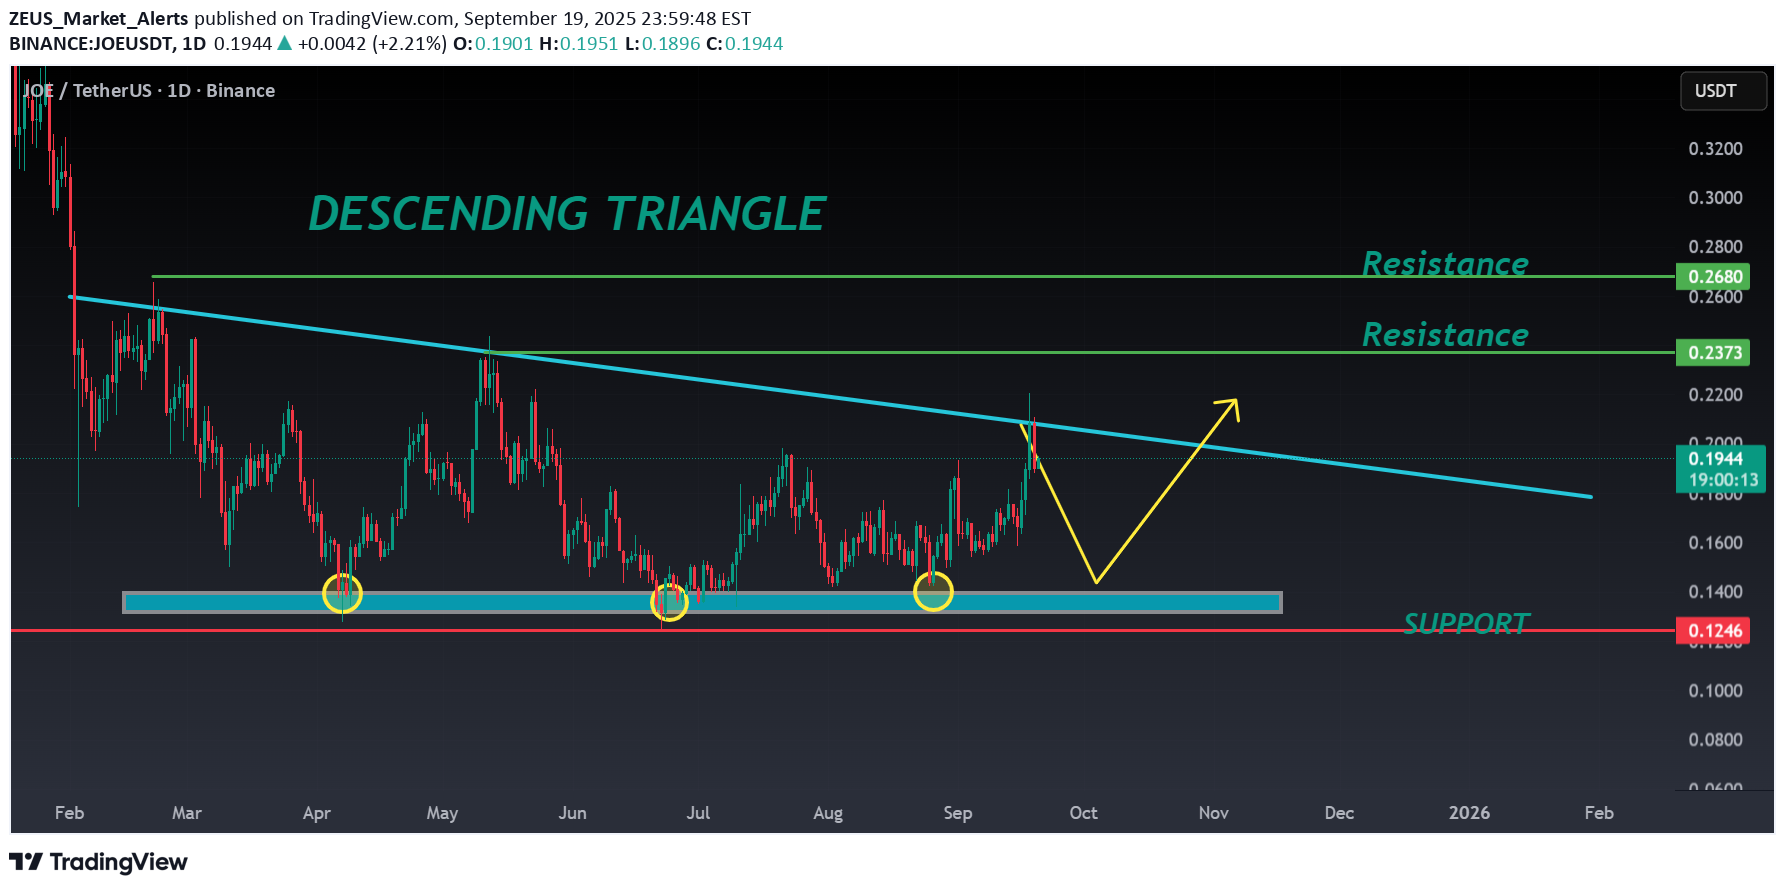
📊#JOE Analysis ✅There is a formation of Descending triangle pattern on daily chart🧐 Pattern signals potential bullish movement incoming after a small retest 📉 👀Current Price: $0.1944 🚀 Target Price: $0.2370 ⚡️What to do ? 👀Keep an eye on #JOE price action and volume. We can trade according to the chart and make some profits⚡️⚡️ #JOE #Cryptocurrency #TechnicalAnalysis #DYOR
ZEUS_Market_Alerts
NEAR ANALYSIS
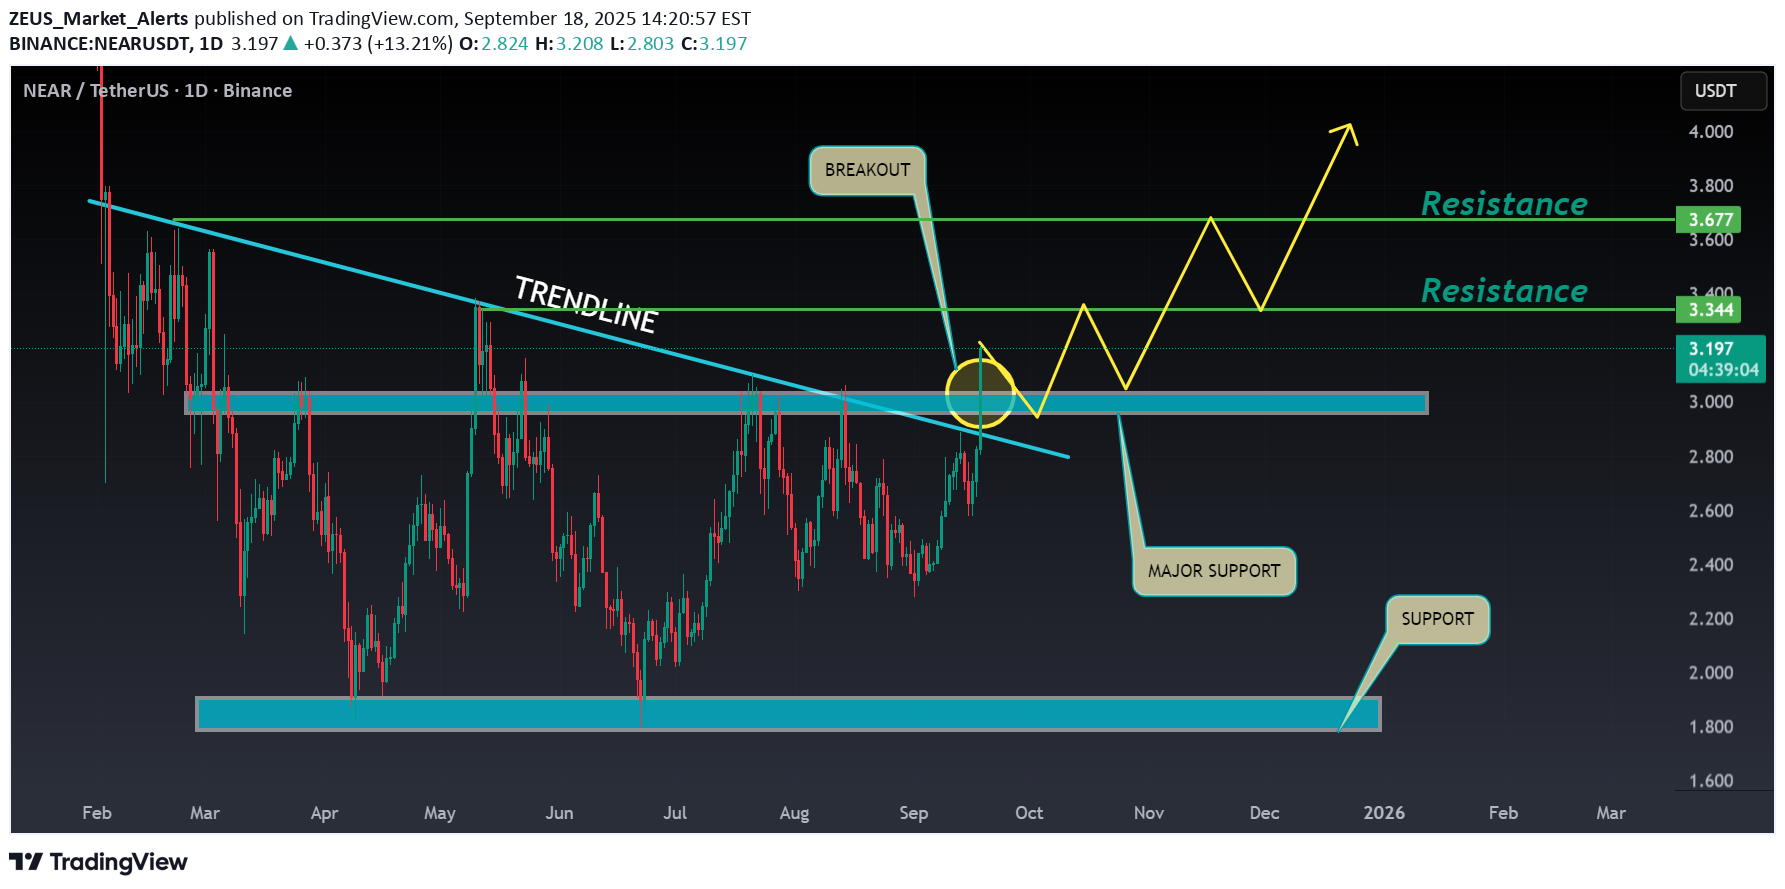
🔮 #NEAR Analysis 💰💰 🌟 As we can see that there is a breakout of trendlind in daily time frame. Also #NEAR is trading above major support zone and if #NEAR sustain here then we would see a good bullish move 🔖 Current Price: $3.200 ⏳ Target Price: $3.679 ⁉️ What to do? - We have marked some crucial levels in the chart. We can trade according to the chart and make some profits in #NEAR. 🚀💸 #NEAR #Breakout #Cryptocurrency #DYOR
ZEUS_Market_Alerts
AI ANALYSIS
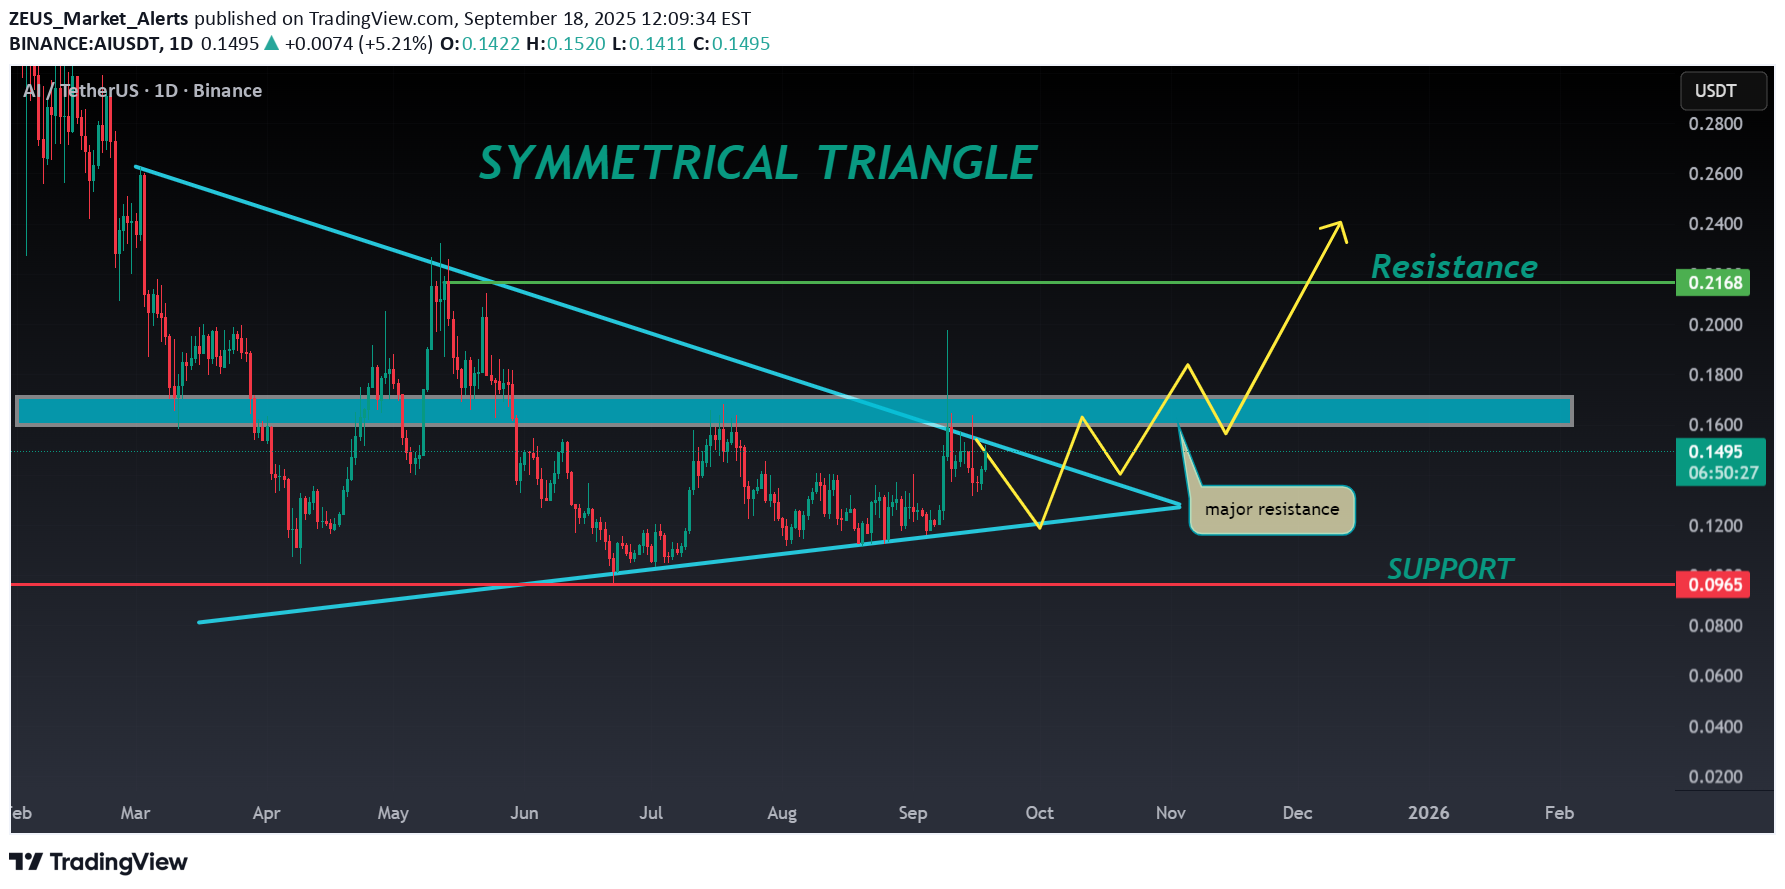
🔮#AI Analysis 💰💰 #AI is trading in a symmetrical triangle in a weekly time frame and if it breakouts with high volume then we can see a bullish momentum in #AI. Before that we will see little bit bearish movement . 🔖 Current Price: $0.1490 ⏳ Target Price: $0.2100 ⁉️ What to do? - We can trade according to the chart and make some profits in #AI. Keep your eyes on the chart, observe trading volume and stay accustom to market moves.💲💲 #AI #Cryptocurrency #Pump #DYOR
ZEUS_Market_Alerts
ETH ANALYSIS
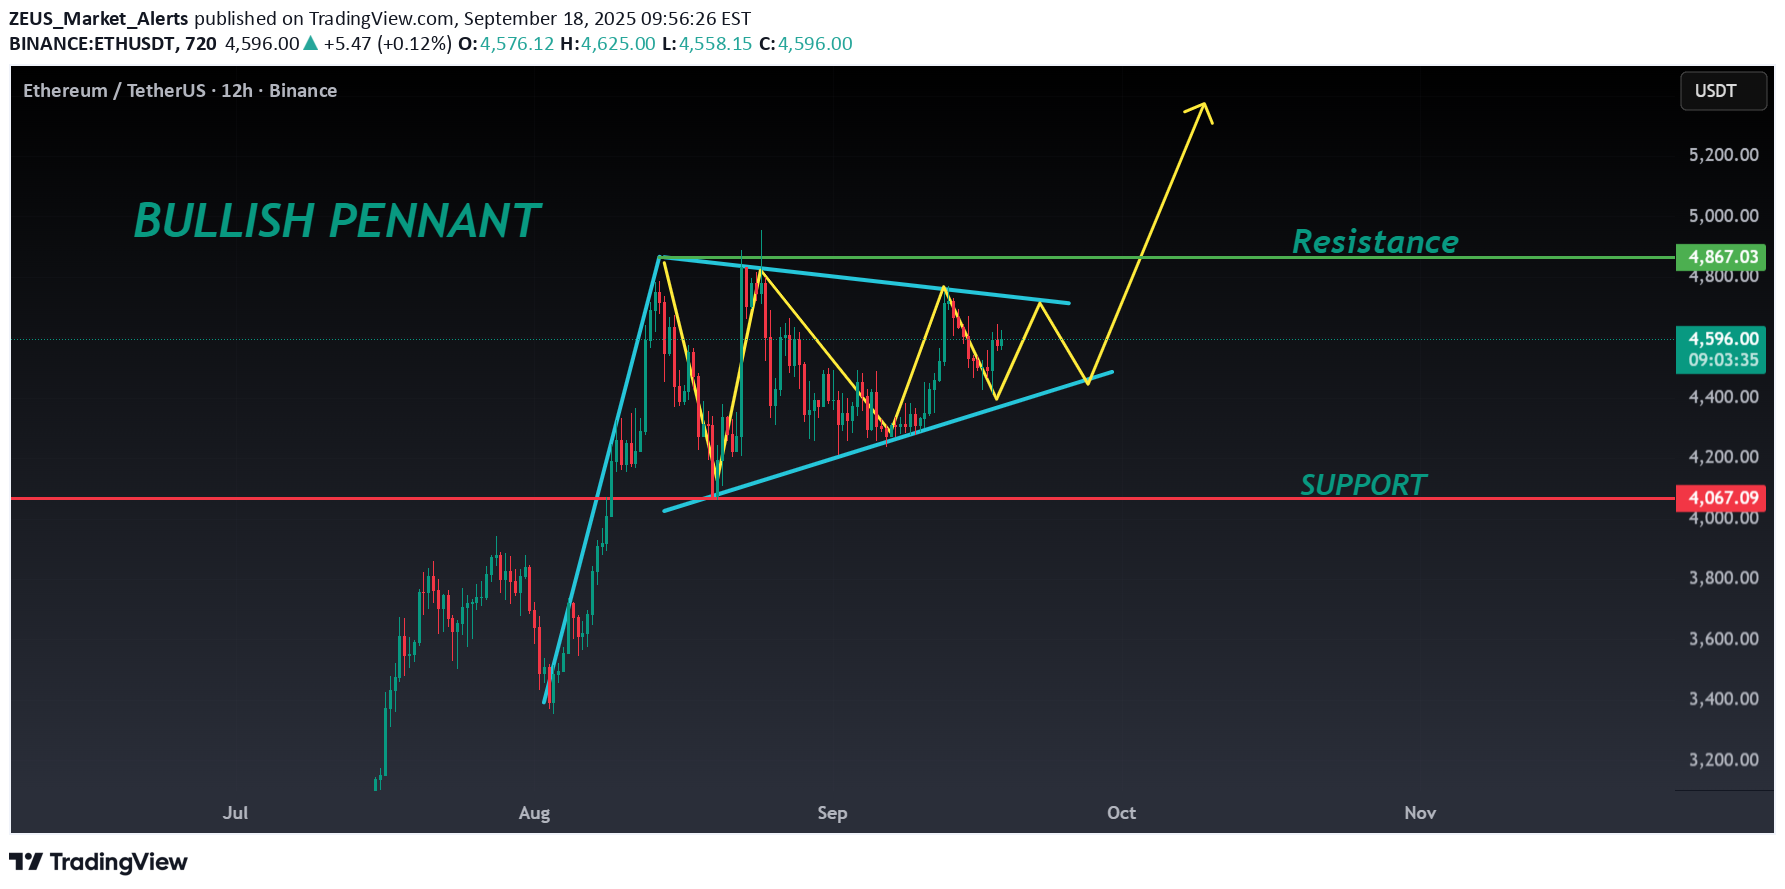
🔴 #ETH Analysis : ❓❓ 🔮There is a formation of "Bullish Pennant Pattern" in #ETH in 4HR time frame. We can expect around $4850 bullish move if the price break the pattern.📈 ⚡️What to do ? 👀Keep an eye on #ETH price action. We can trade according to the chart and make some profits. ⚡️⚡️ #ETH #Cryptocurrency #Breakout #DYOR
ZEUS_Market_Alerts
HBAR ANALYSIS
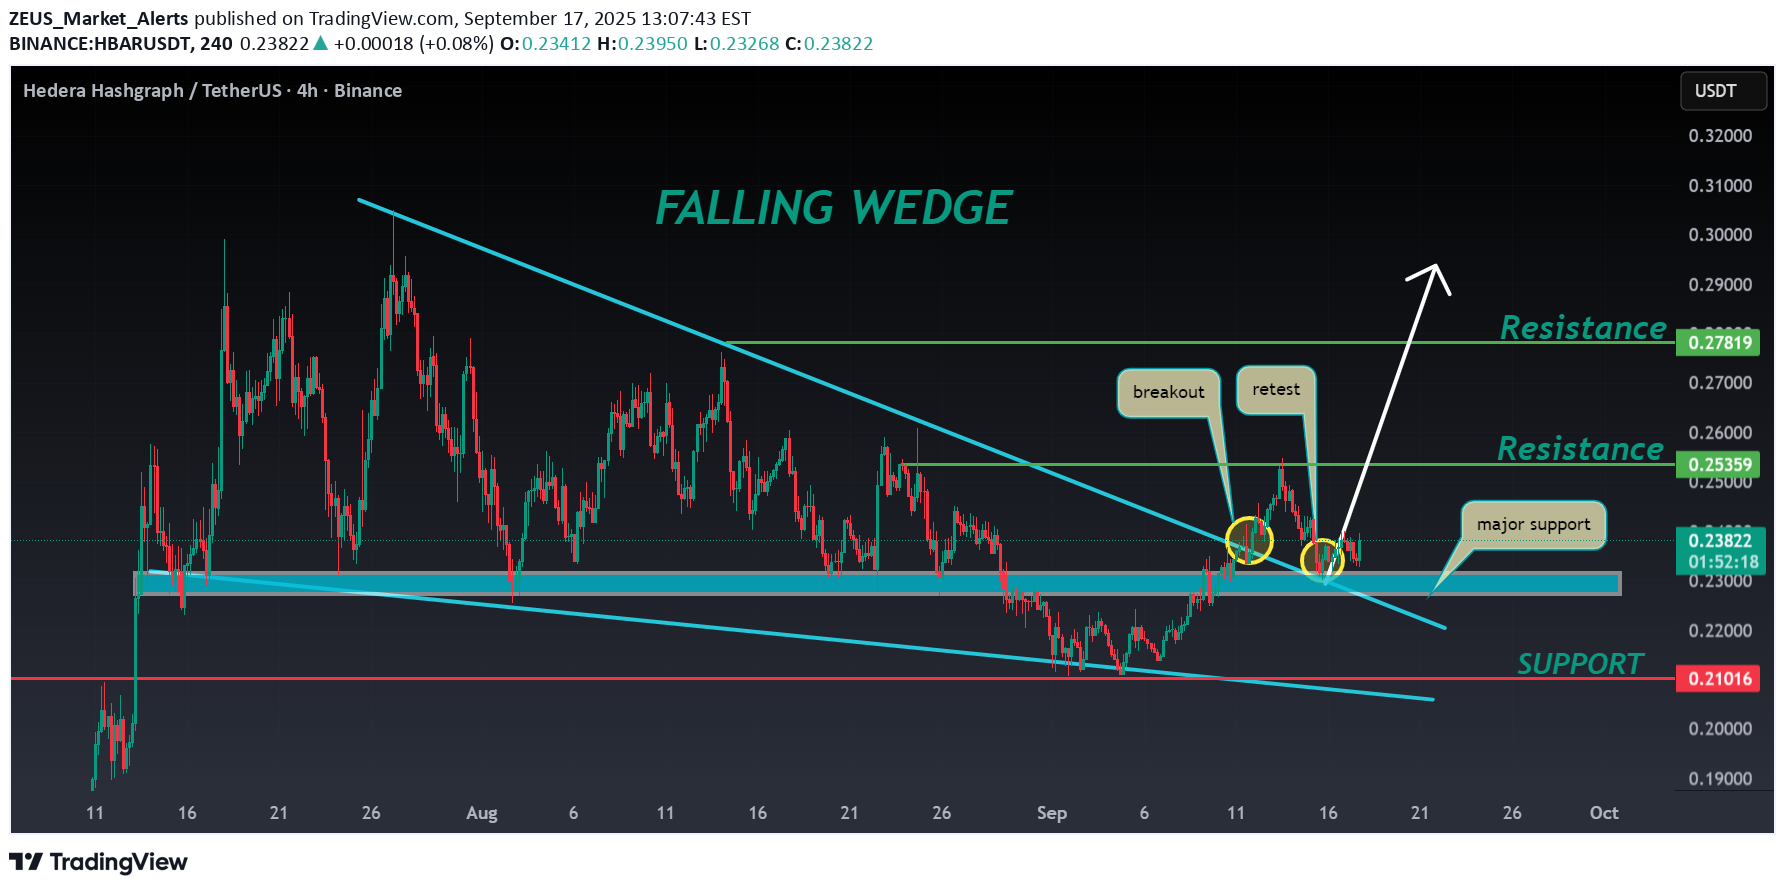
📊 #HBAR Analysis ✅There is a formation of Falling Wedge Pattern on 4HR chart with a breakout and currently trading above its major support area🧐 Pattern signals potential bullish movement incoming in few days 👀Current Price: $0.2385 🚀 Target Price: $0.2780 ⚡️What to do ? 👀Keep an eye on #HBAR price action and volume. We can trade according to the chart and make some profits⚡️⚡️ #HBAR #Cryptocurrency #TechnicalAnalysis #DYOR
ZEUS_Market_Alerts
PEPE ANALYSIS
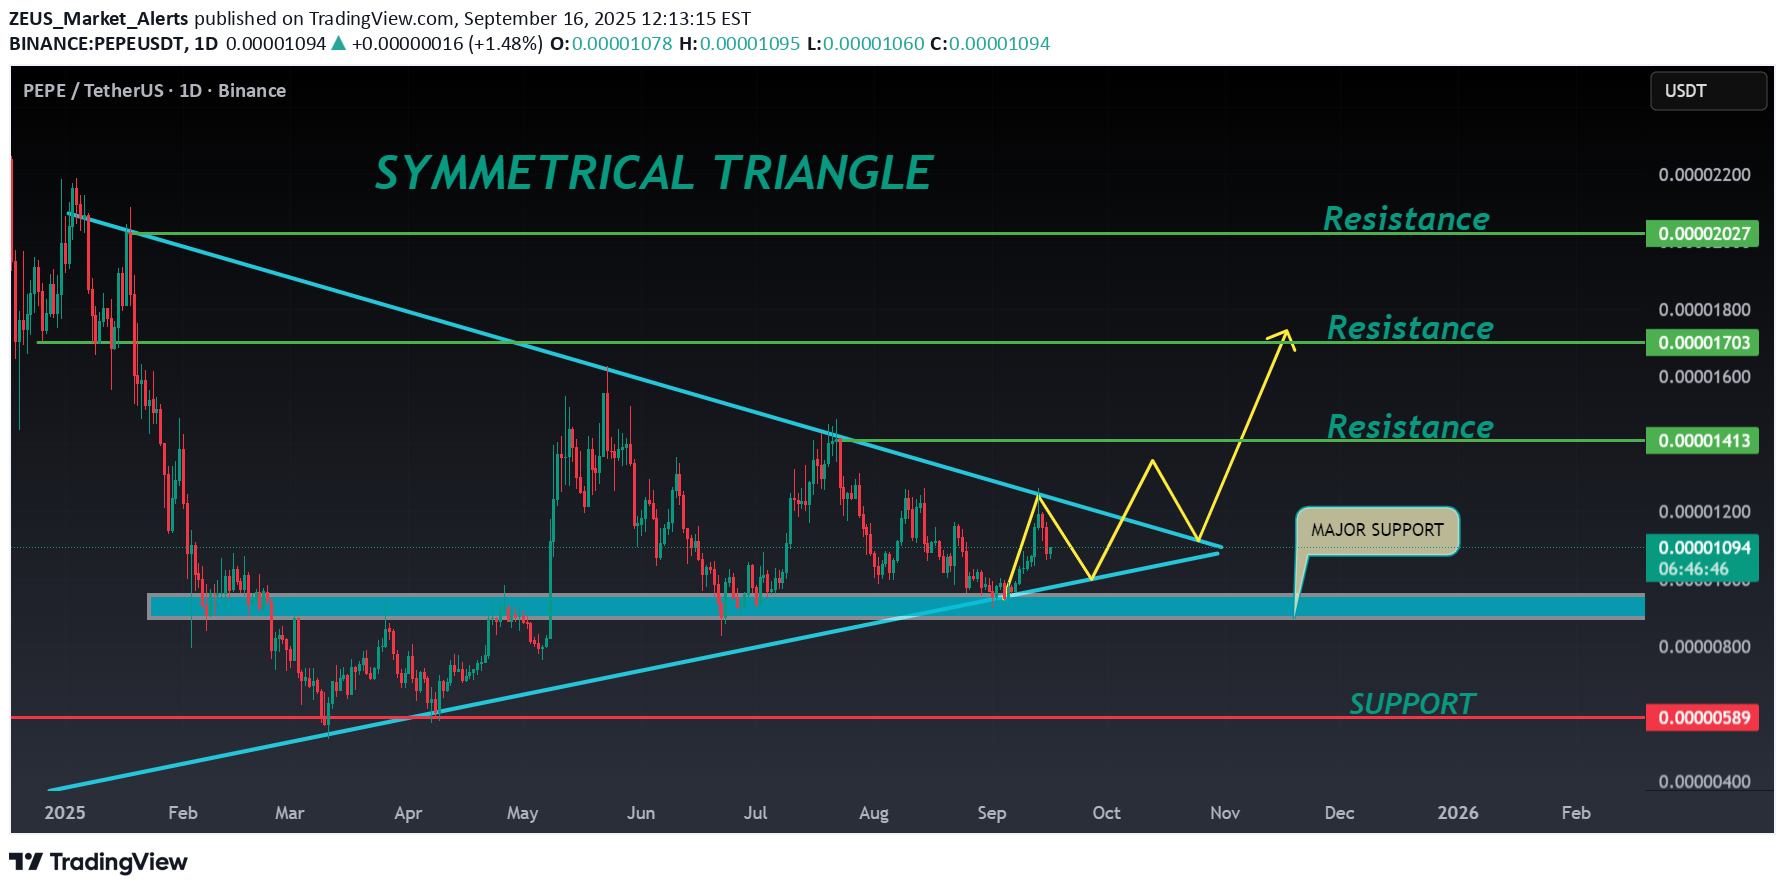
🔮#PEPE Analysis 💰💰 #PEPE is trading in a symmetrical triangle in a daily time frame and if it breakouts with high volume then we can see a bullish momentum in #PEPE. Before that we will see little bit bearish movement towards its support zone and than a bullish movement. 🔖 Current Price: $0.00001091 ⏳ Target Price: $0.00001413 ⁉️ What to do? - We can trade according to the chart and make some profits in #PEPE. Keep your eyes on the chart, observe trading volume and stay accustom to market moves.💲💲 #PEPE #Cryptocurrency #Pump #DYOR
Disclaimer
Any content and materials included in Sahmeto's website and official communication channels are a compilation of personal opinions and analyses and are not binding. They do not constitute any recommendation for buying, selling, entering or exiting the stock market and cryptocurrency market. Also, all news and analyses included in the website and channels are merely republished information from official and unofficial domestic and foreign sources, and it is obvious that users of the said content are responsible for following up and ensuring the authenticity and accuracy of the materials. Therefore, while disclaiming responsibility, it is declared that the responsibility for any decision-making, action, and potential profit and loss in the capital market and cryptocurrency market lies with the trader.