Technical analysis by AltcoinPiooners about Symbol OGN: Sell recommendation (8/20/2025)

AltcoinPiooners
$OGN Overbought Edge: 4H Trading Breakdown
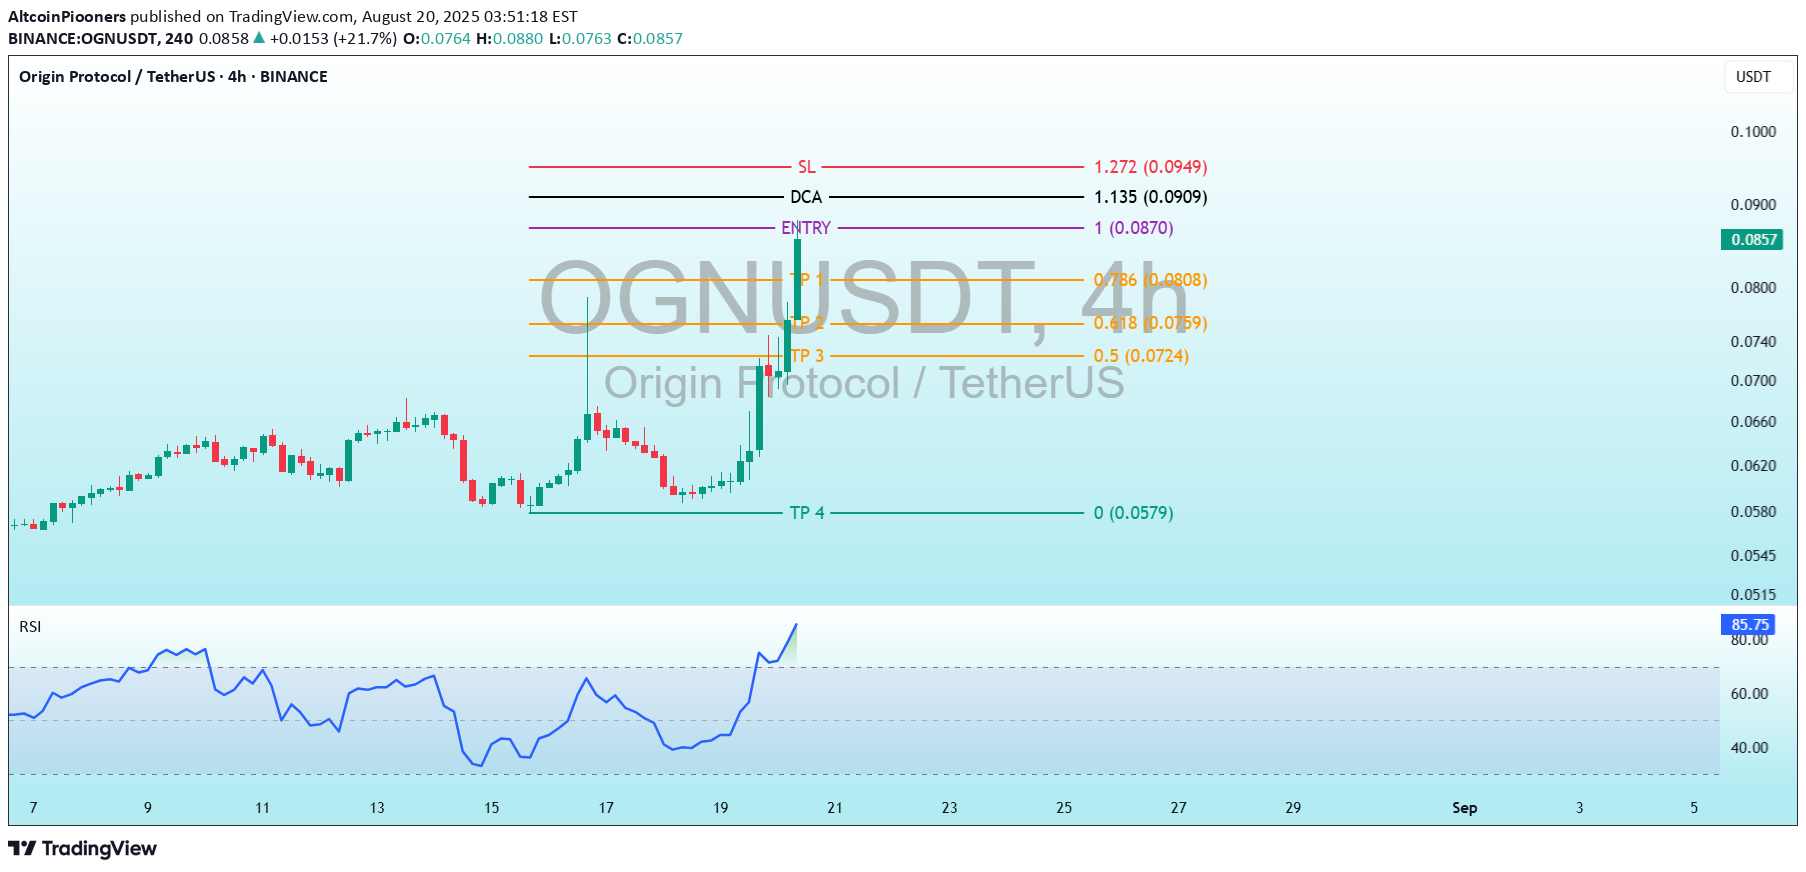
OGNUSDT Trading Levels (Exact Values from the Chart):Entry: 1.00 (0.0870 - 0.0860 USDT) - The planned initial purchase level. DCA (Dollar-Cost Averaging): 1.135 (0.0909 USDT) - An additional buying point if the price rises. SL (Stop Loss): 1.272 (0.0949 USDT) - The level to limit losses. TP (Take Profit):TP1: 0.786 (0.0808 USDT) TP2: 0.618 (0.0759 USDT) TP3: 0.5 (0.0724 USDT) TP4: 0 (0.0579 USDT) - A notably lower target, likely an error or long-term projection. RSI (Relative Strength Index) Indicator: The RSI value is 85.30, which is deeply in the overbought territory (above 70 and nearing 90). This indicates the price was overextended at that time, suggesting a potential reversal or correction. Analysis and Interpretation:Strategy: The chart employs Fibonacci levels to set entry, exit, and loss points. The entry is precisely at 0.0870 - 0.0860 USDT, with a DCA at 0.0909 USDT if the price increases, and a stop loss at 0.0949 USDT to safeguard capital. Profit Targets: TP1 to TP3 are derived from Fibonacci retracement levels (0.786, 0.618, 0.5), reflecting a structured approach to securing profits as the price declines from its peak. TP4 at 0.0452 USDT is significantly below the current price and seems inconsistent, possibly indicating a typo or a long-term speculative target. RSI: The RSI of 85.30 at the chart's timestamp signals a strong overbought condition. Given the 18-hour gap, the RSI may have moderated, but the pullback observed suggests the market may have started correcting. Recommendation: Monitor the current price around the entry level (0.0870 - 0.0860 USDT) and DCA (0.0909 USDT). Since the chart is 18 hours old and the RSI was overbought, the price may have adjusted. The slight pullback at 0.0949 USDT supports this possibility. Exercise caution with new entries and consider checking the latest price and RSI.