
NEO
Neo
| تریدر | نوع سیگنال | حد سود/ضرر | زمان انتشار | مشاهده پیام |
|---|---|---|---|---|
No results found. | ||||
Price Chart of Neo
سود 3 Months :
سیگنالهای Neo
Filter
Sort messages by
Trader Type
Time Frame

SIGNOLL
پیشبینی دقیق قیمت نئو (NEO/USD): تحلیل امواج اصلاحی، کانالها و مدل وایکوف
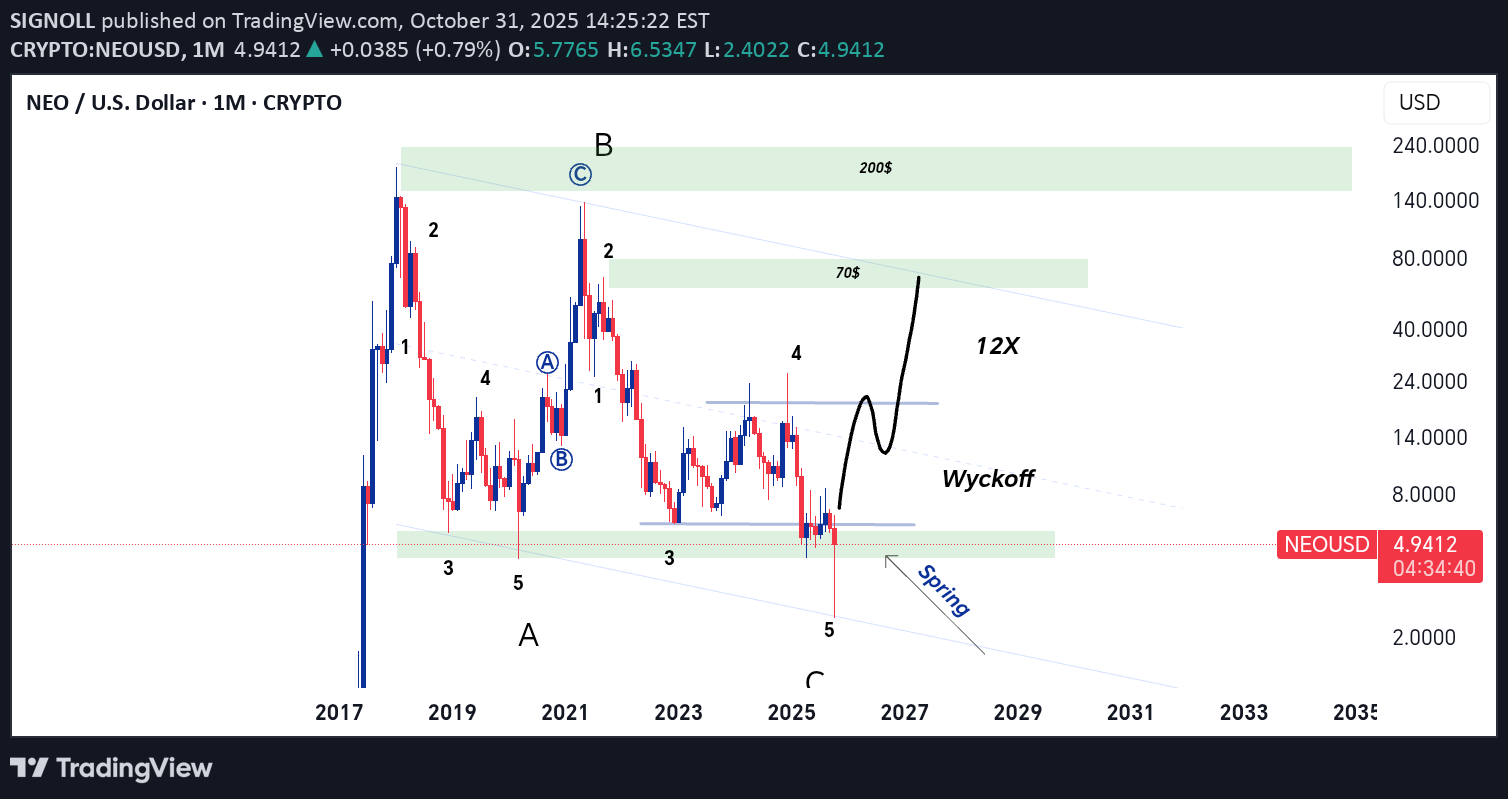
The analysis has been done based on the laws of corrective waves and channels, as well as analysis based on the Wyckoff model and divergences

sladkamala123
NEO: نمودار رشد آینده و مسیر هیجانانگیز پیش رو
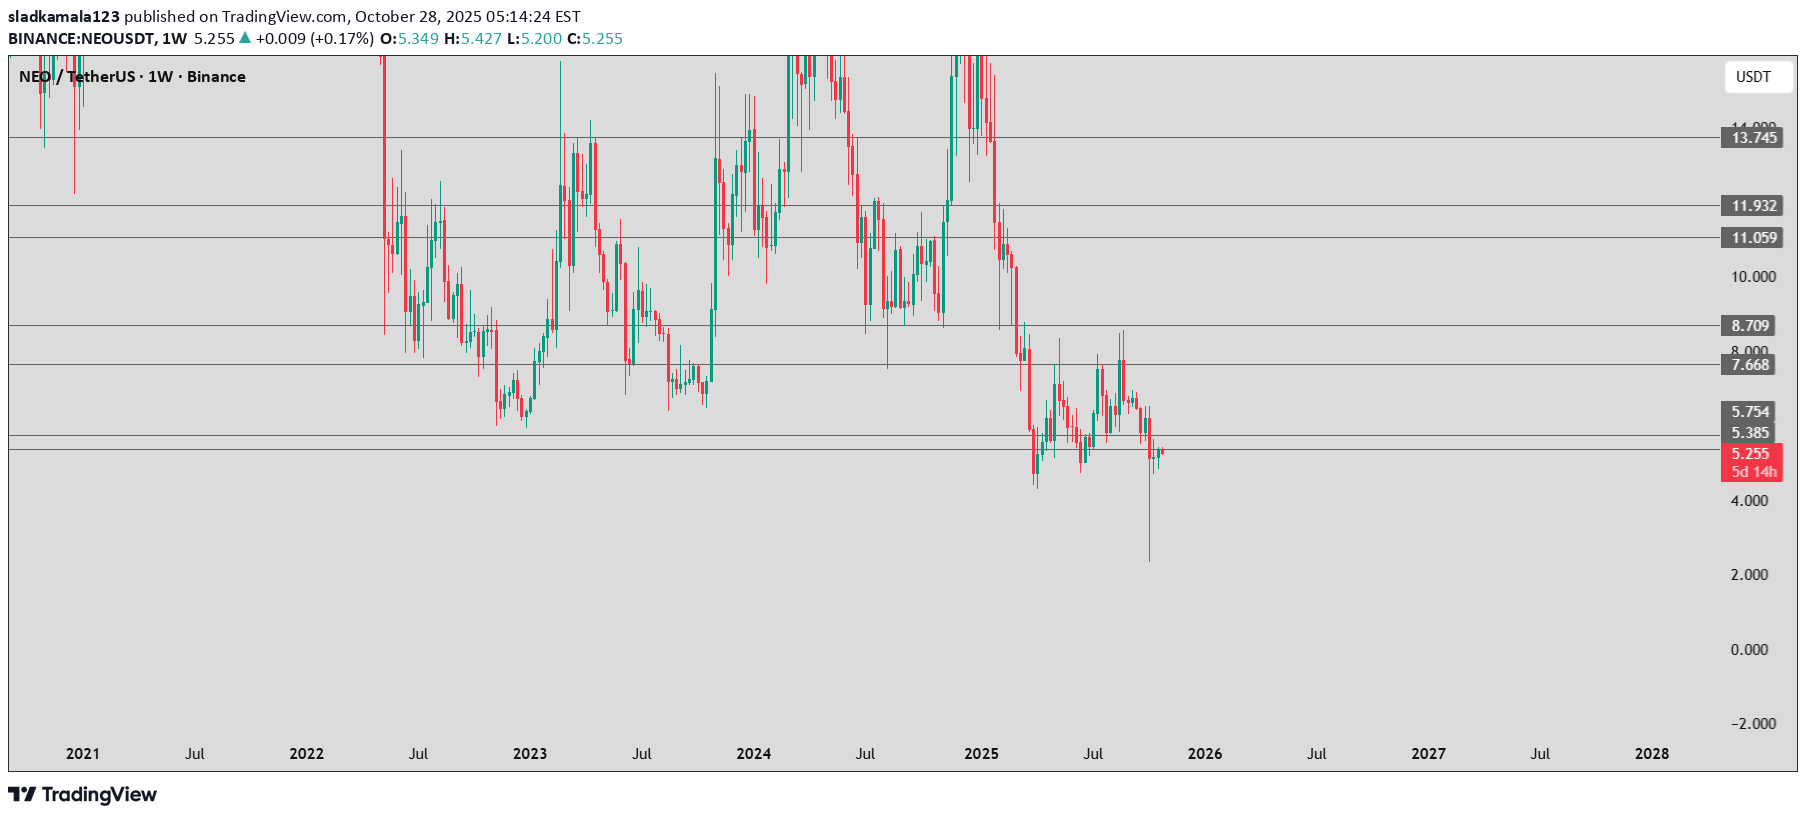
It"s interesting for future growth. the gtrend is clear. We"ll see wherw it goes.

قیمت نئو زیر مقاومت کلیدی فیبوناچی در حال تثبیت است: آیا ریزش ادامه دارد؟
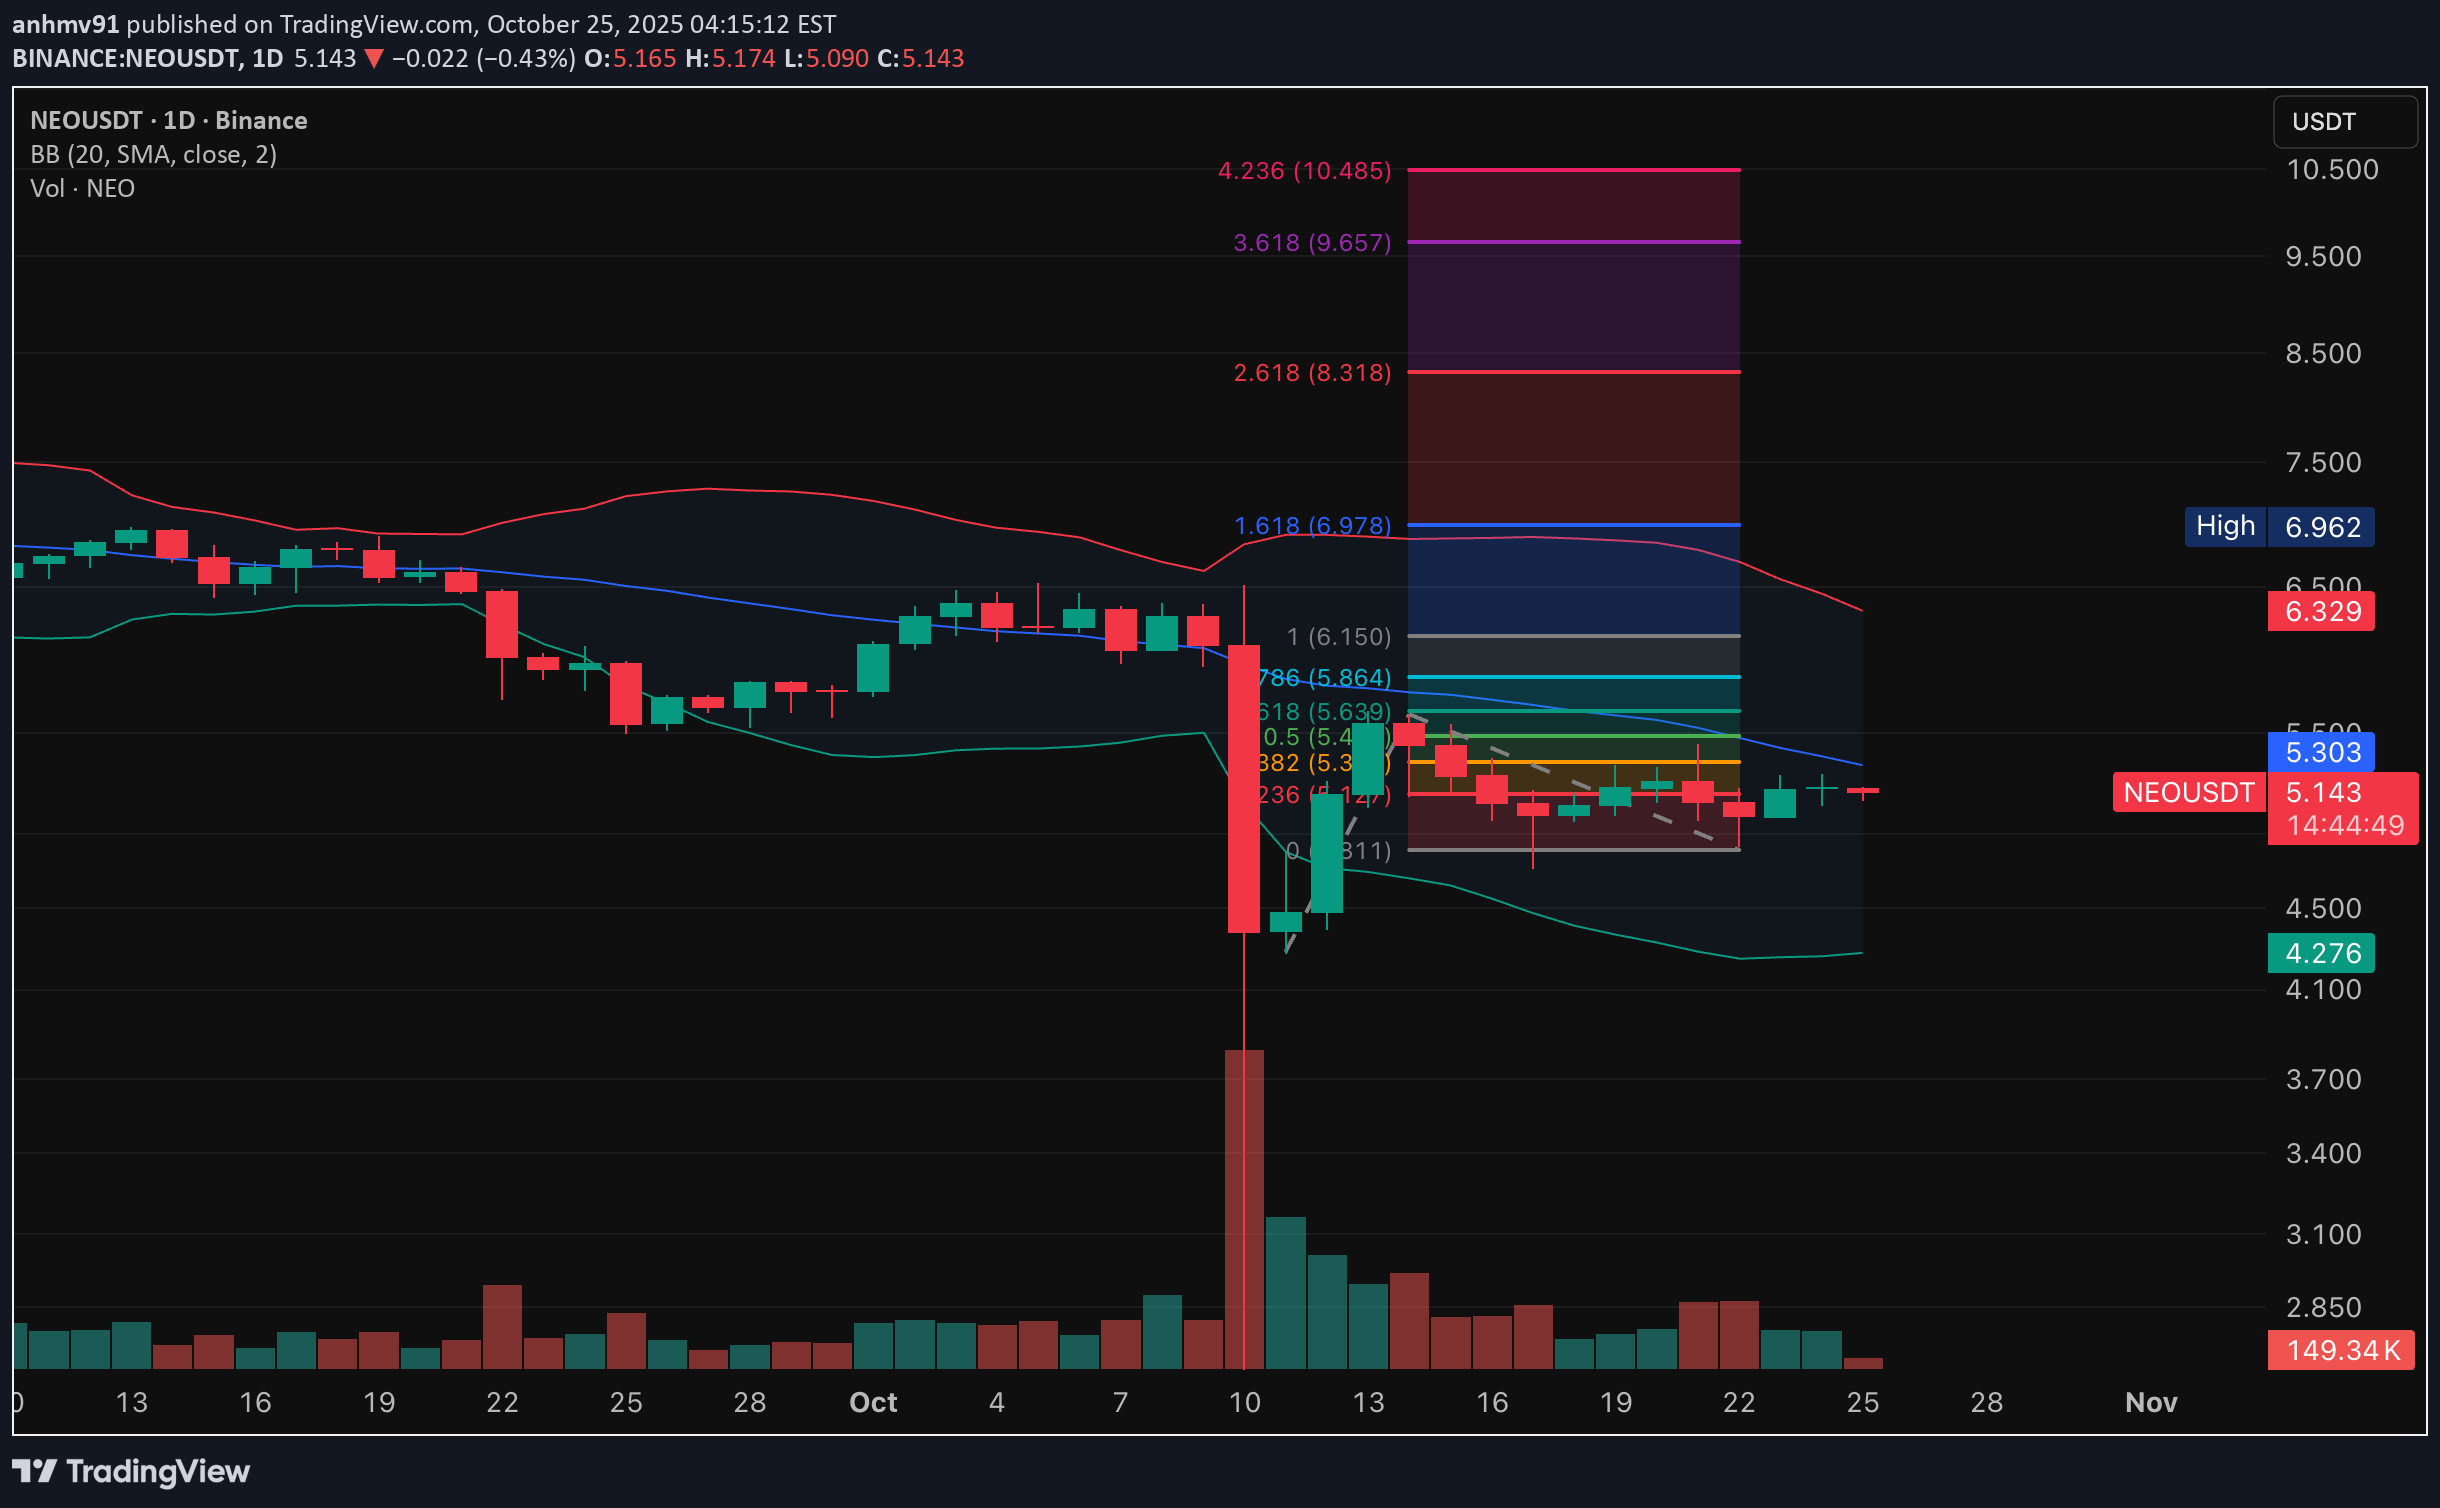
- NEO is consolidating in a narrow range around 5.1–5.3 after a sharp drop on 10/10. - Price remains below the 20-day SMA and key Fibonacci resistance at 5.43, showing a bearish bias. - Volume is low, suggesting weak momentum. - A breakout above 5.6 could signal recovery, while a drop below 5.0 may lead to a retest of 4.3 support.

Guapeva
نئو (NEO) آماده جهش ۳ برابری؟ تحلیل سطوح فیبوناچی و سیگنال خرید قوی
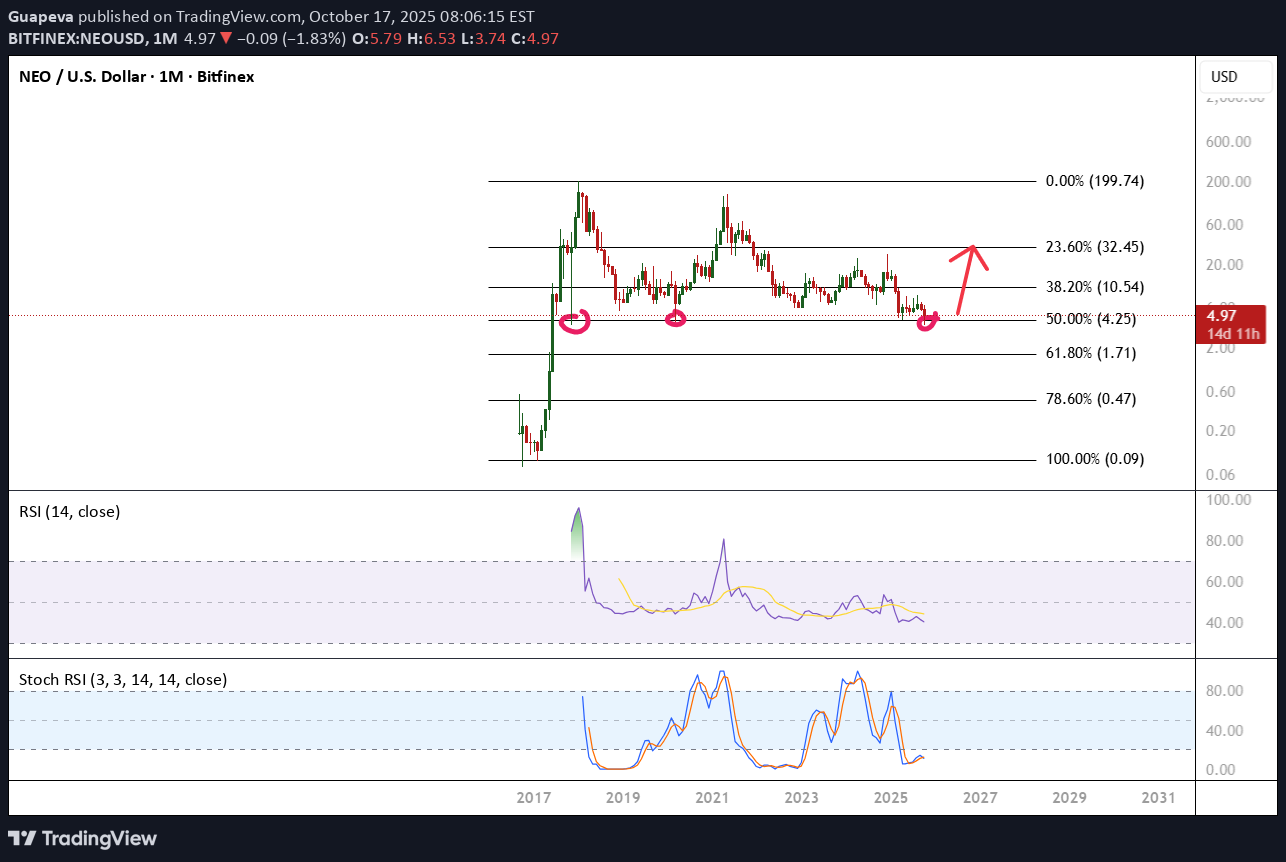
We can see NEO trades above a strong fib level. historically, it rejected to the upside 3x from here. Expecting happening again. Indicators oversold weekly and monthly

Anahita_Trade
تحلیل تکنیکال بازار: شکست خط روند و تکمیل اصلاح ABC! (مسیر جدید قیمت)

Neo future road pattern. Break trend line and Correction Abc is done

sjd_aub
آیا نئو (NEO) آماده جهش 10 برابری است؟ تحلیل بلندمدت و دیدگاه شگفتانگیز!


Bithereum_io

#NEO is moving inside a symmetrical triangle on the daily chart. If it bounces from the triangle support line, an upward move can be expected, and in case of a breakout above the triangle, higher targets may be reached. If the above scenarios are confirmed, the potential targets are: 🎯 $6.587 🎯 $7.290 🎯 $7.993 🎯 $8.995 🎯 $10.270 In case of a breakdown below the triangle, it may go to retest the $4.640 ~ $4.520 zone. ⚠️ Always remember to use a tight stop-loss and follow proper risk management.

CryptoNuclear

📊 Overview The NEO/USDT (Weekly, OKX) pair is currently sitting at a critical junction that could define its long-term direction. Since the 2021 peak, NEO has been in a macro downtrend, but once again it is testing the historical demand zone at 3.90 – 5.85 USDT (yellow box). This zone isn’t just a minor support — it’s a multi-year structural level that has repeatedly acted as a floor since 2019. --- 🔍 Structure & Price Pattern 1. Macro Trend: From the ATH ≈140 USDT (2021), price has consistently formed lower highs and lower lows. Trend remains bearish, but extended consolidation at the lows suggests possible accumulation. 2. Key Levels: Strong Support: 3.90 – 5.85 (multi-year demand). Immediate Resistance: 6.855 USDT. Next Resistance Levels: 9.106 → 14.319 → 21.540 → 29.386. Psychological Long-Term Levels: 47.880, 62.487, 115.281, and ATH at 140.942. 3. Potential Patterns: Holding above the yellow box + breakout over 6.855 could trigger a base breakout / double bottom reversal. A breakdown below 3.90, however, would confirm a bearish continuation with significant downside risk. --- 🟢 Bullish Scenario 1. Early Confirmation: Weekly close above 6.855 USDT. 2. Upside Targets: Target 1: 9.106 USDT. Target 2: 14.319 USDT. Target 3: 21.540 USDT (macro structure begins shifting bullish if broken). 3. Supporting Signals: Strong breakout volume. RSI reclaiming > 50. Bullish weekly candlestick closes near the highs. --- 🔴 Bearish Scenario 1. Early Confirmation: Weekly close below 3.90 USDT. 2. Implications: Loss of multi-year demand zone. Opens the door for deeper downside with no clear structural support below. 3. Supporting Signals: Lower highs failing near 6.855. RSI staying below 50. Weak volume on rallies, strong volume on sell-offs. --- 🎯 Conclusion & Sentiment The 3.90 – 5.85 USDT zone = “Last Defense Zone” for NEO. Holding this level could spark a long-term reversal toward 9 – 14 USDT. Breaking below would signal a continuation of the multi-year downtrend with significant downside risk. At this moment, NEO stands at a crossroad: ➡️ Will it be the start of a new bullish cycle after years of consolidation? ⬅️ Or will it break down its last major support and extend the bearish cycle further? --- 🔑 Notes for Traders Always wait for weekly close confirmation to avoid bull/bear traps. Watch the reaction at 3.90 – 5.85 USDT, as it’s critical for both swing traders and long-term investors. Apply strict risk management (SL/TP), as volatility in this zone can be very high. --- #NEO #NEOUSDT #NEOAnalysis #Altcoins #CryptoTrading #SwingTrade #SupportResistance #TechnicalAnalysis #CryptoMarket

TheSignalyst

Hello TradingView Family / Fellow Traders. This is Richard, also known as theSignalyst. 📈NEO has been overall bullish trading within the flat rising channel marked in blue. This week, NEO has been retesting the lower bound of the channel. Moreover, the green zone is a strong support and structure. 🏹 Thus, the highlighted blue circle is a strong area to look for buy setups as it is the intersection of the lower blue trendline and green support. 📚 As per my trading style: As #NEO approaches the blue circle zone, I will be looking for trend-following bullish reversal setups (like a double bottom pattern, trendline break , and so on...) 📚 Always follow your trading plan regarding entry, risk management, and trade management. Good luck! All Strategies Are Good; If Managed Properly! ~Richard Nasr

The-Thief

🕵️♂️ NEO/USDT | Thief’s Heist Plan 🎯 + Market Snapshot 📌 Plan Overview Asset: NEO/USDT Bias: Bullish (Pending Order Plan) Entry Style: Thief Layer Strategy (Layered Limit Orders + Breakout Confirmation) 💰 Entry Strategy (Thief Layers) Pullback Entry Zone: 6.200 & above (watch closely 🔔) Layered Buy Orders (Limit): 6.200 🟢 6.300 🟢 6.400 🟢 6.500 🟢 (You can increase layers as per your own plan. Set alarm in TradingView to catch the breakout easily! ⏰) 🛡️ Stop Loss (Thief SL) Suggested SL: 5.800 (after breakout & pullback confirmation). ⚠️ Note to Thief OG’s: Adjust SL as per your own risk appetite & trading style. This is not financial advice — just the plan’s outline. 🎯 Target Zone (Escape Point) Primary Heist Target: 8.000 Remember 🚨 — “Police barricades” (resistance zones) are ahead. Take profits on the run! ⚠️ Note to Thief OG’s: You don’t have to stick only to this TP — take money when the job feels right, manage risk your way. 📊 NEO/USDT Real-Time Data Snapshot 24h Change: -1.66% 24h Low: $6.41 24h High: $6.67 Trading Volume (24h): $36.5M Market Cap: $457.84M 😰 Fear & Greed Index Score: 55/100 (Greed) Neutral RSI (46.59) = balanced momentum Recent price dip (-1.66% in 24h) tempered optimism 🏛️ Fundamental & Macro Score Adoption Utility: ⭐⭐⭐⭐☆ → Neo’s “smart economy” focus gaining traction Network Activity: ⭐⭐⭐☆☆ → Circulating supply: 70.54M NEO Regulatory Compliance: ⭐⭐⭐⭐☆ → Strong alignment (China-friendly) Macro Risks: ⭐⭐☆☆☆ → Market volatility + global macro pressure 📣 Retail vs. Institutional Sentiment Retail Traders: Neutral to Bearish 😕 53% green days in last 30 days Short-term dip driving caution Institutional Traders: Cautiously Optimistic 🧐 Focused on long-term upgrades (Neo N3 blockchain) Accumulation mode in uncertainty 🎯 Overall Market Outlook Bullish Score: 40/100 → Bearish Short-Term Risk Warning: Break below $6.09 = deeper downside possible 💡 Key Takeaways 📉 Short-term bearish price action vs. 📈 solid long-term fundamentals 😰 Greed sentiment = room for pullback 🚀 Neo N3 upgrade is a potential growth driver 👀 Watchlist (Correlated Pairs in $) BTCUSDT ETHUSDT SOLUSDT ADAUSDT DOTUSDT ✨ “If you find value in my analysis, a 👍 and 🚀 boost is much appreciated — it helps me share more setups with the community!” #NEOUSDT #NEO #CryptoTrading #SwingTrade #DayTrade #CryptoStrategy #LayeredEntries #BreakoutTrading #RiskManagement #TradingViewCommunity🚀 NEO/USDT Live Market Feed - Oct 12, 2025 📊 🔥 Current Spot Price NEO/USDT: $4.44 USDT 24h Change: -27.50% (downward pressure from broader market pullback) 24h Volume: $60M USDT (steady flow, no panic spikes) 📈 Fundamental Score Overall: 65/100 (Strong tech base with dBFT consensus & smart economy focus, but ecosystem growth lags behind ETH/SOL) Key Drivers: Dual-token model (NEO for governance, GAS for fees) holds value; quantum-resistant upgrades boost long-term appeal. 🌍 Macro Score Overall: 55/100 (Easing policy supports risk assets, but jobs softness adds caution) Interest Rates: Fed funds at 4.00%-4.25% (recent 25bp cut; next easing eyed for Oct/Dec) Inflation Rates: CPI YoY at 2.7% (Aug data; Sep release Oct 15 - stable, no hot spikes) Economic Growth: Q2 GDP +3.8% annualized (Q3 nowcast ~1.3% - slowing but positive) Jobs Market: Unemployment at 4.3% (Aug; nonfarm payrolls flat +22K - cooling hiring) Bank Orders: Institutional ETF inflows steady ($420M ETH ETFs last week; BTC minor outflows) - favors crypto liquidity. 🍂 Seasonal Tendencies October "Uptober" Effect: 73% positive months historically for majors (BTC avg +22.5%) NEO Pattern: Mid-autumn bounces common (mini bull runs in Sep/Oct past cycles) - watch for reversal from demand zones. 😤 Trader Sentiment Outlook Retail Traders: 40% Bullish / 60% Bearish (Fear-driven selling post-pullback; contrarian buy signal as ratio dips below 1.0) Institutional Traders: 70% Bullish / 30% Bearish (Dominant inflows via ETFs; open interest up $220B - accumulation mode) Signal Summary: Institutional Buy (Strong) | Crowd Sell (Weak) - Pros lead, retail lags. 📊 Fear & Greed Index Current: 27/100 (Fear Zone) Mood Measure: Investors overly worried (high volatility + low social buzz) - potential bottom signal for dip buys. 🎯 Overall Market Outlook Score Neutral (50/100) - Macro easing counters jobs drag; sentiment split favors wait-for-breakout. No strong long/short edge yet.
Disclaimer
Any content and materials included in Sahmeto's website and official communication channels are a compilation of personal opinions and analyses and are not binding. They do not constitute any recommendation for buying, selling, entering or exiting the stock market and cryptocurrency market. Also, all news and analyses included in the website and channels are merely republished information from official and unofficial domestic and foreign sources, and it is obvious that users of the said content are responsible for following up and ensuring the authenticity and accuracy of the materials. Therefore, while disclaiming responsibility, it is declared that the responsibility for any decision-making, action, and potential profit and loss in the capital market and cryptocurrency market lies with the trader.