
MEME
Memecoin
| تریدر | نوع سیگنال | حد سود/ضرر | زمان انتشار | مشاهده پیام |
|---|---|---|---|---|
No results found. | ||||
Price Chart of Memecoin
سود 3 Months :
سیگنالهای Memecoin
Filter
Sort messages by
Trader Type
Time Frame

CryptoNuclear
میم کوین در دوراهی مرگ و زندگی: آیا کف قیمتی تشکیل میشود یا سقوط نهایی در راه است؟
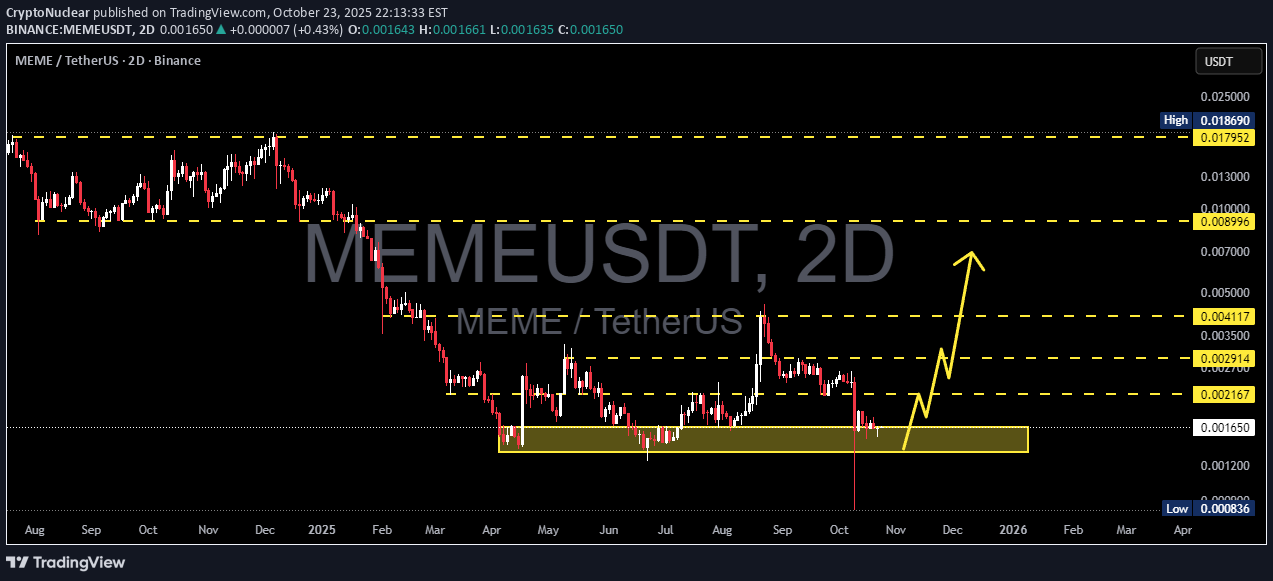
📉 Overview MEME/USDT is standing on the edge — between a massive accumulation opportunity and complete market capitulation. The price is now sitting right above the major support zone (0.0012 – 0.00165 USDT), a key defensive area that has been tested multiple times since April 2025. Each visit to this zone has triggered liquidity absorption and stop hunts, followed by short-lived recoveries — but never a sustained reversal. Now, once again, the market is testing this zone for survival. --- 🧩 Price Structure & Technical Context Primary trend: Long-term downtrend since late 2024, forming consistent lower highs and lower lows. Dominant pattern: Potential accumulation base following a liquidity sweep — a classic signal of possible smart-money accumulation. Recent wick reaction: Sharp downward wick that was quickly absorbed — often a sign of institutional defense or smart buyer entry. Highlighted zone: This yellow box is more than just support — it’s the psychological boundary between recovery and collapse. --- 📈 Bullish Scenario — “Rebirth from the Bottom” If the price manages to close above 0.0017 and successfully flip this zone into support, it may trigger the beginning of a structural reversal phase. Potential targets: Target 1: 0.002167 → first resistance / short-term profit zone. Target 2: 0.002914 → key validation level for continuation. Target 3: 0.004117 → structural confirmation of trend reversal. Key confirmation: A 2D candle close above the box, followed by a clean retest and sustained momentum. If volume expands, a mid-term rally could unfold. Technical narrative: This setup could evolve into a textbook case of “liquidity sweep followed by a reversal.” If confirmed, it might mark the start of a major accumulation cycle ahead of the next hype phase. --- 📉 Bearish Scenario — “The Final Floor Breaks” If the price fails to hold above 0.0012, the next meaningful support lies near 0.000836, the previous low. A confirmed breakdown below this zone would imply: The end of the accumulation phase, Entry into full capitulation, And a likely panic-driven selloff as retail stop-losses are triggered en masse. Bearish confirmation: 2D candle close below the support zone with a strong follow-through. If that happens, bulls are temporarily out of the game until a new structure forms at lower levels. --- 🎯 Summary This yellow zone is not just another support area — it’s the psychological battlefield where smart money decides the next chapter. The market is now in a quiet tension before the storm: Either we witness a legendary rebound from deep accumulation, Or the final breakdown of a fading trend. For disciplined traders, this is not the time to guess — this is the time to prepare for both outcomes with precision and patience. --- ⚙️ Risk Management Strategy Only enter after clear confirmation (2D close + retest). Risk per trade: 1–3% of total capital. Take partial profits at each target. Move stop-loss to breakeven once Target 1 is reached. --- 🧭 Additional Notes Mid-term bias remains bearish, but early signs of re-accumulation are emerging. This isn’t just another random bottom — it’s a strategic battlefield between smart buyers and aggressive sellers. --- #MEME #MEMEUSDT #AltcoinAnalysis #CryptoReversal #LiquiditySweep #SupportZone #BreakoutWatch #CryptoTechnicalAnalysis #SwingTrading #SmartMoneyConcepts #MarketStructure

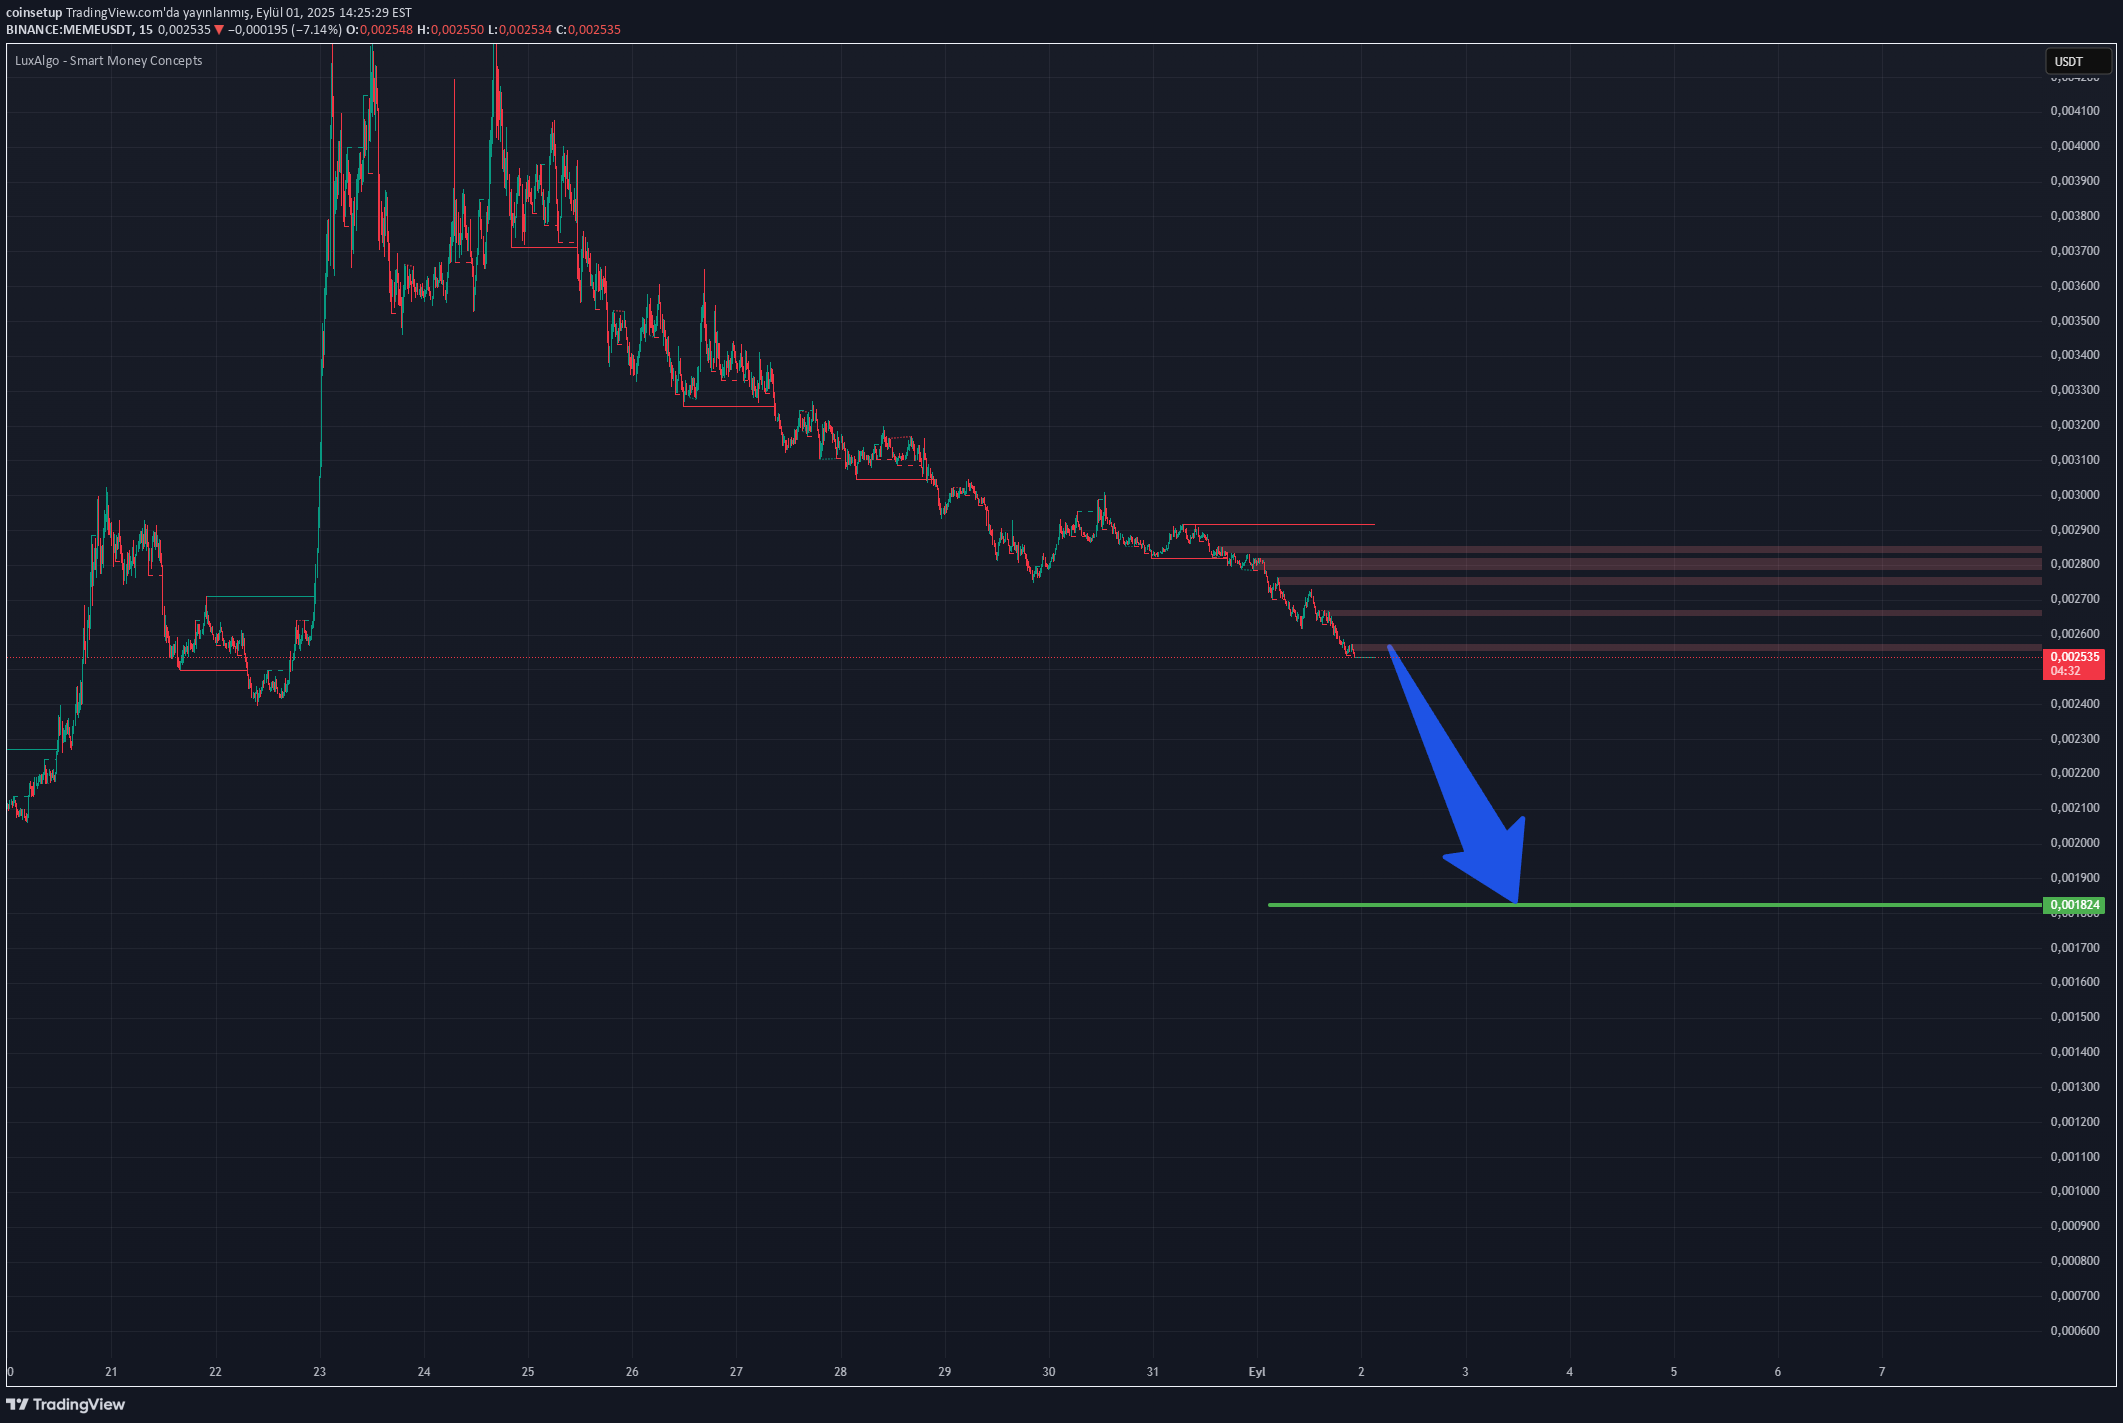
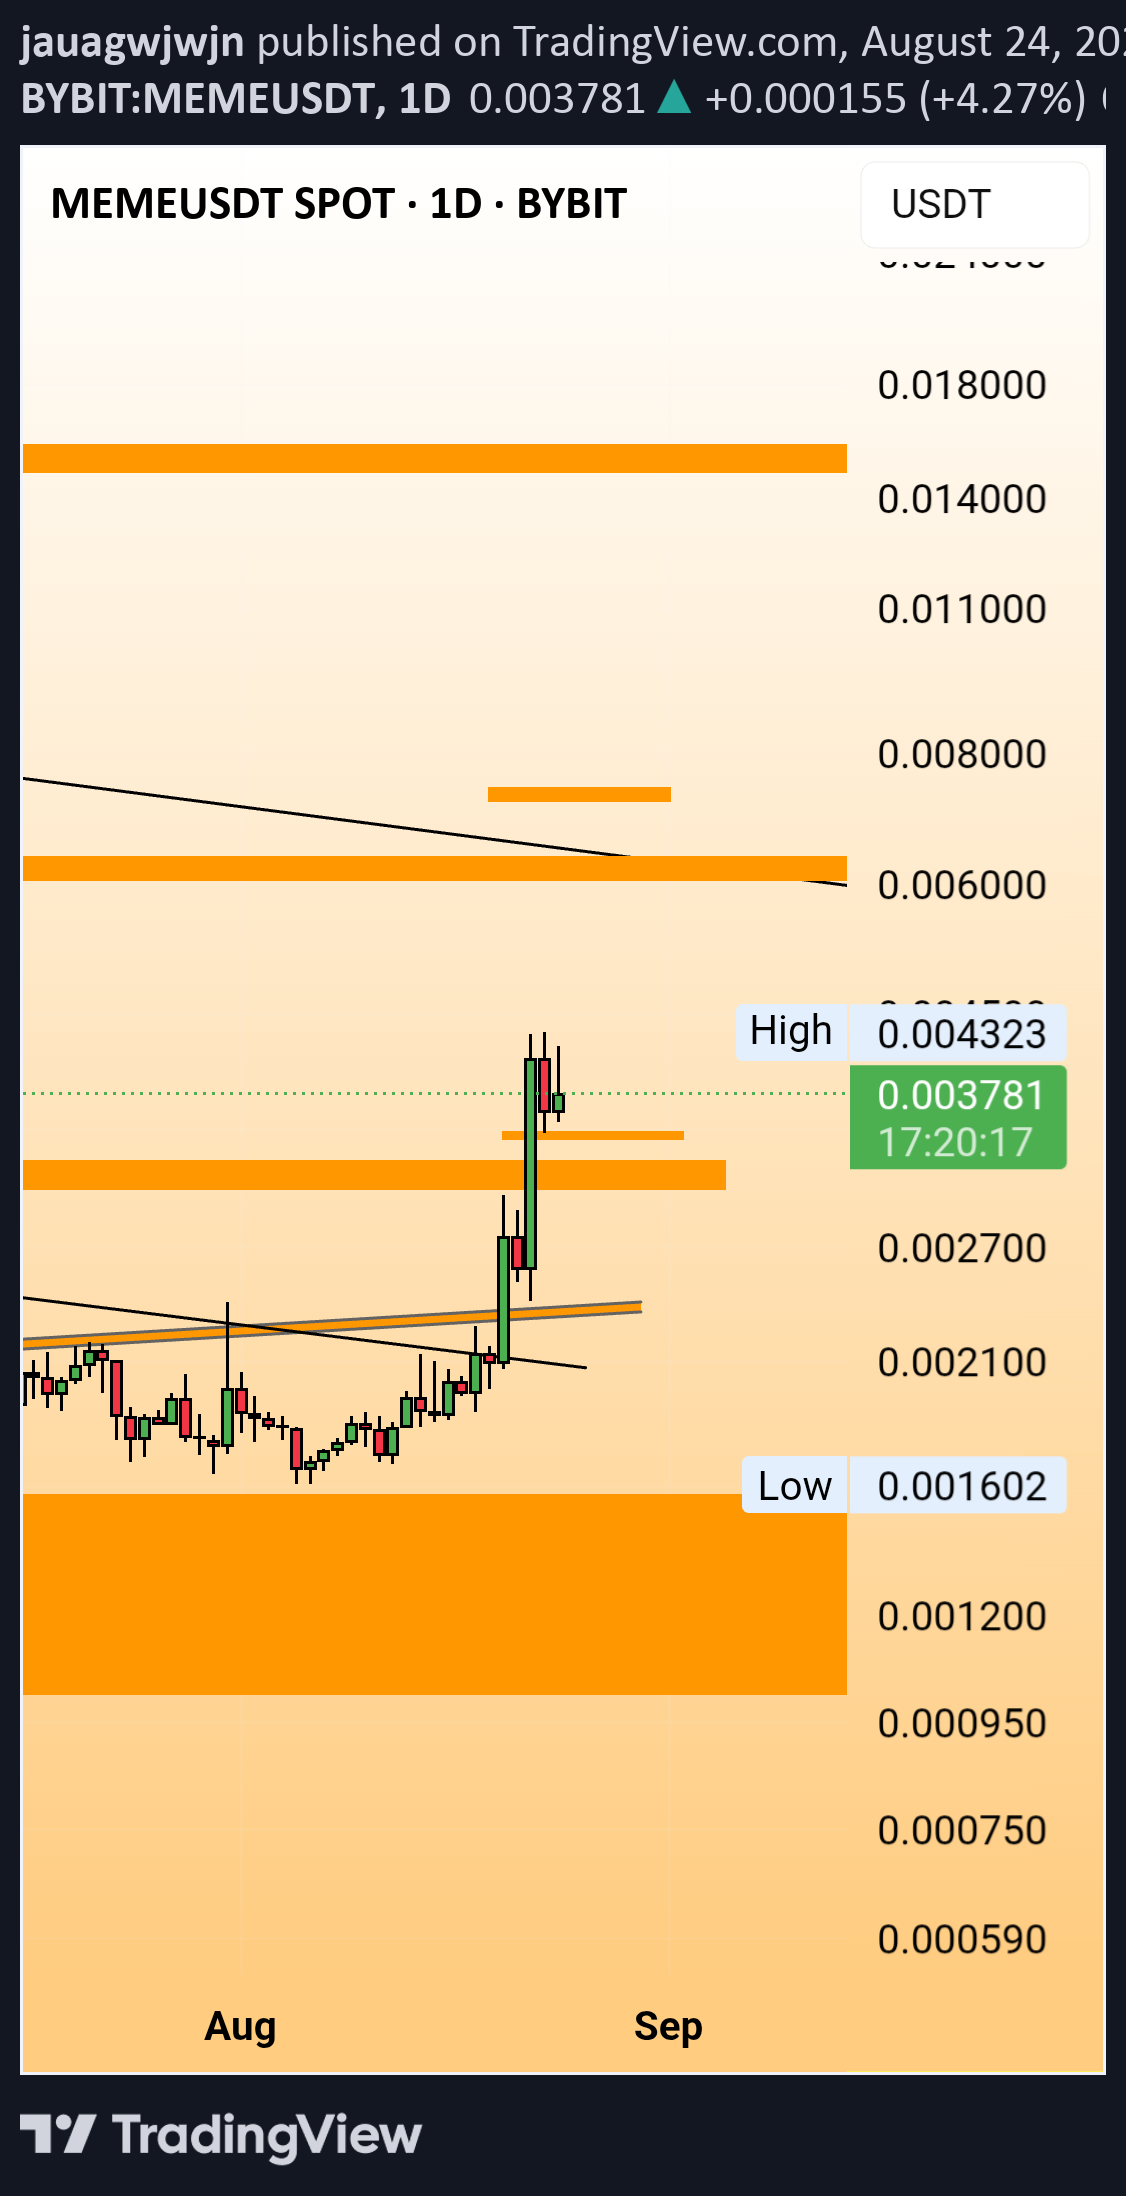
MEME Token is observed in a strong decline tendency. With the withdrawal of the price below the previous support levels, technically, the 0.0018 zone draws attention as a potential target. This scenario may be one of the "loss movements" seen in the token, especially in high volatility. The structures in the graph show that short -term printing and sales pressure continues. However, this analysis is a personal observation based only on technical price movements. ⚠️ Note: This is not an investment advice. MEME , memecoin. It is a project offered throughorg and is a high -risk and speculative asset. Always do your own research (Dor) and evaluate the risks before deciding.
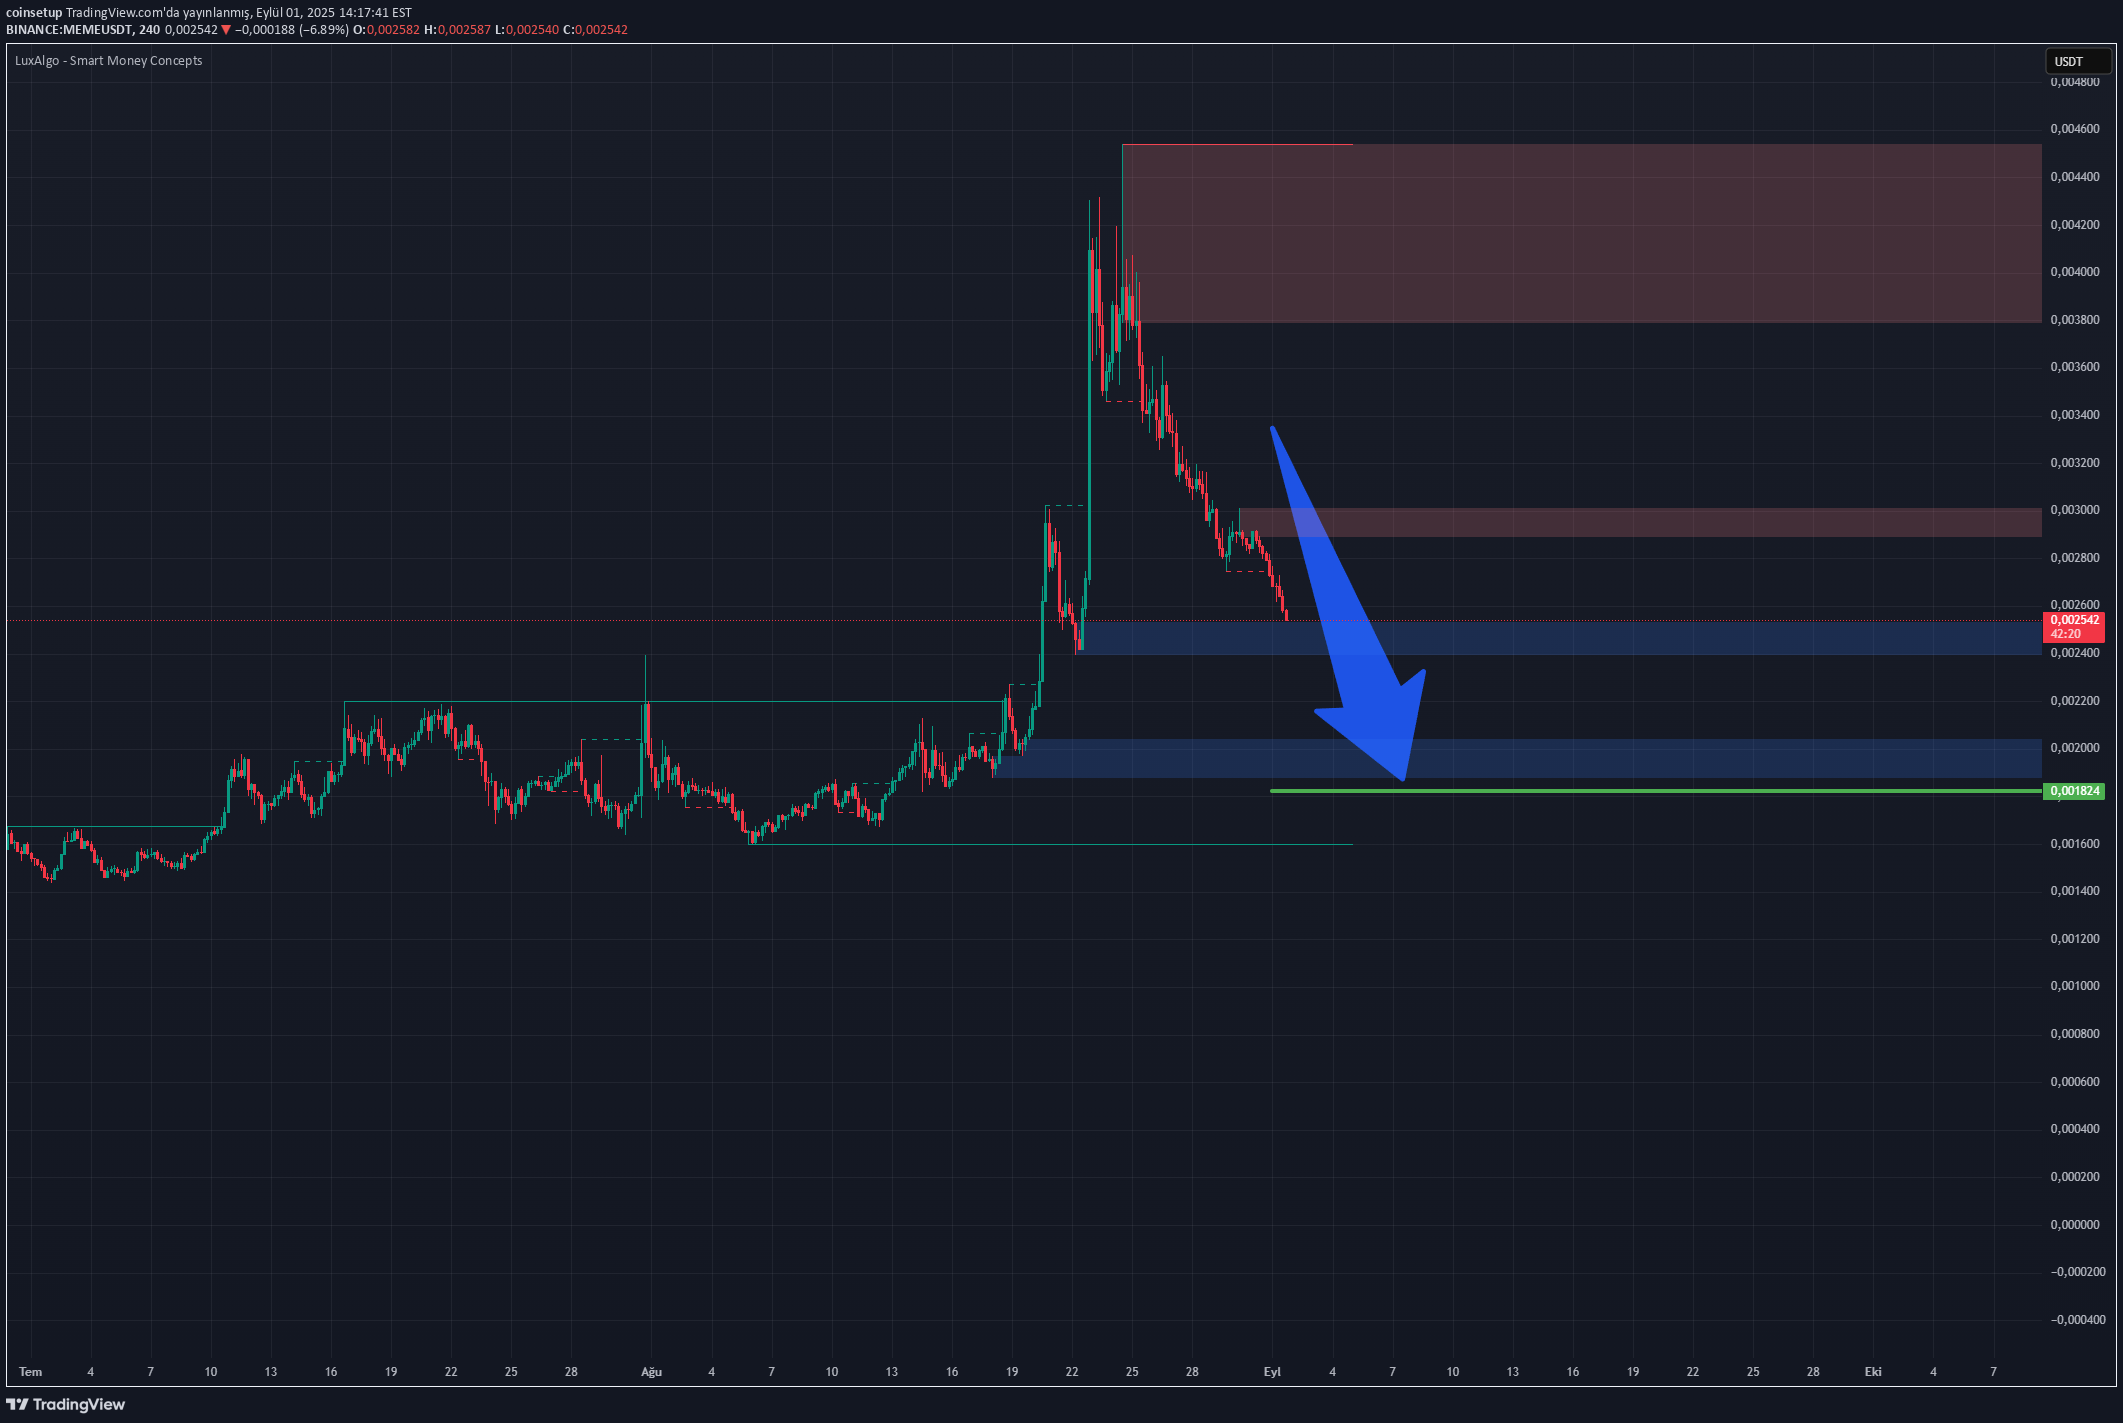
MEME Token is observed in a strong decline tendency. With the withdrawal of the price below the previous support levels, technically, the 0.0018 zone draws attention as a potential target. This scenario may be one of the "loss movements" seen in the token, especially in high volatility. The structures in the graph show that short -term printing and sales pressure continues. However, this analysis is a personal observation based only on technical price movements. ⚠️ Note: This is not an investment advice. MEME , memecoin. It is a project offered throughorg and is a high -risk and speculative asset. Always do your own research (Dor) and evaluate the risks before deciding.
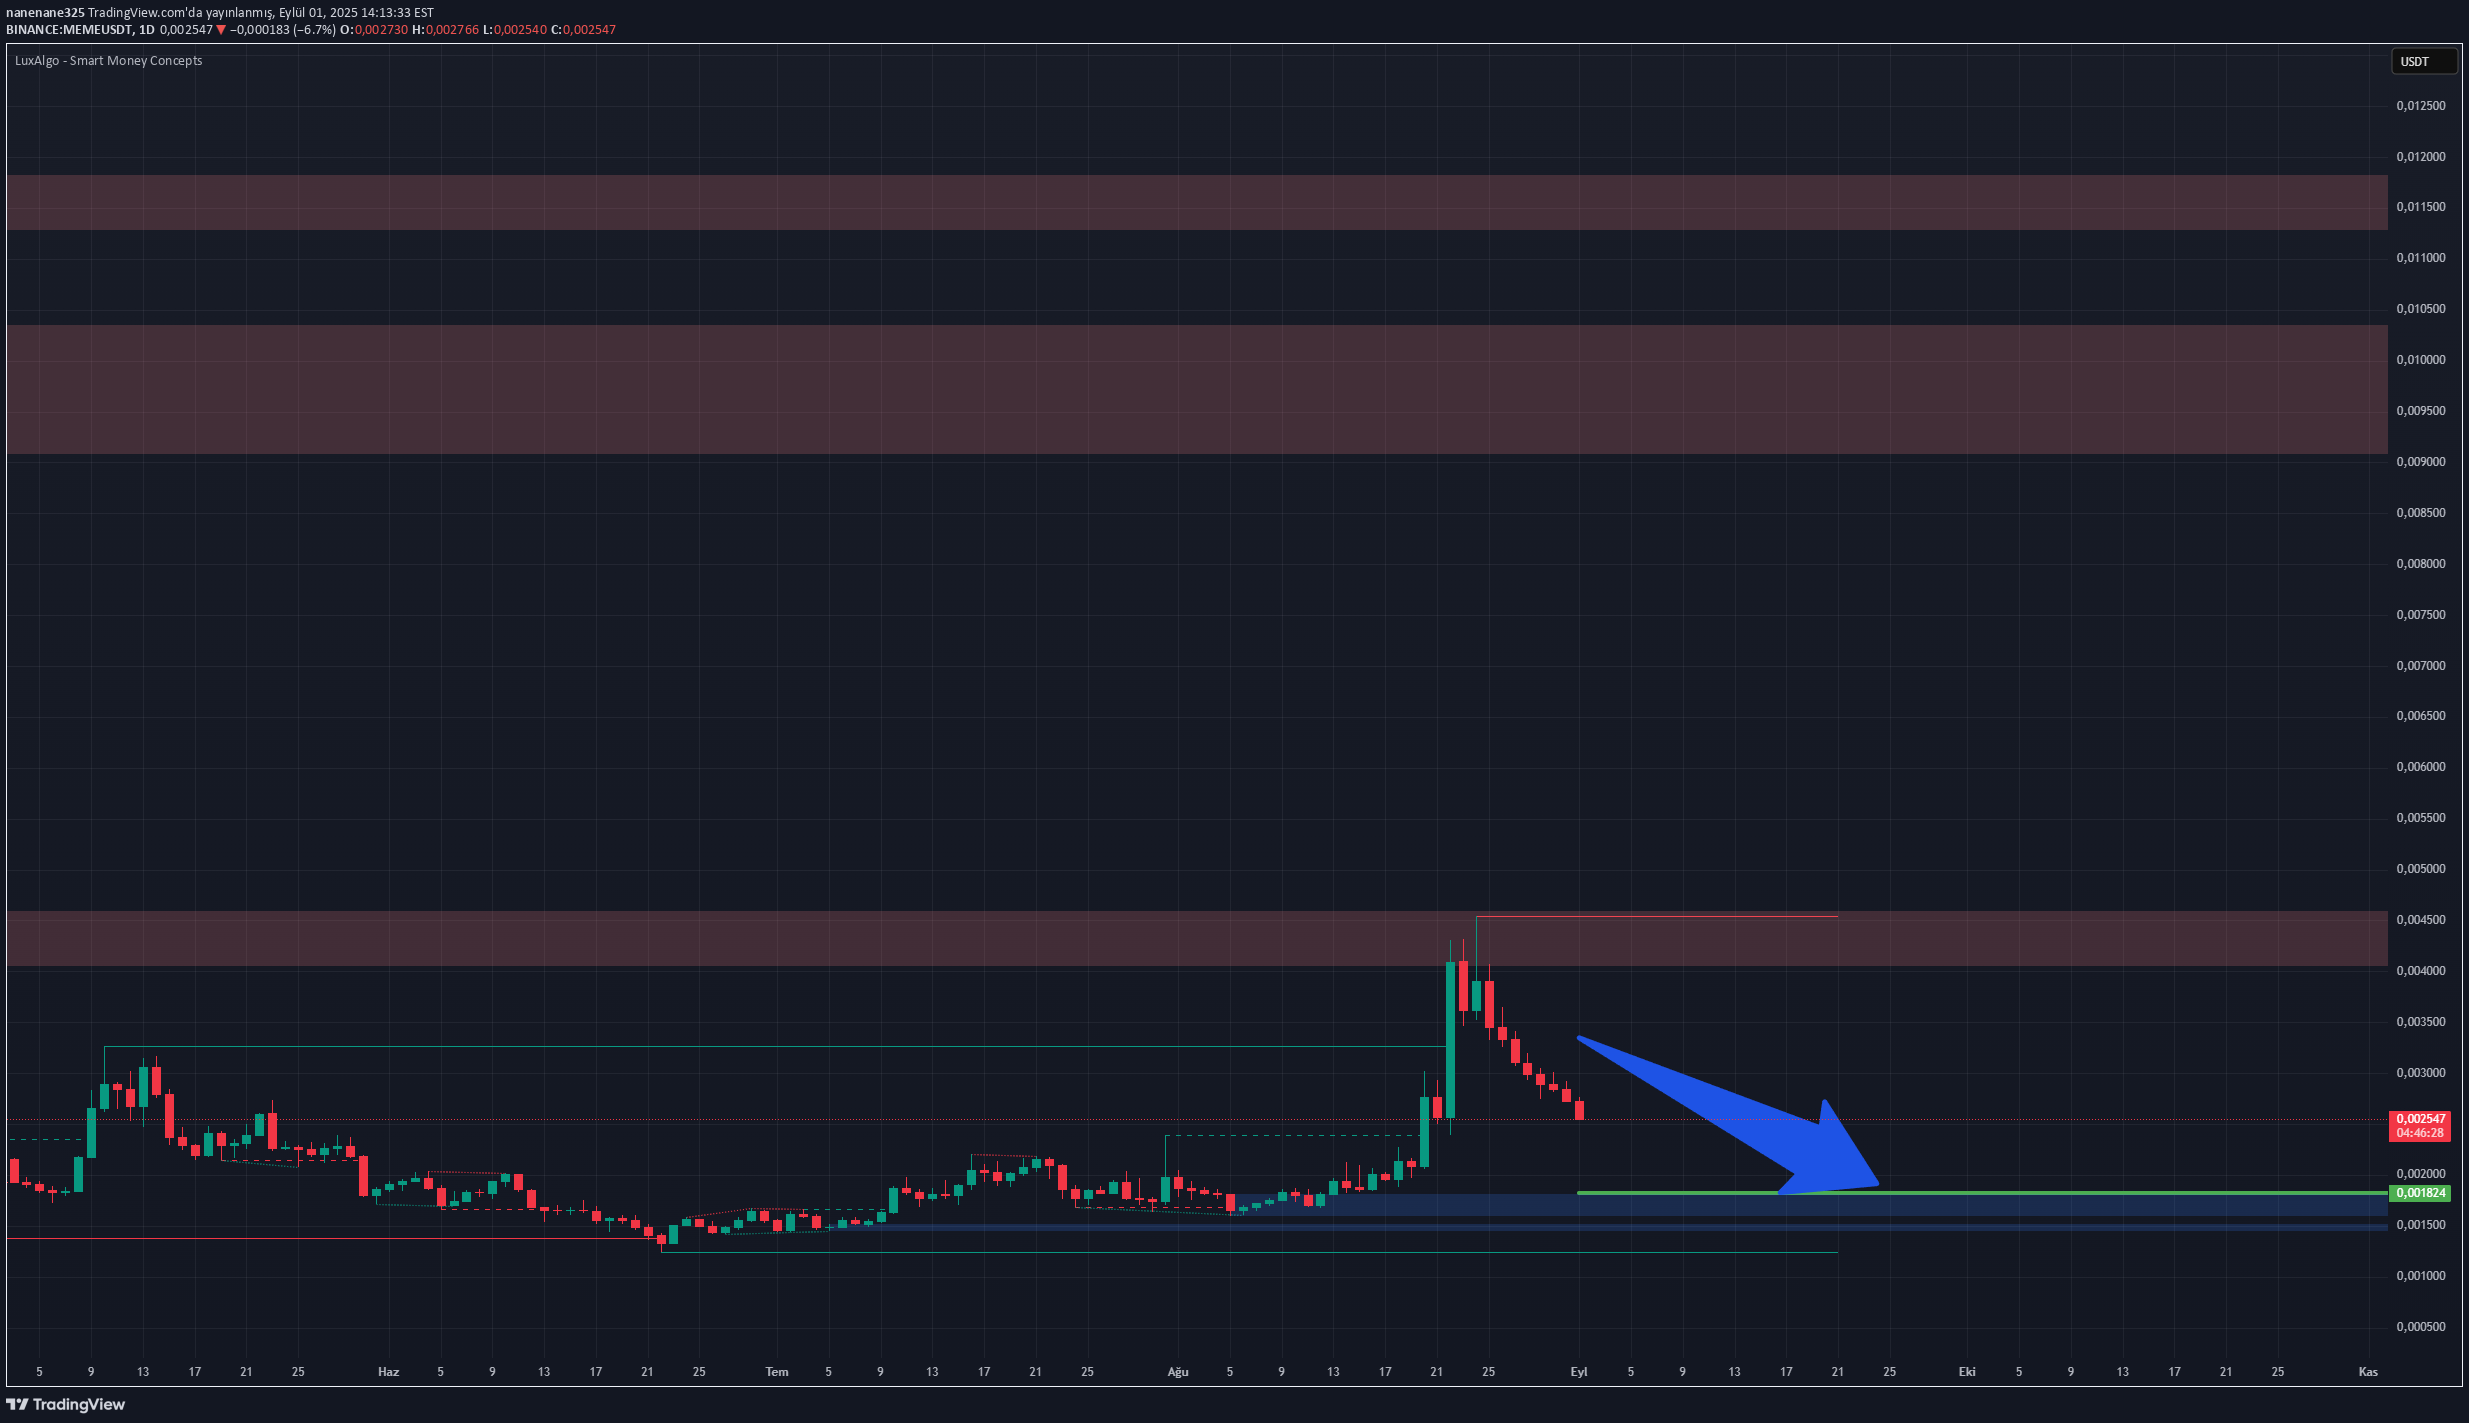
MEME Token is observed in a strong decline tendency. With the withdrawal of the price below the previous support levels, technically, the 0.0018 zone draws attention as a potential target. This scenario may be one of the "loss movements" seen in the token, especially in high volatility. The structures in the graph show that short -term printing and sales pressure continues. However, this analysis is a personal observation based only on technical price movements. ⚠️ Note: This is not an investment advice. MEME , memecoin. It is a project offered throughorg and is a high -risk and speculative asset. Always do your own research (Dor) and evaluate the risks before deciding.

CryptoAnalystSignal
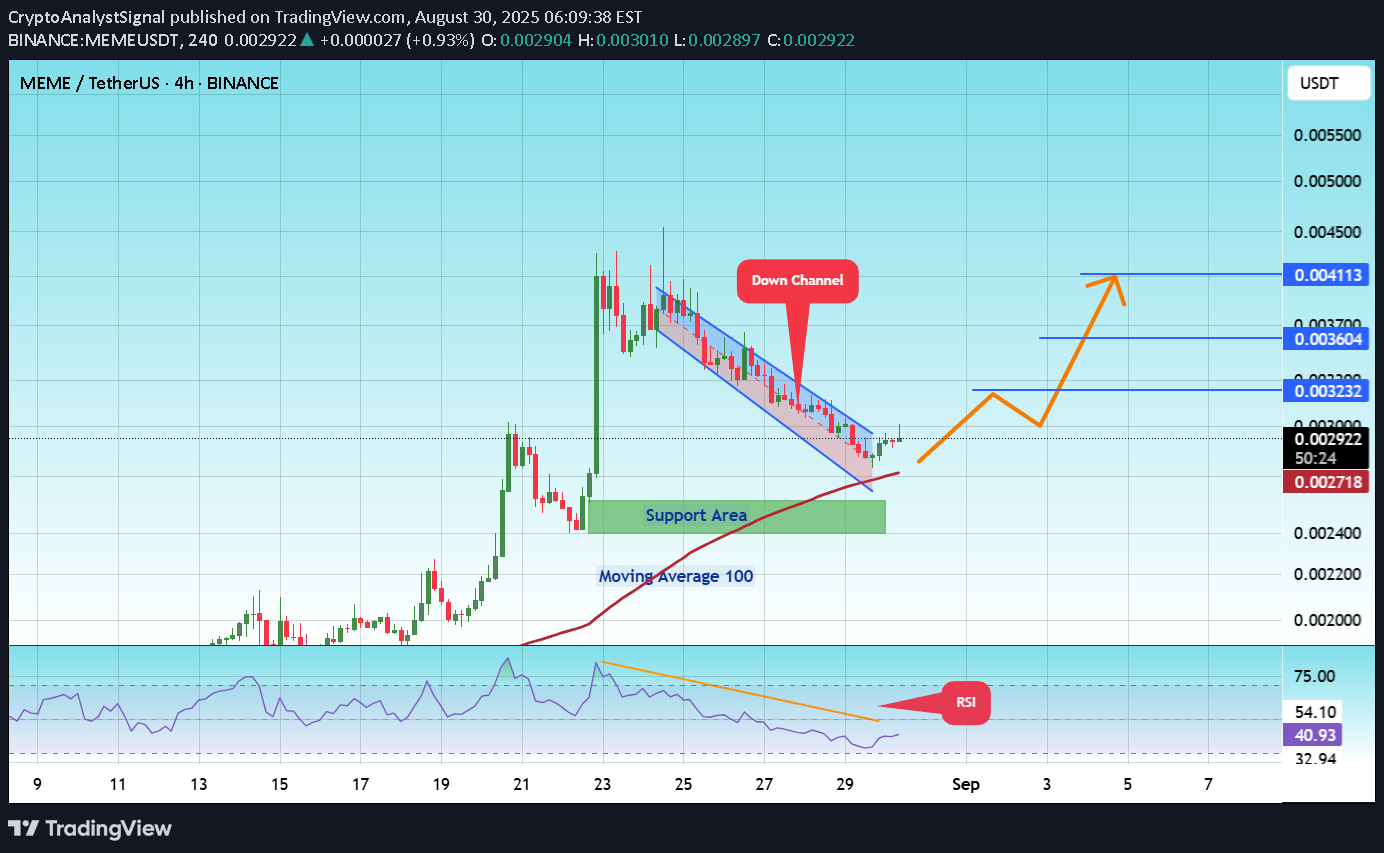
#MEME The price is moving within a descending channel on the 1-hour frame and is expected to break and continue upward. We have a trend to stabilize above the 100 moving average once again. We have a downtrend on the RSI indicator that supports the upward break. We have a support area at the lower boundary of the channel at 0.002644, acting as strong support from which the price can rebound. We have a major support area in green that pushed the price upward at 0.002447. Entry price: 0.02929. First target: 0.003232. Second target: 0.003604. Third target: 0.004113. To manage risk, don't forget stop loss and capital management. When you reach the first target, save some profits and then change the stop order to an entry order. For inquiries, please comment. Thank you.

OlegDC


jauagwjwjn

Alpha-GoldFX
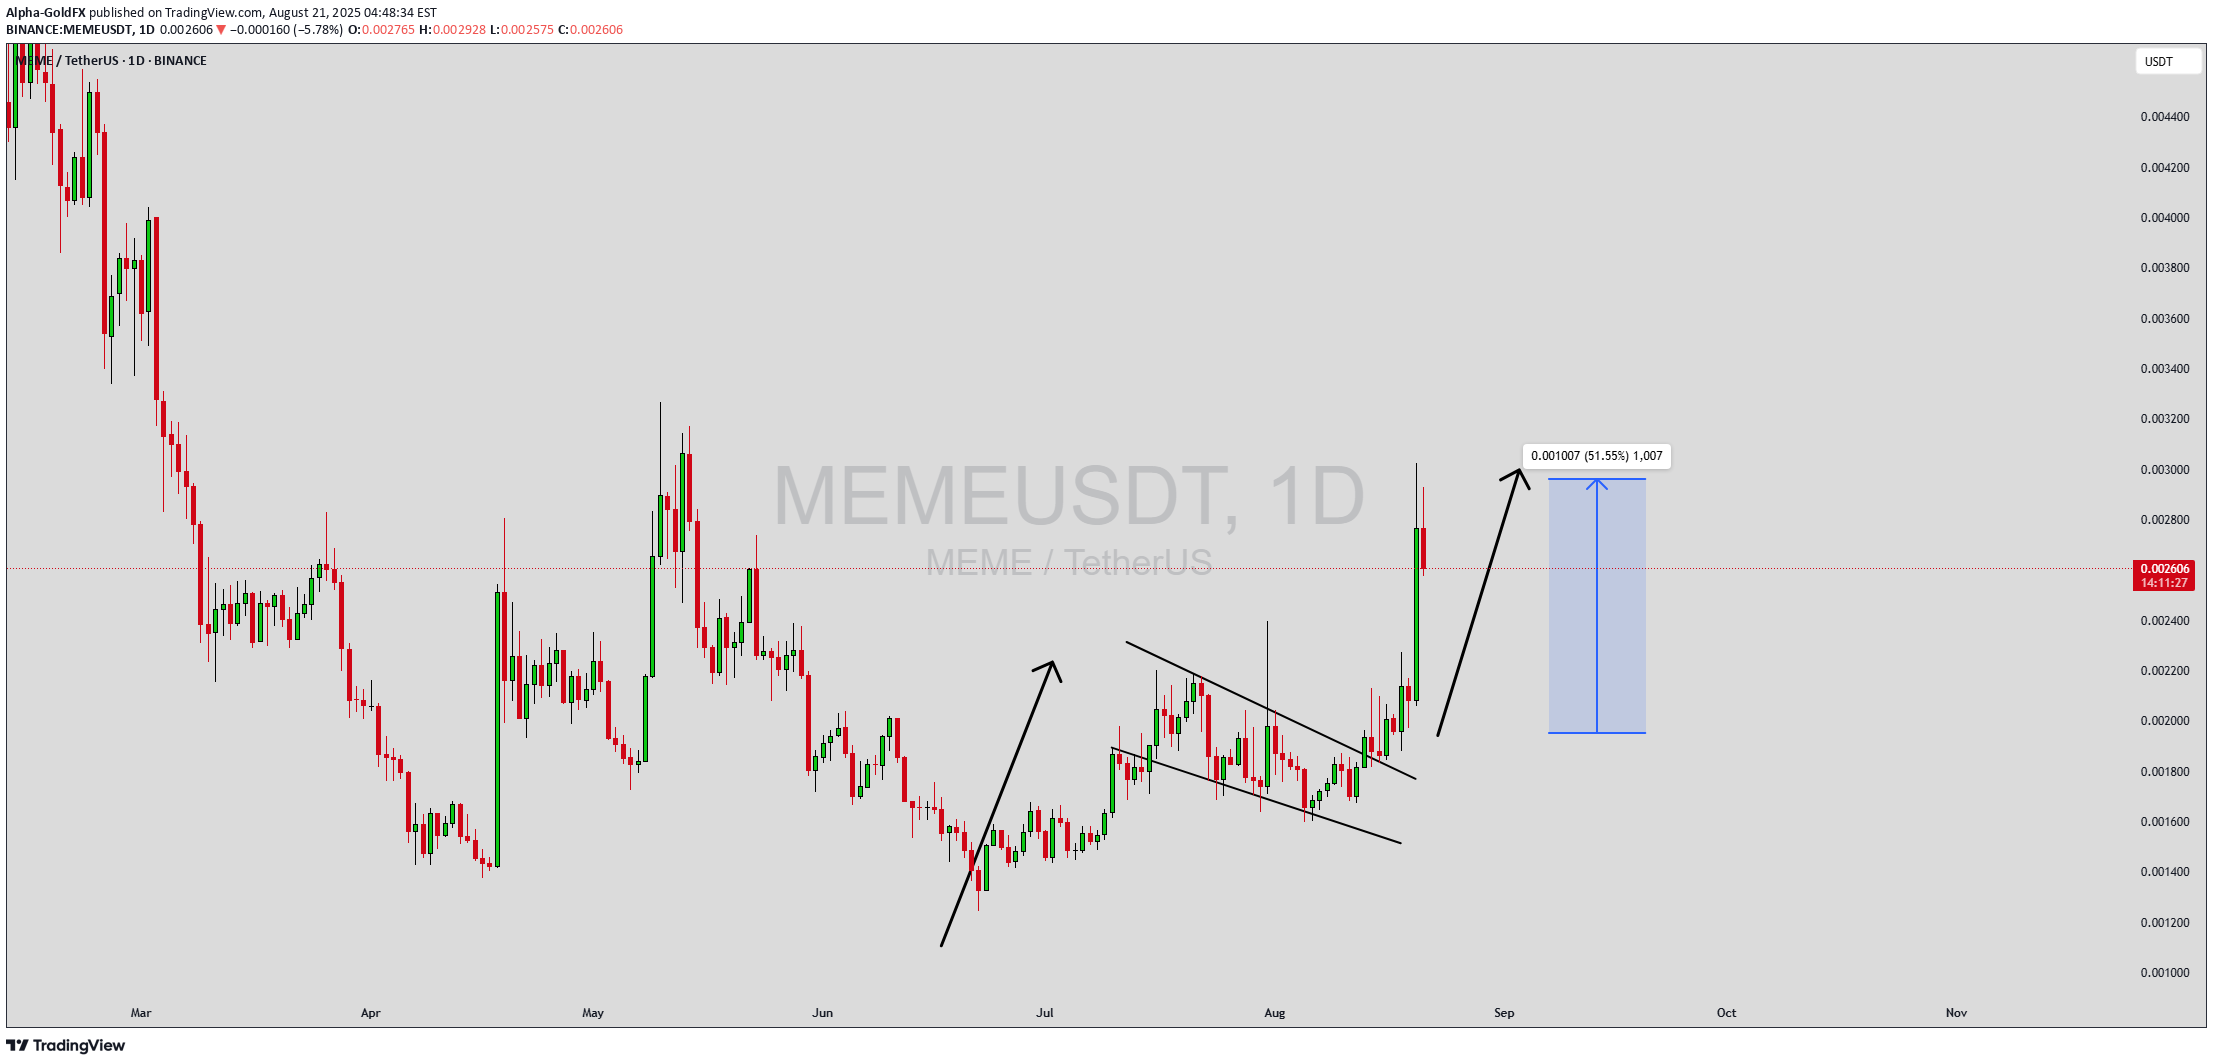
MEMEUSDT has recently broken out from a falling channel pattern, a structure that typically signals a bullish continuation. This breakout is backed by rising trading volume, which further validates the strength behind the move. As the price pushes above the channel resistance, the projected upside suggests a potential gain of 40% to 50%+, making it a coin of interest for short-term traders looking for high-probability setups. The price action also reflects growing buyer confidence, with consecutive higher lows forming a strong technical base for further momentum. The chart structure highlights MEME's ability to hold key support levels even during minor pullbacks, suggesting that accumulation has been ongoing during the consolidation phase. The pattern of previous impulsive upward movements, followed by controlled corrections, fits the classic framework of bullish price cycles. If MEME continues to trade above the breakout level, a rally towards the 0.0030 USDT zone becomes increasingly likely. Investor sentiment around MEME is shifting positively, as reflected in social metrics and increased spot trading activity. This interest isn't just retail hype—it's also attracting strategic participants positioning for potential ✅ Show your support by hitting the like button and ✅ Leaving a comment below! (What is You opinion about this Coin) Your feedback and engagement keep me inspired to share more insightful market analysis with you!

Fahad-Rafique
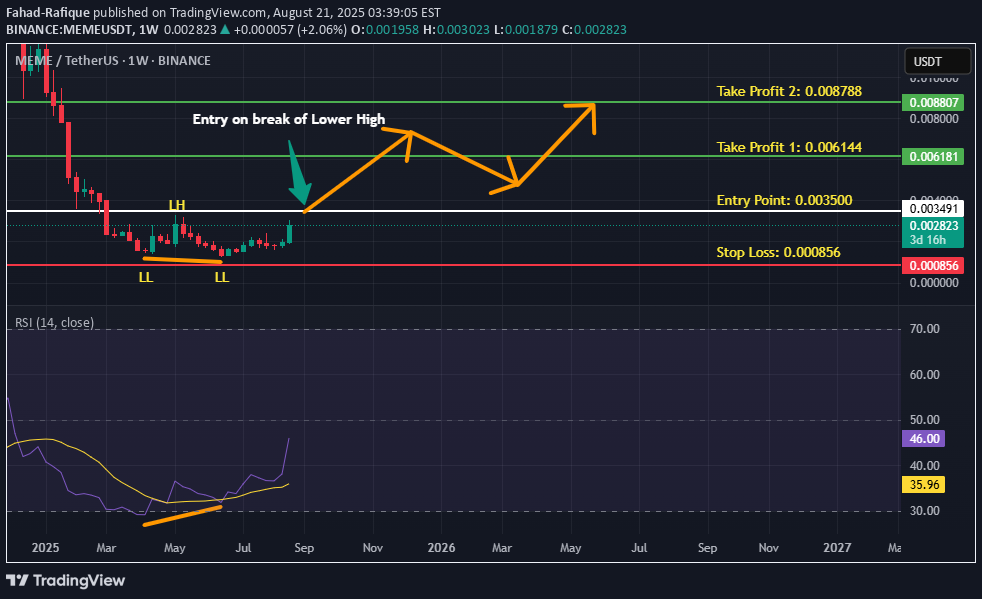
Price was in a strong downtrend, however double bottom reversal pattern coupled with bullish divergence on weekly time frame hints the return of bulls. If last lower high is broken with good volume then we can expect a bullish reversal as per Dow theory. Targets are mentioned on the chart.

pasamalum
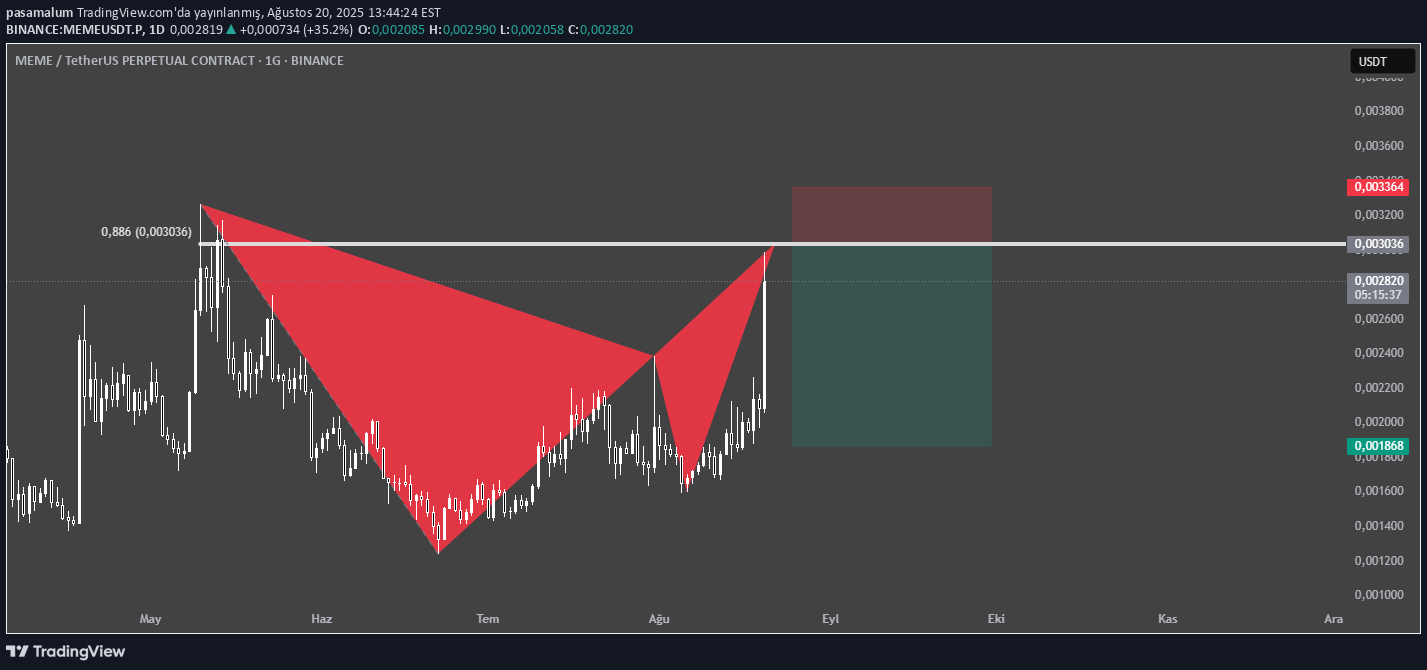
Bearish bat formation is a formation that is frequently followed by investors among harmonic patterns and gives reliable signals. Starting from the current 1.74 level, the D point of the formation can be followed for educational purposes in contact with 0.886 YTD
Disclaimer
Any content and materials included in Sahmeto's website and official communication channels are a compilation of personal opinions and analyses and are not binding. They do not constitute any recommendation for buying, selling, entering or exiting the stock market and cryptocurrency market. Also, all news and analyses included in the website and channels are merely republished information from official and unofficial domestic and foreign sources, and it is obvious that users of the said content are responsible for following up and ensuring the authenticity and accuracy of the materials. Therefore, while disclaiming responsibility, it is declared that the responsibility for any decision-making, action, and potential profit and loss in the capital market and cryptocurrency market lies with the trader.