
OlegDC
@t_OlegDC

What symbols does the trader recommend buying?
Purchase History
پیام های تریدر
Filter
OlegDC
تحلیل شگفتانگیز STRK/USD: احتمال صعود ۲۰۰۰٪ و شانس باورنکردنی!
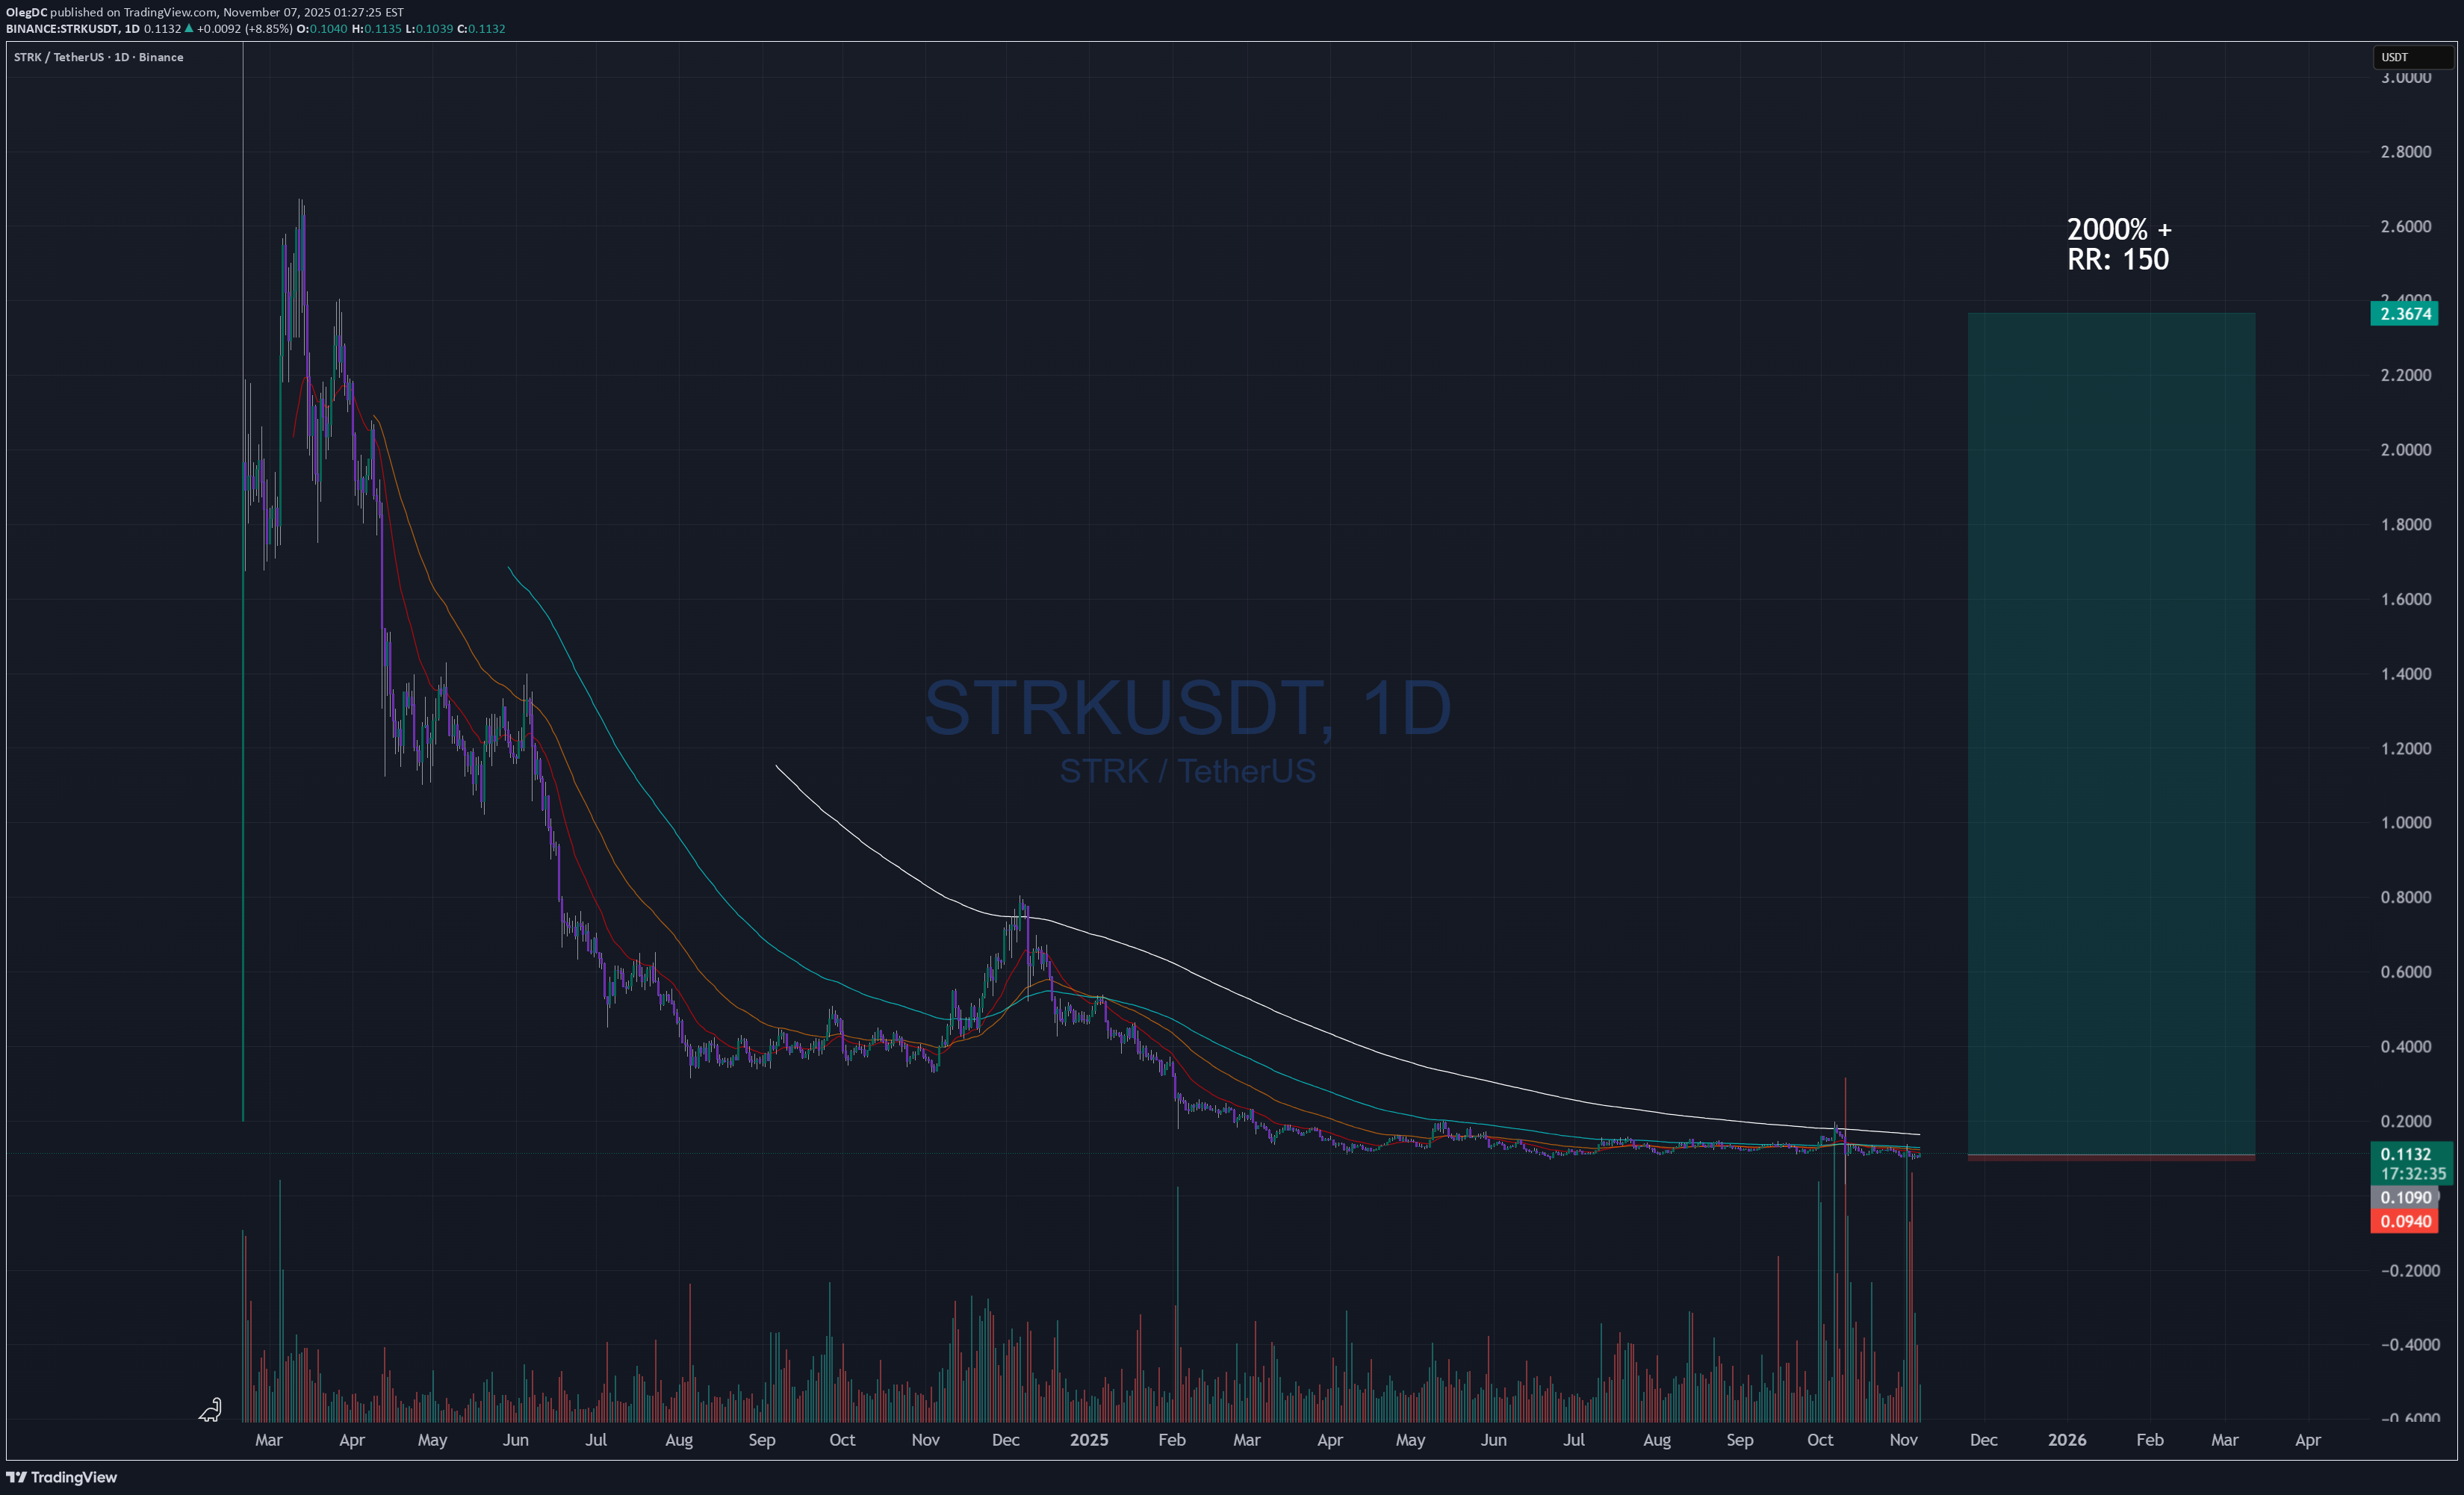
STRKUSD bullish scenario. In case of coming back to those levels, even if its a slight chance, RR: 150 and more than 2000% up. How much would you risk?
OlegDC
تحلیل تکنیکال بیت کوین: رمزگشایی ابر ایچیموکو و اهداف قیمتی تا ۱۰۰ هزار دلار!
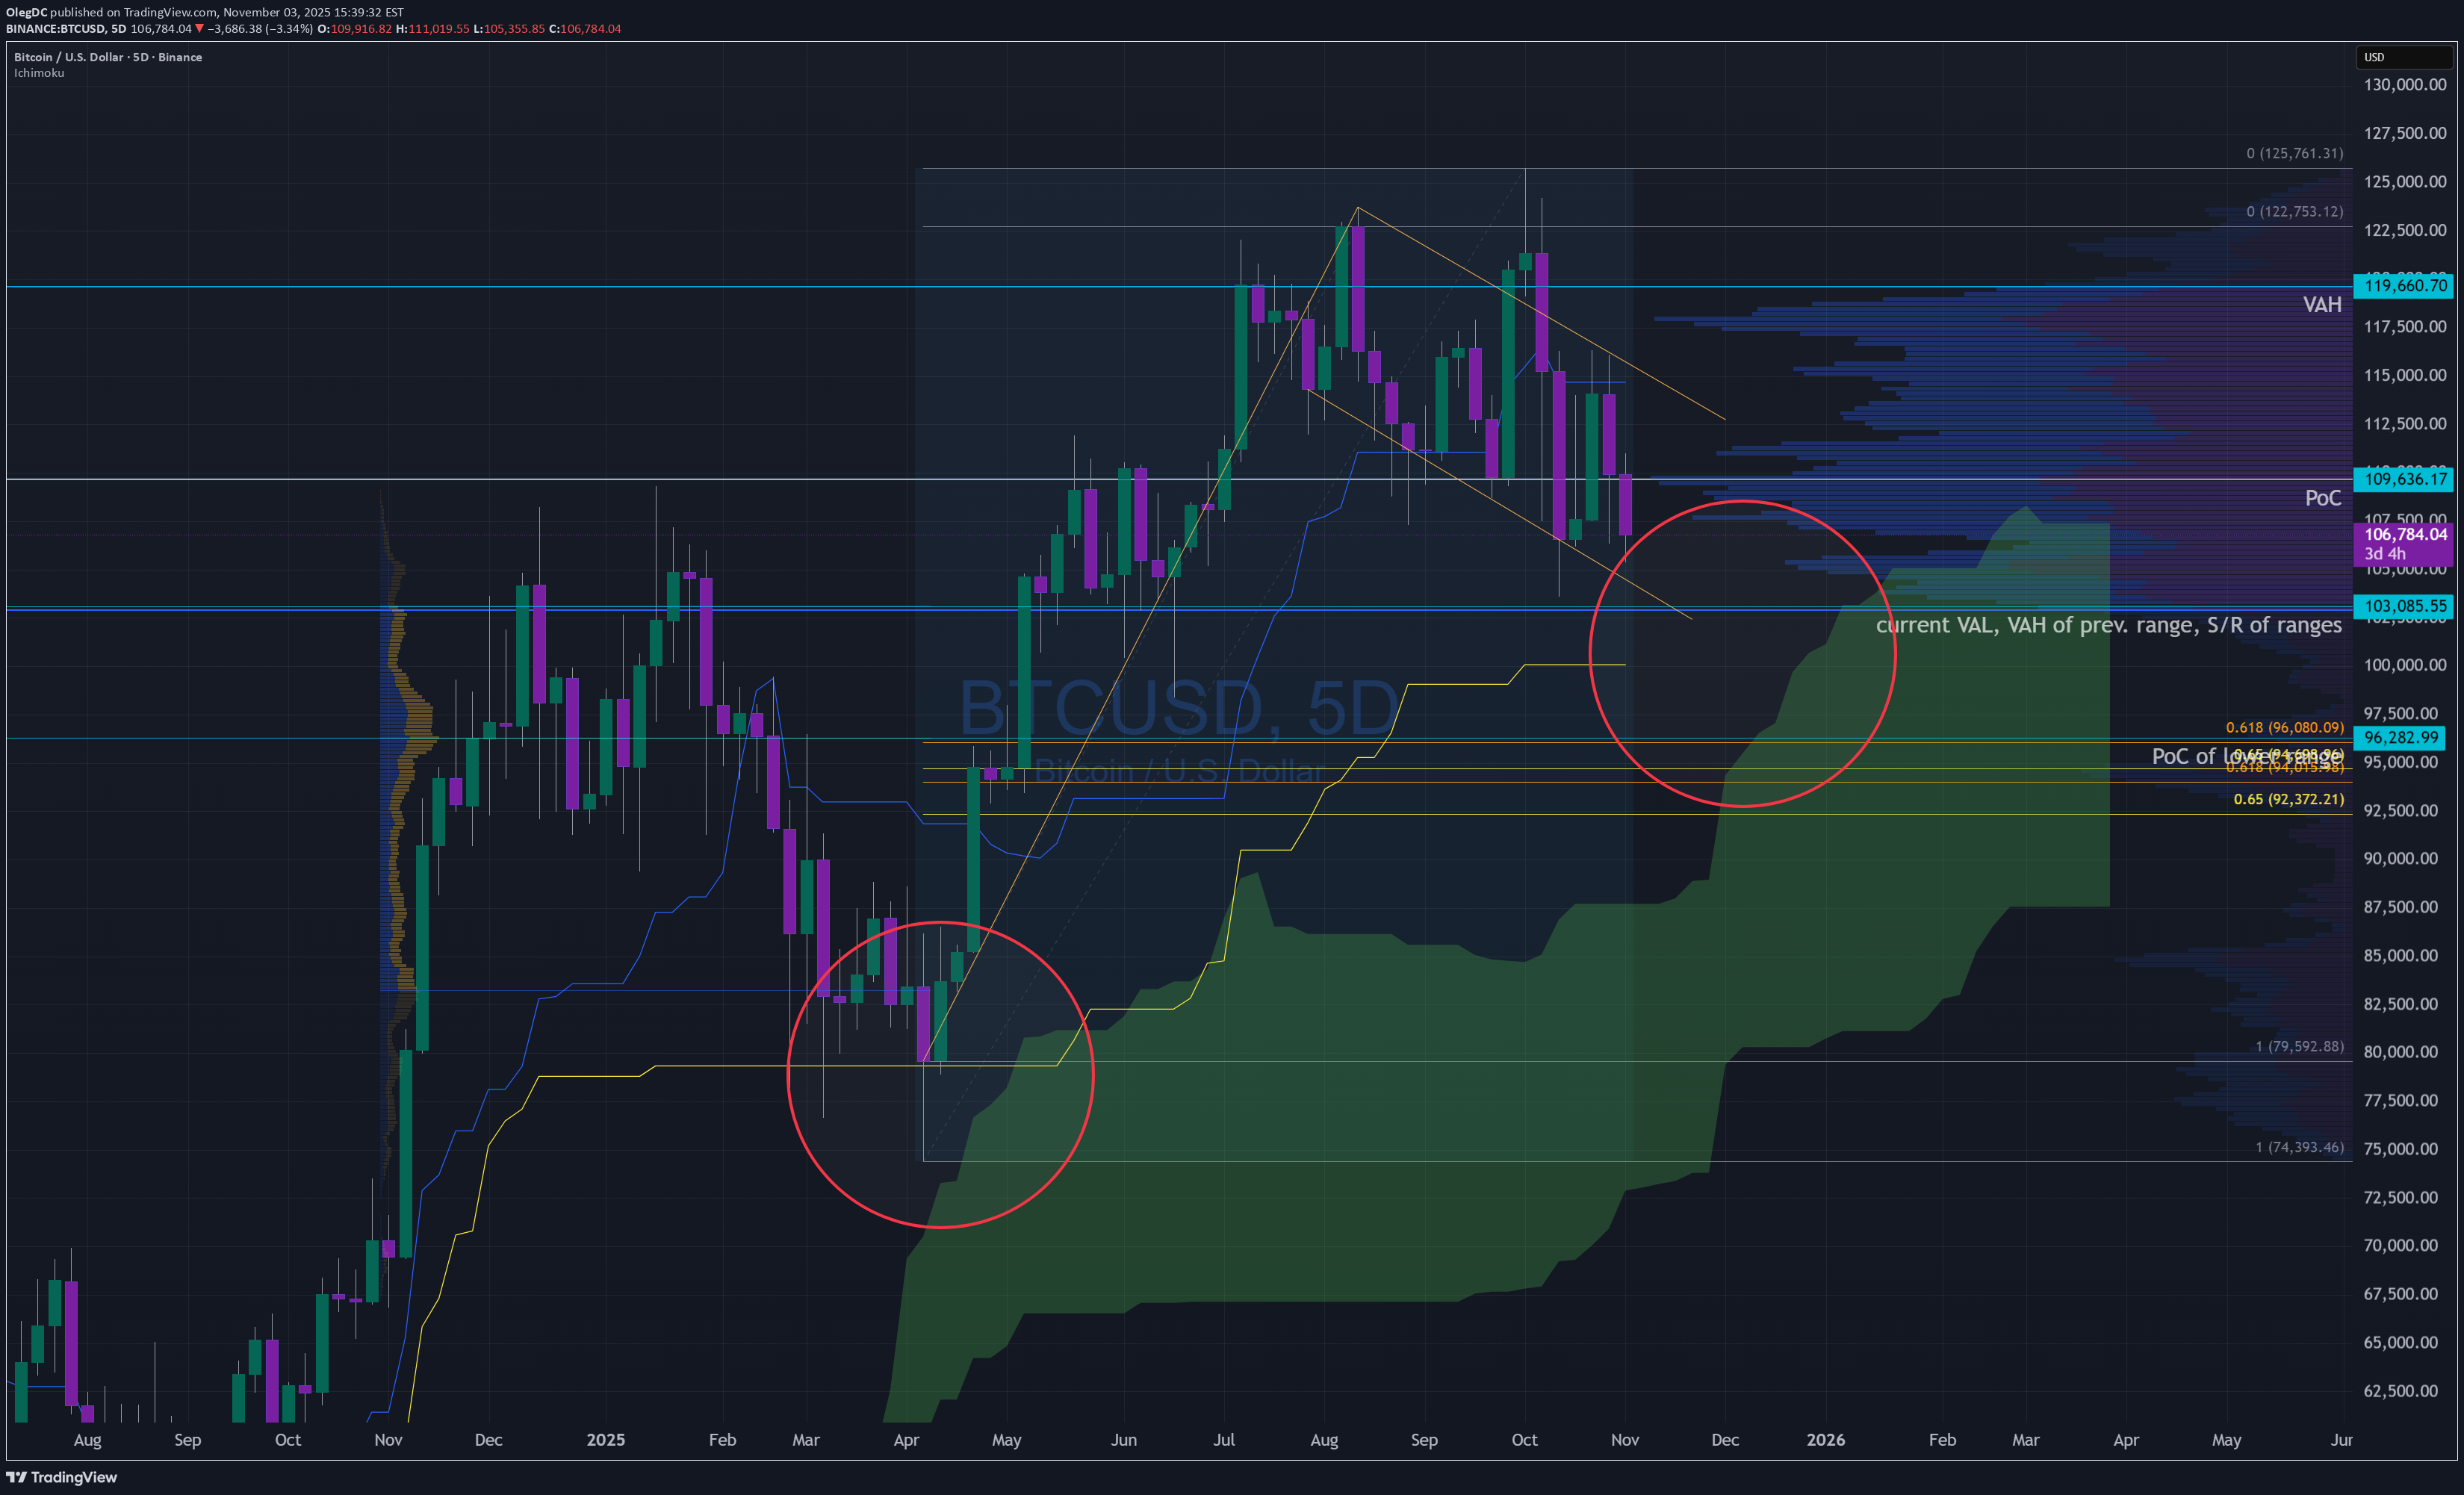
BTC 5D-W. From the perspective of the Ichimoku cloud, everything is looking great, support on weekly is 75K and 90-95K on 5D chart. On macro chart is drawing classic bullish flag, similar we had in the beginning of the year, descending wedge and bounce from the Base of Ichimoku line. When Base line of ichimoku goes flat - expect the price to retorn to it about the time, when it hits the cloud. Two fibbs stretches, from candles and wicks to designate GP area - 92-96K , Just under the Ichimoku base line, and still above the cloud. 102-103K is the area of confluence: S/R of ranges, VAH of prev range and VAL of current range. Im more positive, that price will hit 100K psychological number and will be broken, just because there is a huge low leverage liquidity amd market makers dont care about the chart anymore, All liquidity is at 92K zone. Where 92K is still keeping bullish structure on higher frames, is inside ichimoku cloud on 5D and above weekly, in confluence with GP of the yearly move. So 90-92 would be perfect spooky move to reset sentiments and funding rates.
OlegDC
سناریوی صعودی MYXUSD: فرصت خرید در کف قیمت، انتظار سود 100 برابری!
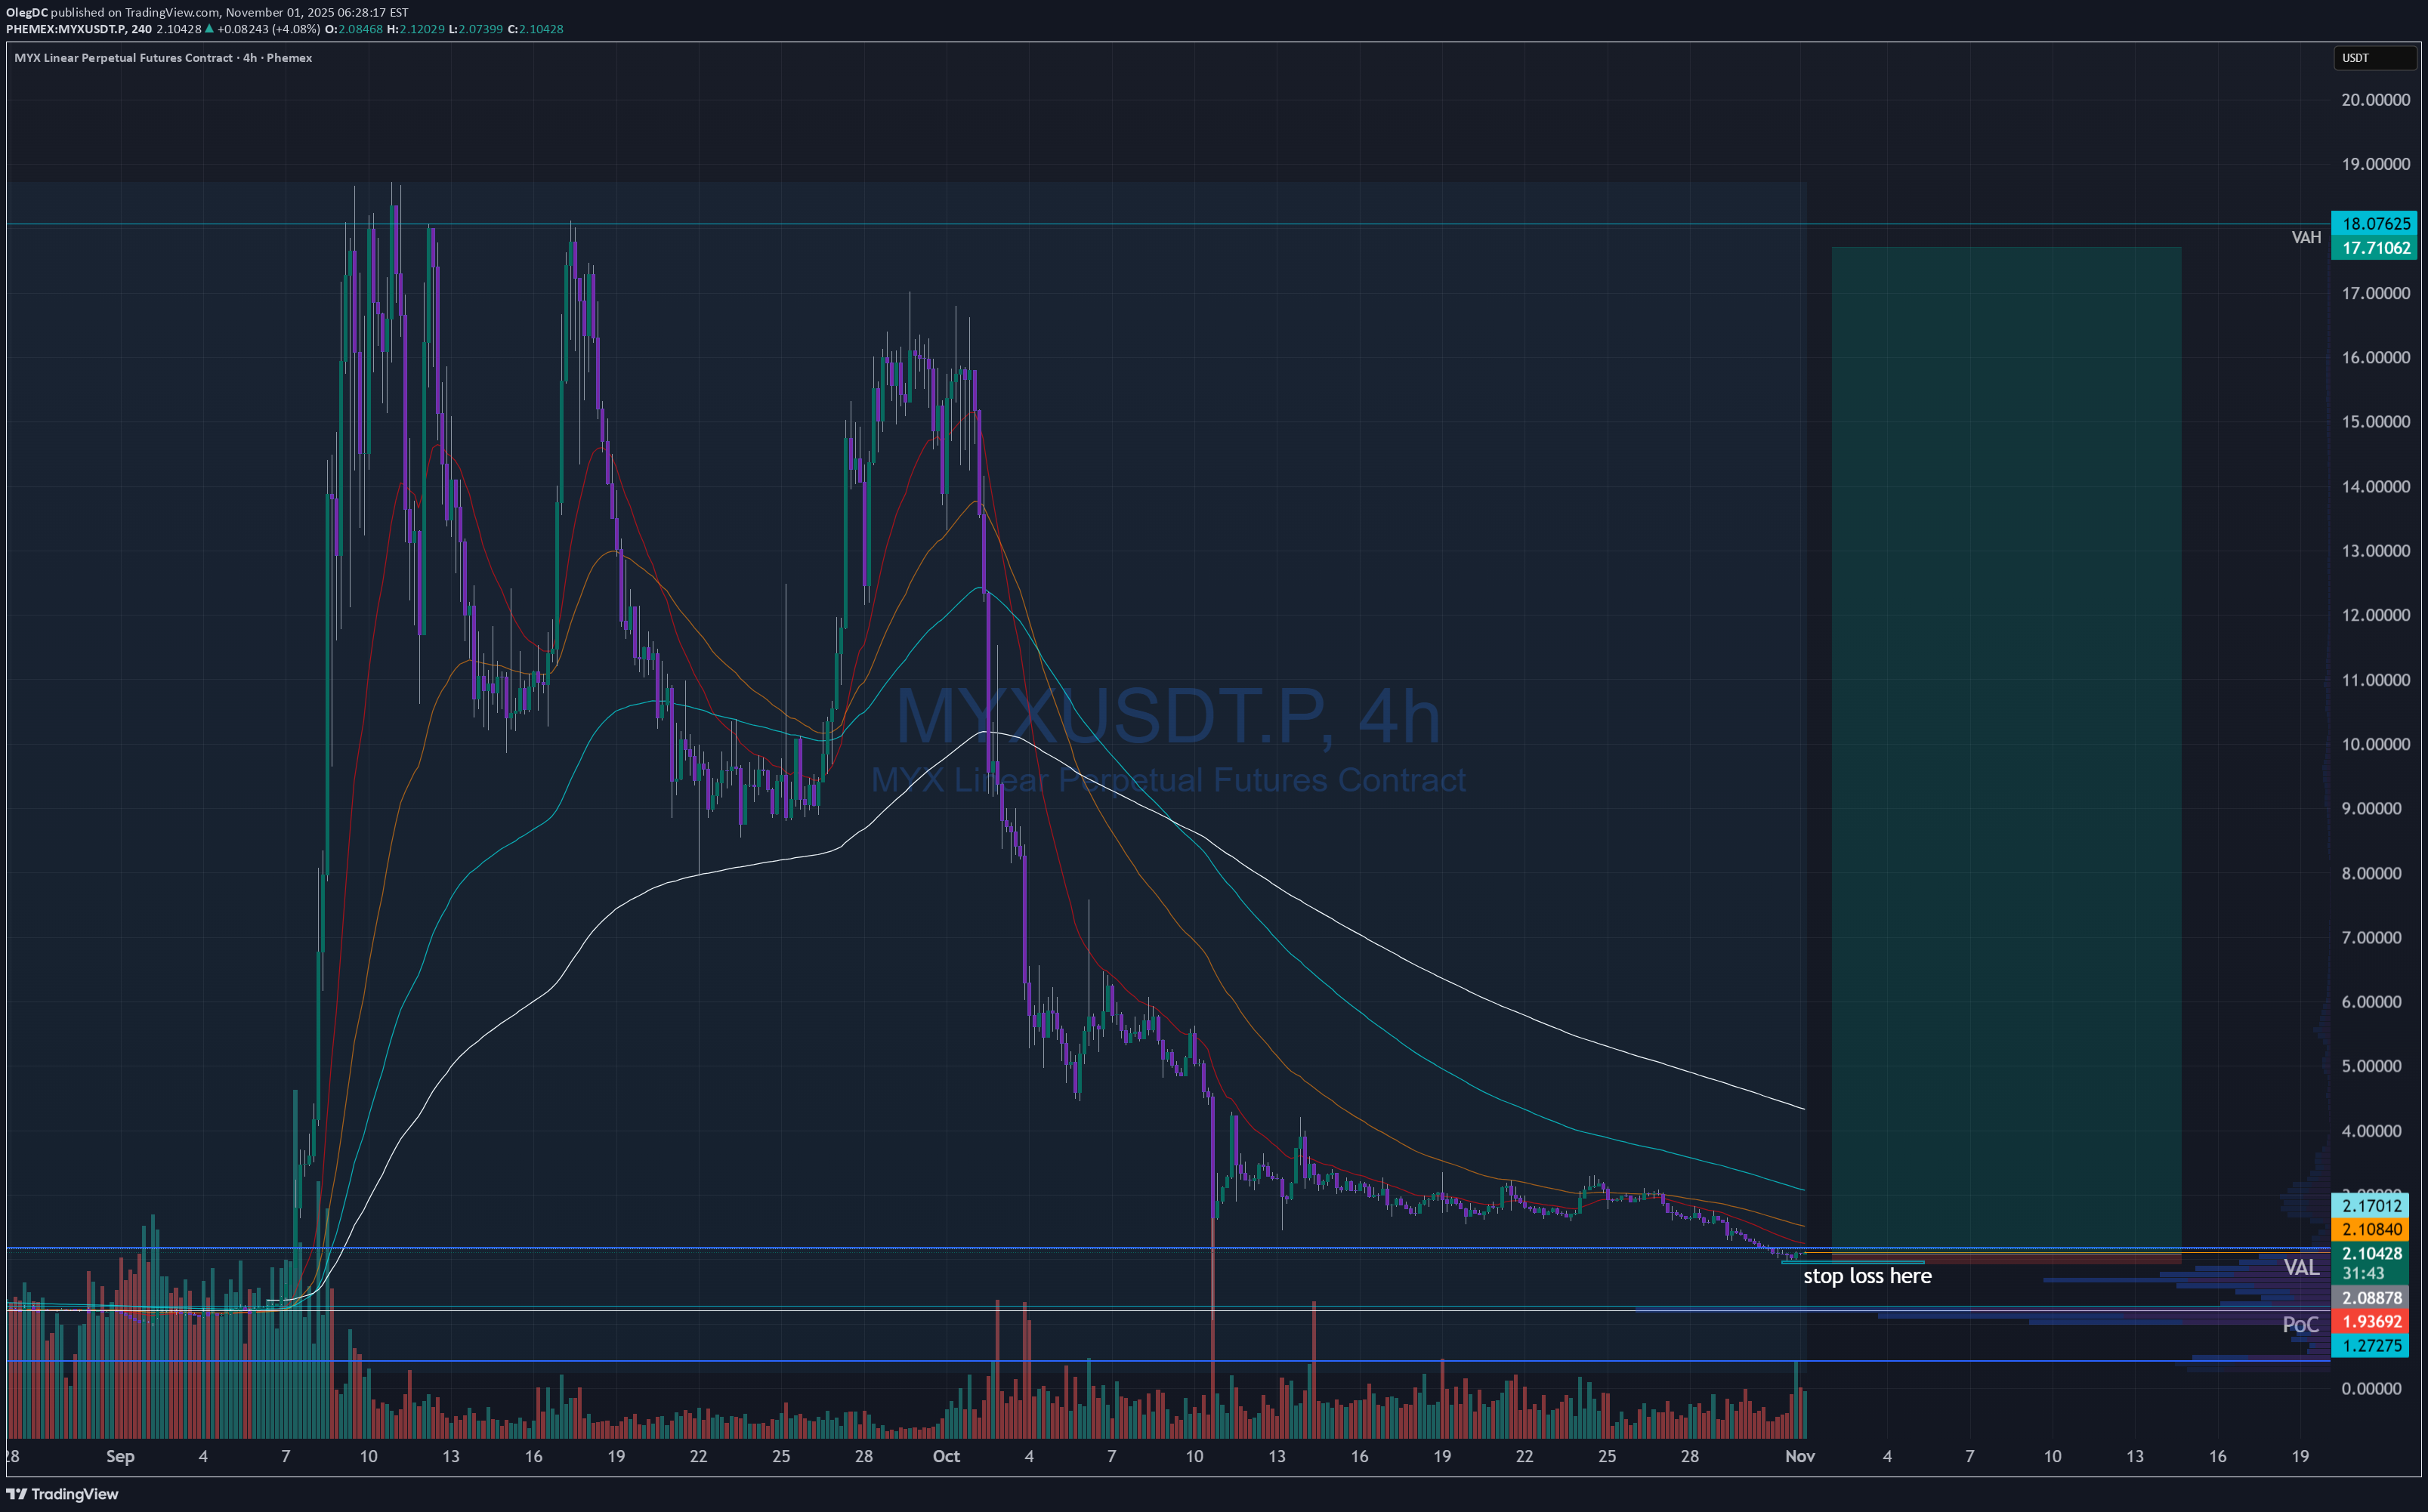
MYXUSD has reached low point, currently at VAL. Perfect entry would be lower at PoC. I guess I have no patience or trying to front run. RR is 100 if it get back to highest point, might take a month of grinding, but Im ready for that. SL is 3% below. Perfect scenario would be either touch VAL or PoC. Time will show.
OlegDC
سناریوی صعودی TAOUSD: ۳ هدف قیمتی هیجانانگیز با تایید فیبوناچی!
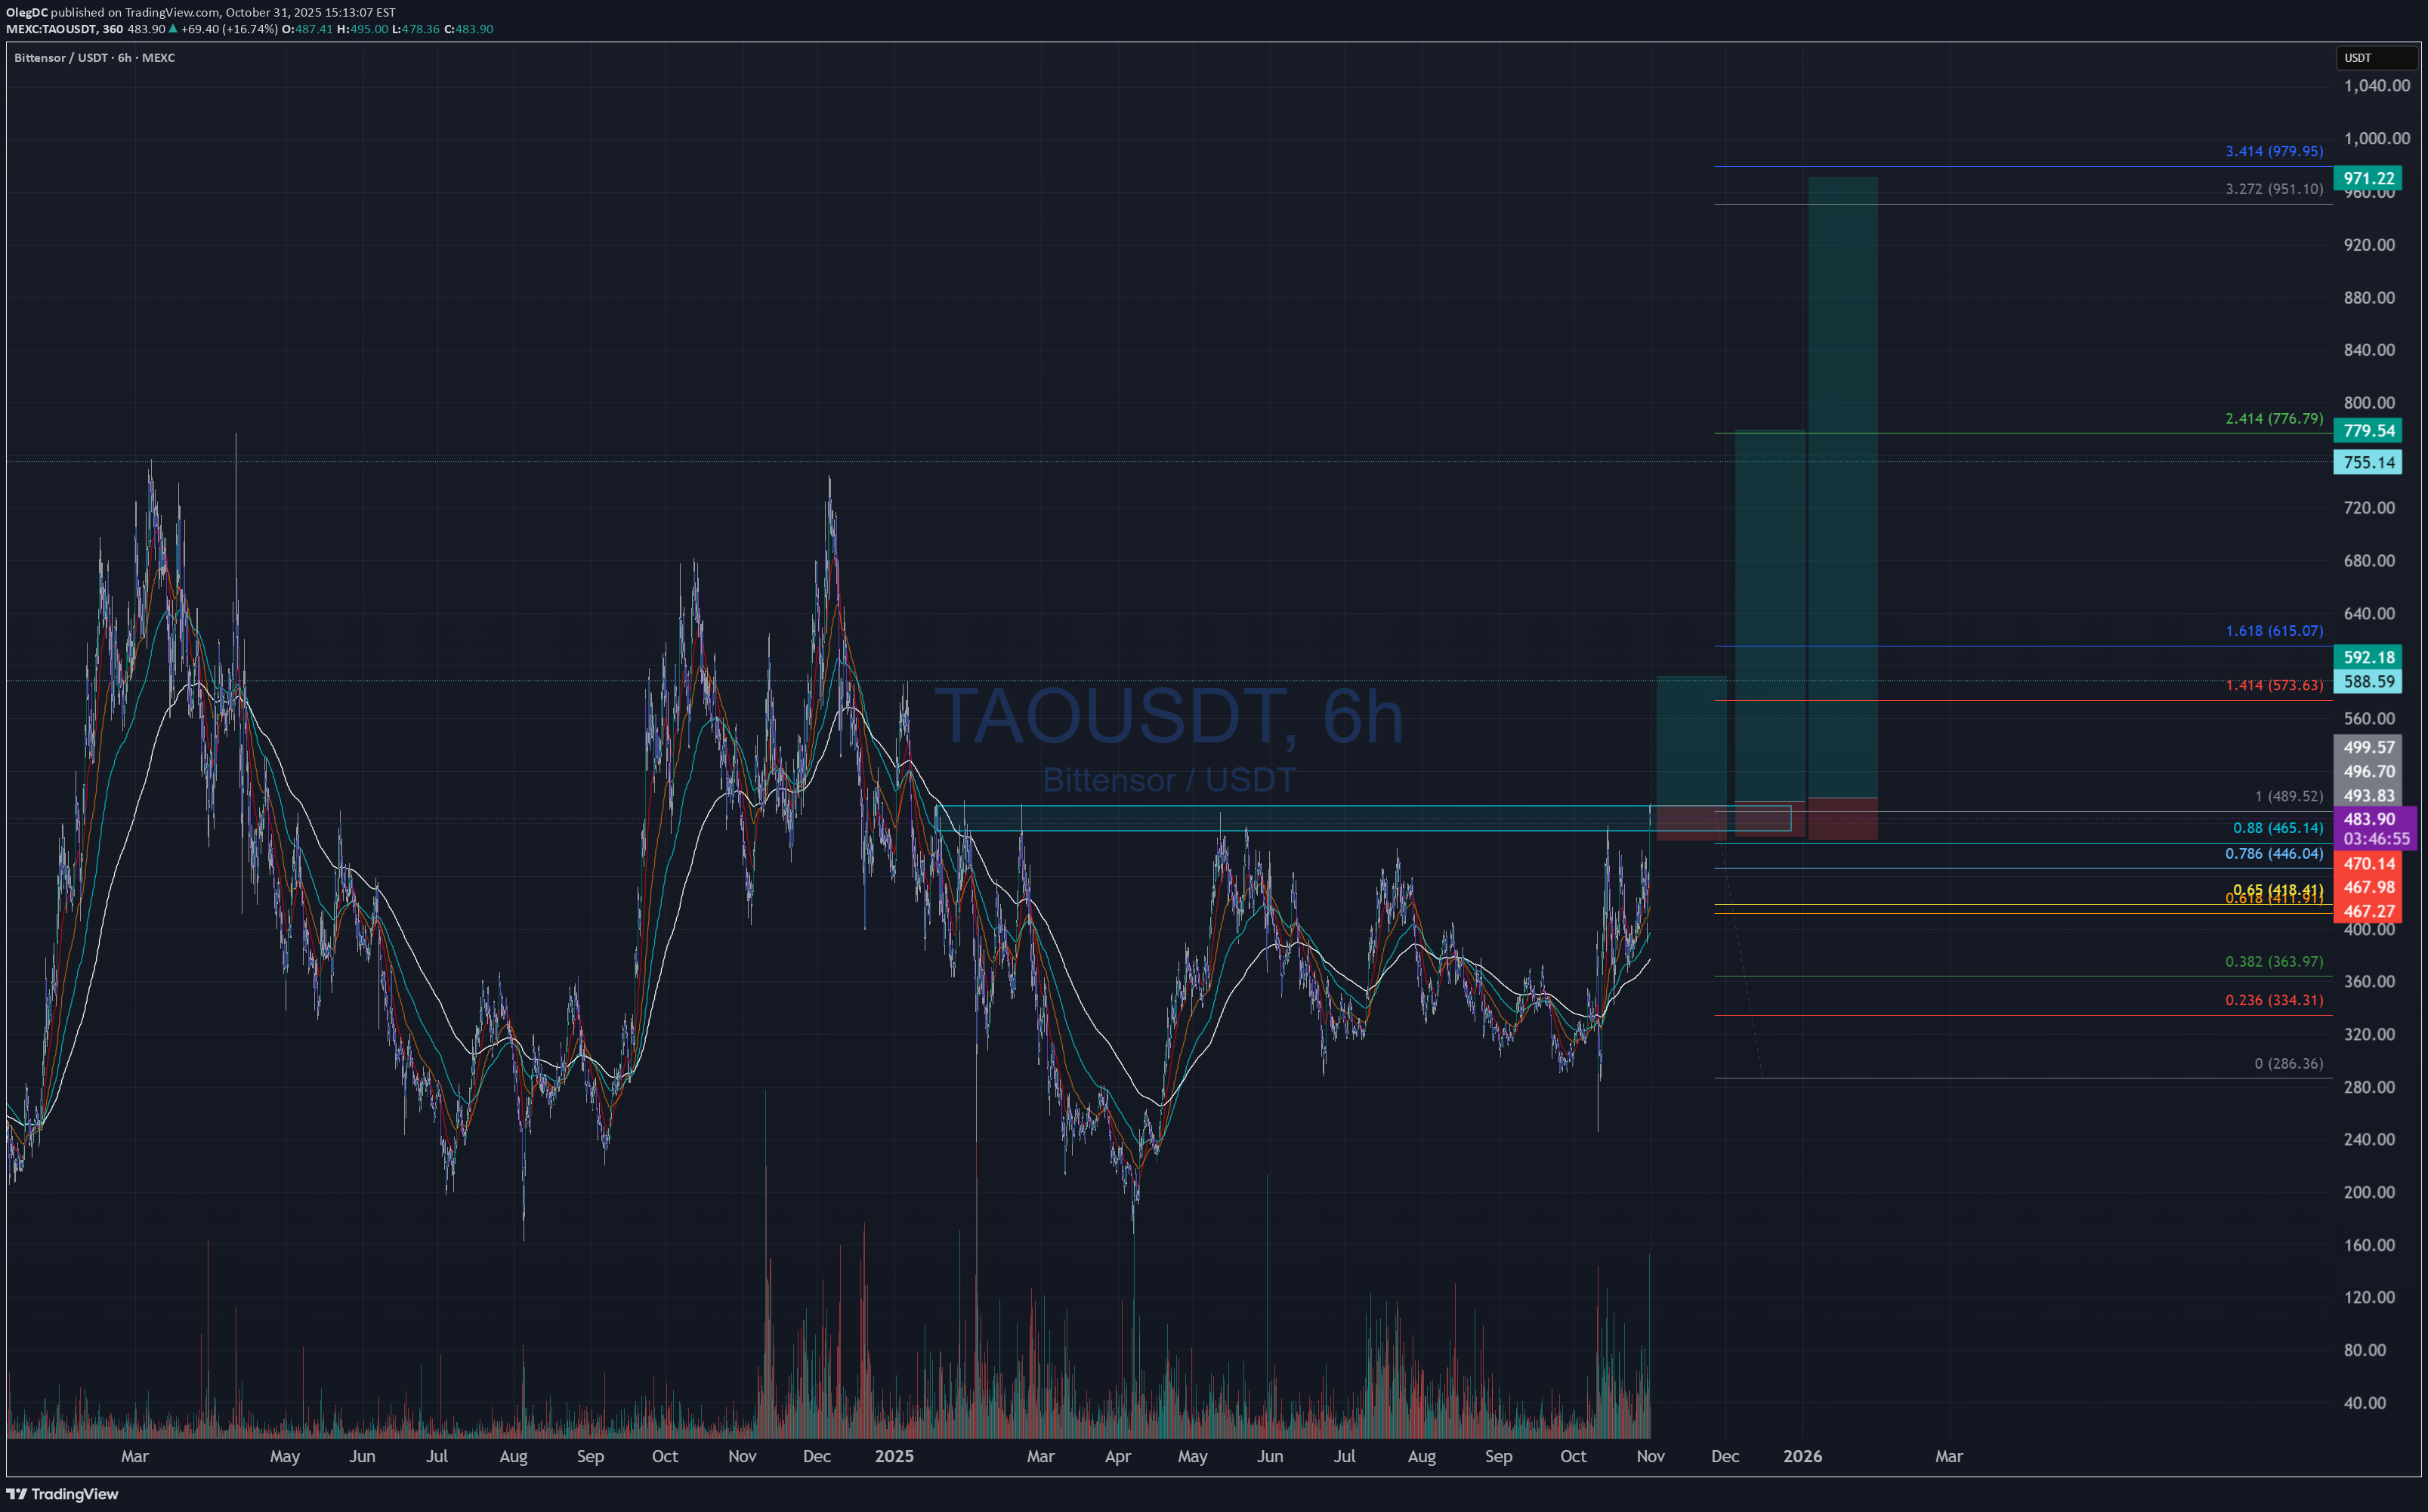
TAOUSD is breaking the resistance, Im looking for 3 areas, price can hit. Those areas are R?S and are in confluence with fibbs.
OlegDC
خرید قطعی یورو/دلار (EDUUSD): منطقه انباشت، عبور از VWAP و هدفهای صعودی بزرگ!
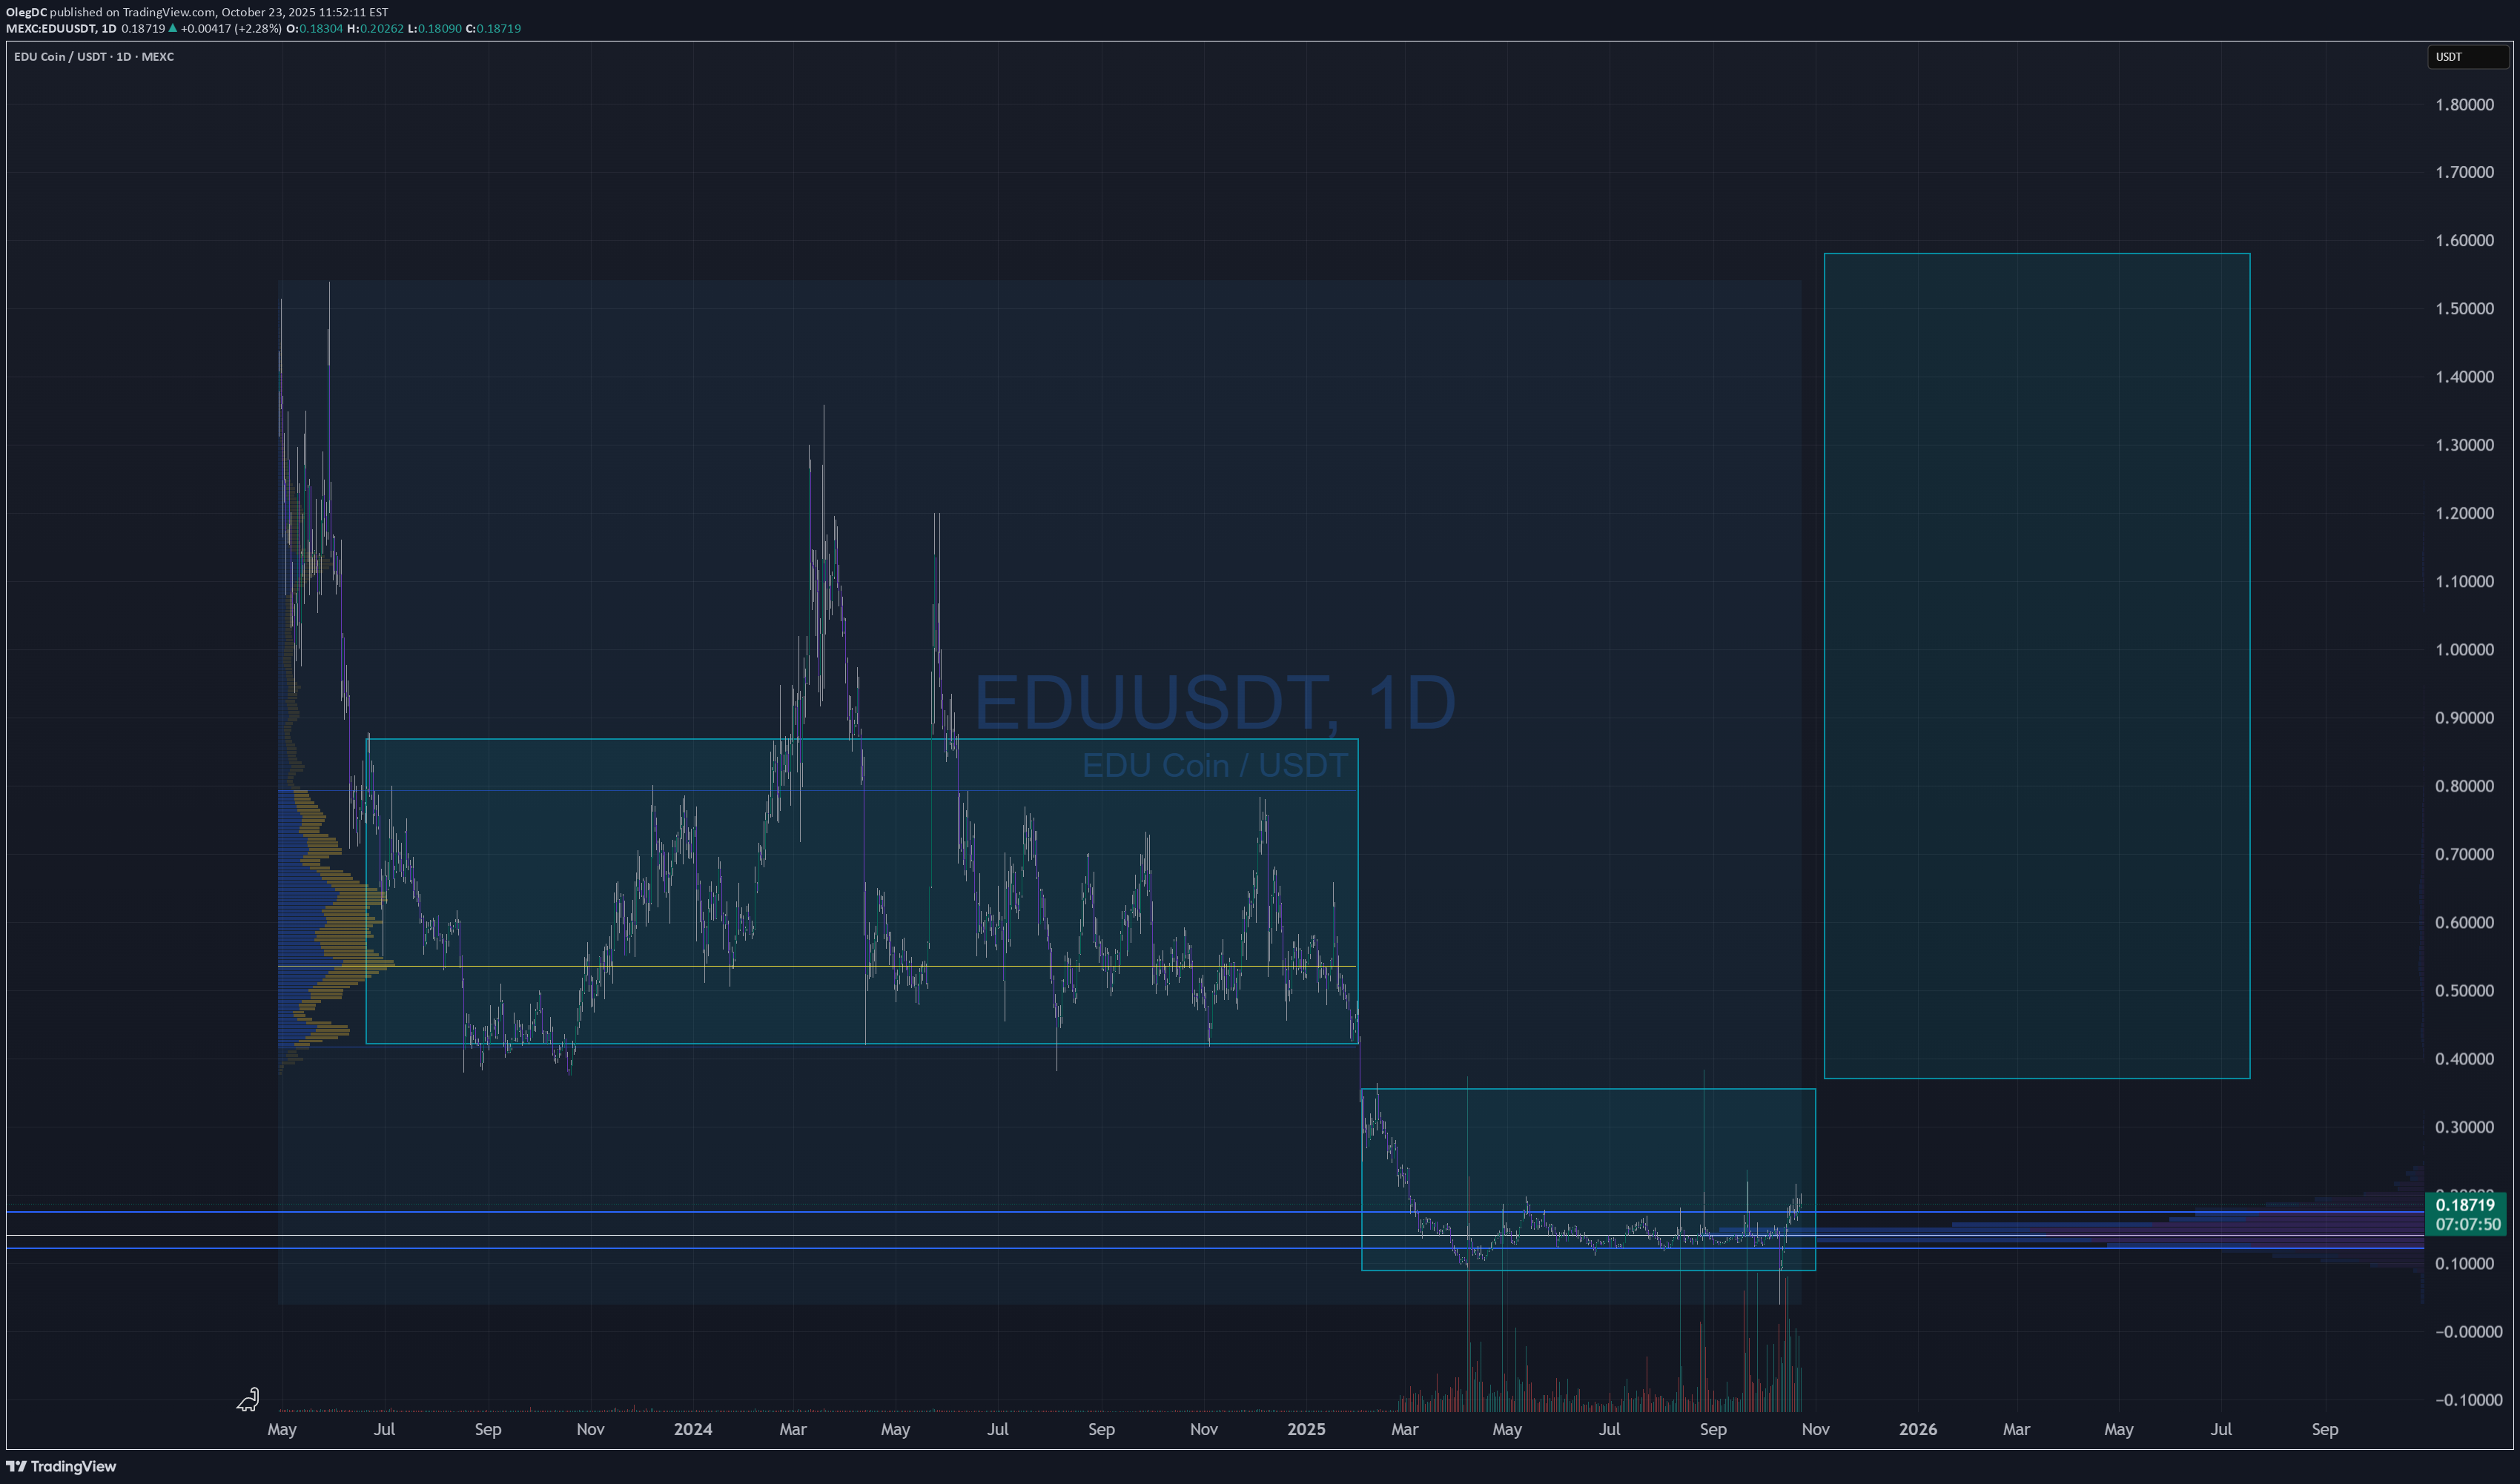
EDUUSD is in accumulation zone, Just crossed VWAP on daily and showing solid buy volume. Power of 3 is the scenario I see. Targets are PoC of upper range and TP2 is ATH
OlegDC
اصلاح قیمت بیت کوین: آیا سقوط بزرگ در راه است؟ (تحلیل وایكاف و فیبوناچی)
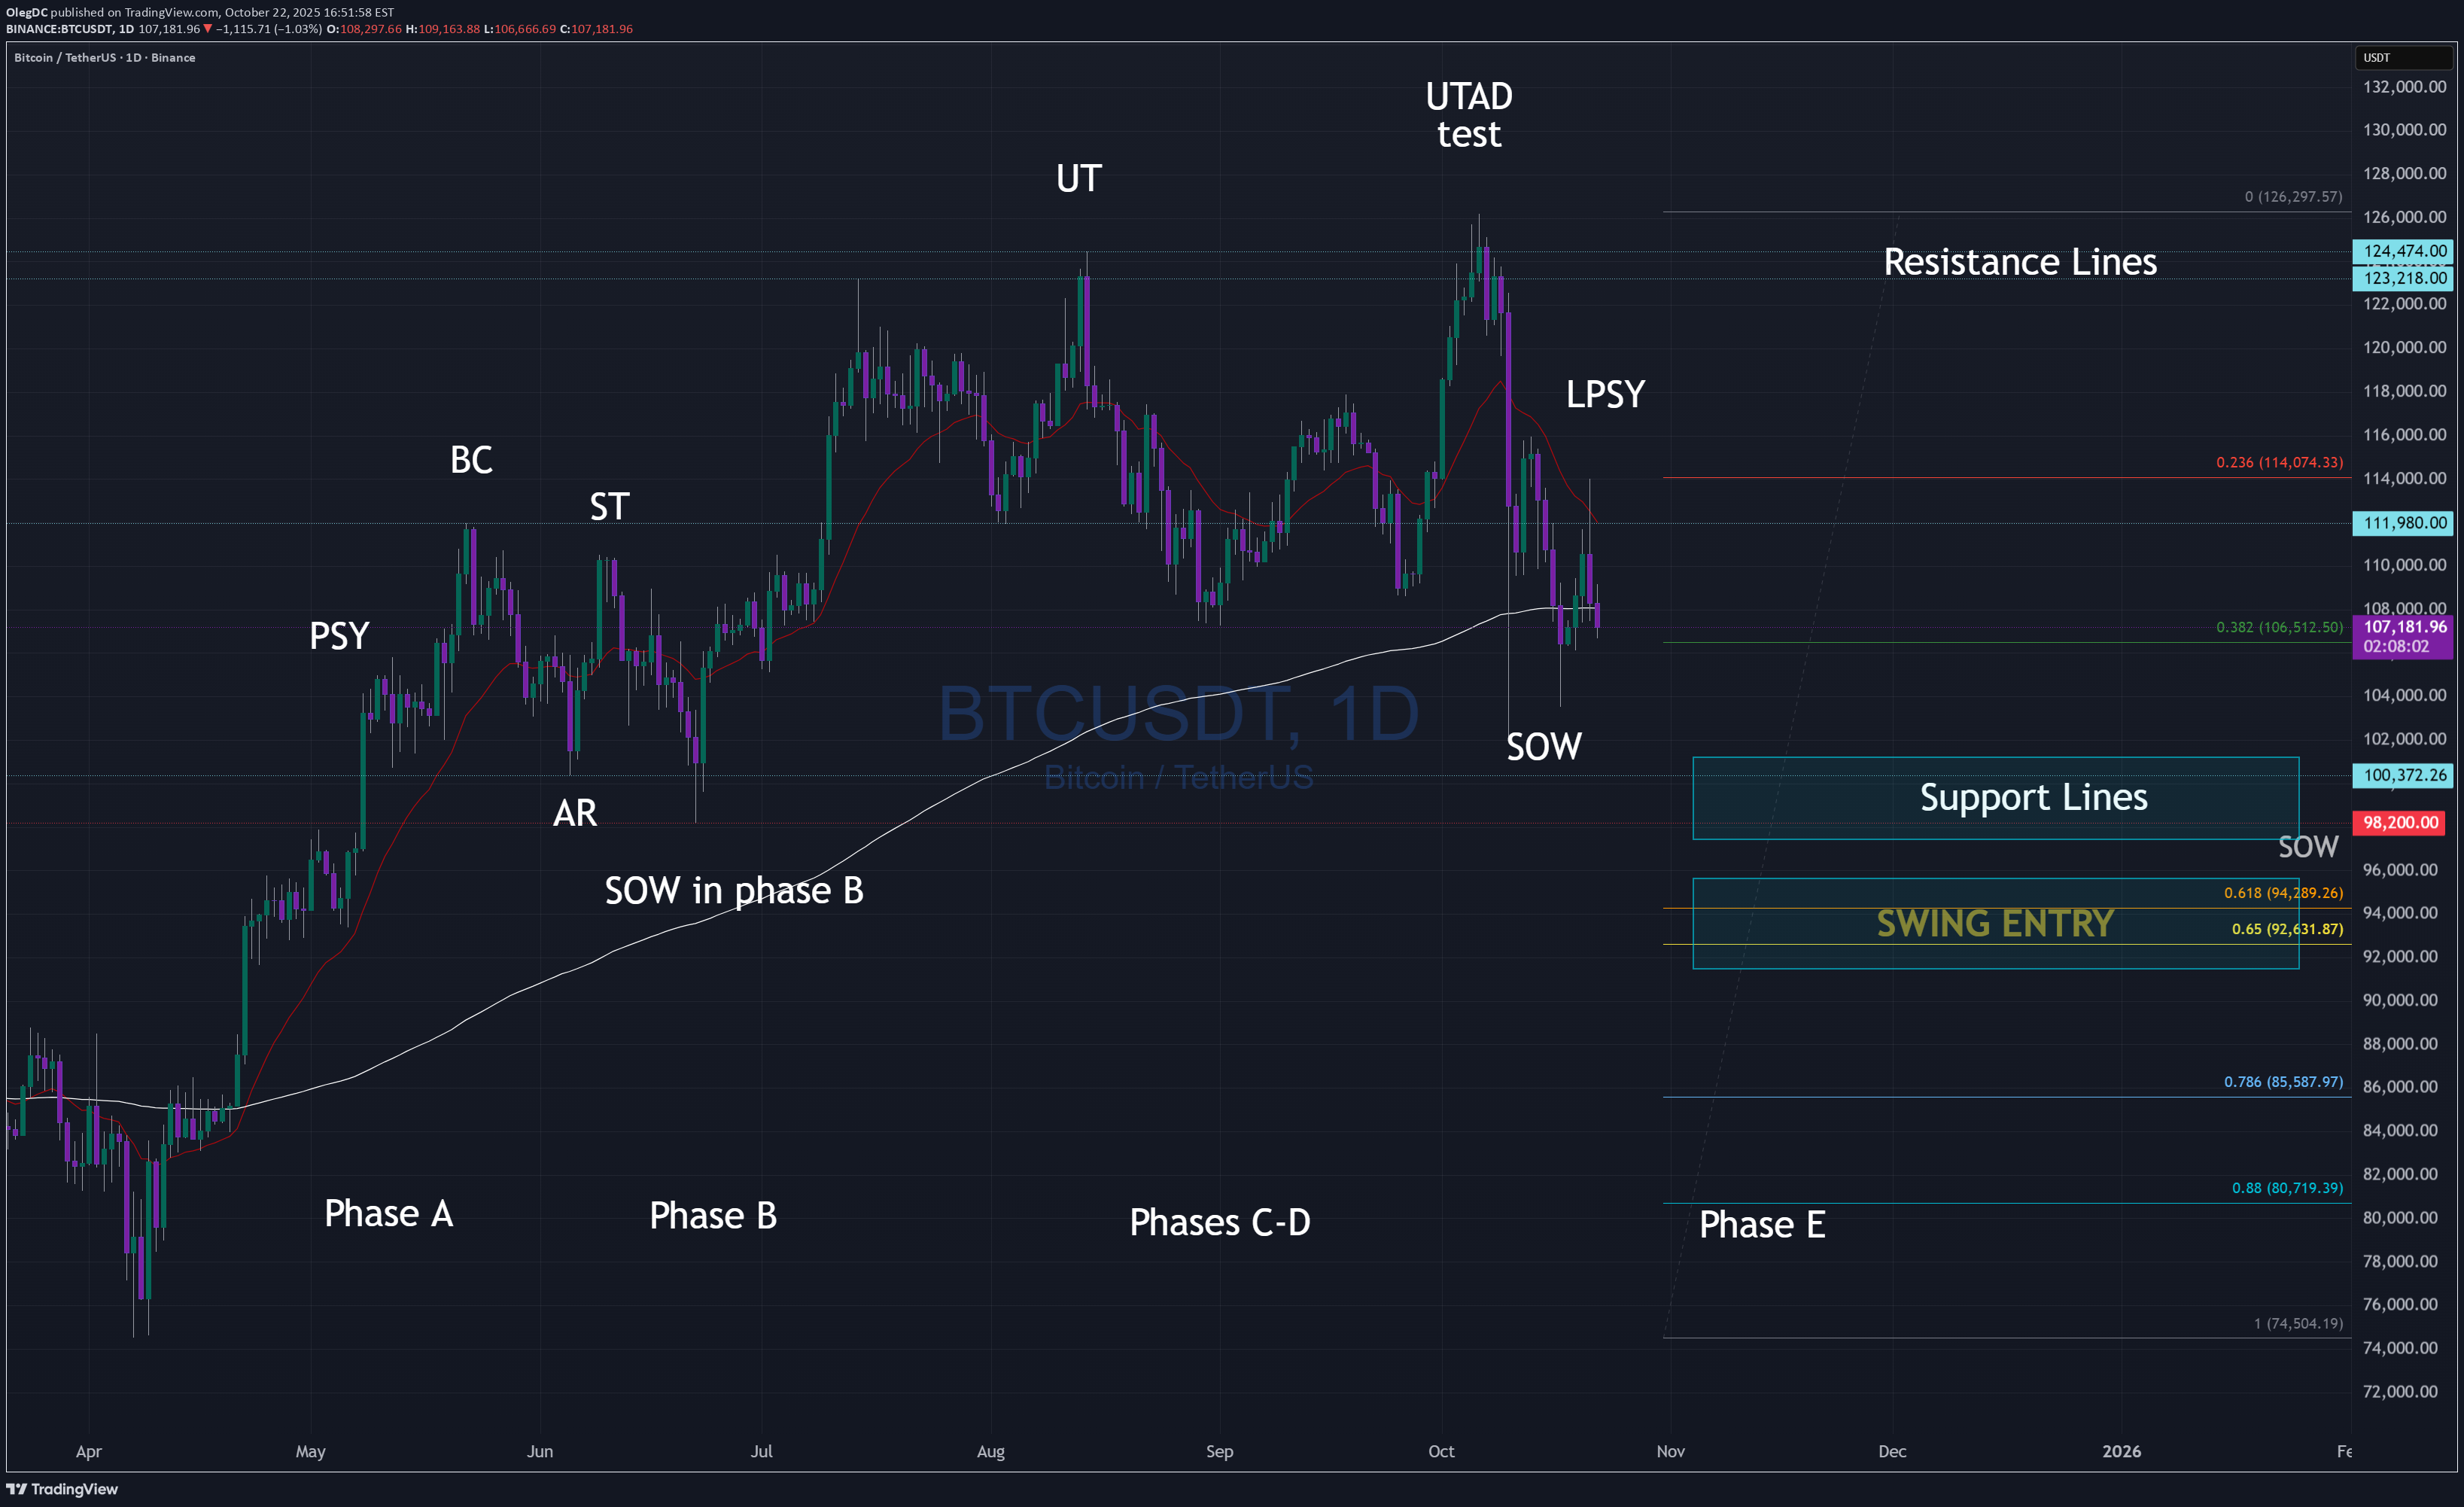
Replicated the model of Wyckoff distribution. The only thing is that he never used Fibbonacci in hes practice. While applying Fibbs will give us Swing entry at two resistance levels $98-100K and deeper at $92-94K, and the total 0.786 retrace would erase whole pump since April, that would be $84K. COnsidering that 2/3 of the trading volume is the US markets and US is currently in a bad shape, considering political situation, gov close and raw metals pump, BTC as a risk asset is still not a favorable investment. loosing 24K in short period of time or 20% value is showing that it can easy lose such value.
OlegDC

OlegDC
MYX long to $32

Call me crazy, I just do little TA. What do I know? Alt season incoming?
OlegDC
BTC, W. MACD view

BTC, W. MACD analyzes. Red line is tapping the time of the bearish cross, yellow line is the bottom and green line - bullish cross. Looking at the signal lines crosses over the time. If we ignore signals right after the bear market, when RSI was low and look only at the high volume move and large price changes, it happened just several times, when signal lines crossed on that time frame. We already have 1 week after the cross, so it is confirmed, bounce didnt happen. What was happening after the bearish cross is that for the next 2-4 months ( 90, 130, 70 days 225 days in bear market) price was dropping. Lets assume, or its a fact, that market has changed, compared to few years ago and current bull market is stronger, then last two times after bearish cross, price was going down for 10 and 19 weekly bars, until signal line of the reverse turned yellow. Based on this data, we have avg. 15 weeks of bear market.Bitcoin had nice 1000 days (exactly) rally for 700% !!! that was plenty of time to make a fortune and I kinda agree with some traders, it looks very bearish now. considering weekly and monthly hidden bearish divergences.
OlegDC
MEMEUSD LONG

Disclaimer
Any content and materials included in Sahmeto's website and official communication channels are a compilation of personal opinions and analyses and are not binding. They do not constitute any recommendation for buying, selling, entering or exiting the stock market and cryptocurrency market. Also, all news and analyses included in the website and channels are merely republished information from official and unofficial domestic and foreign sources, and it is obvious that users of the said content are responsible for following up and ensuring the authenticity and accuracy of the materials. Therefore, while disclaiming responsibility, it is declared that the responsibility for any decision-making, action, and potential profit and loss in the capital market and cryptocurrency market lies with the trader.