
MANA
Decentraland
| تریدر | نوع سیگنال | حد سود/ضرر | زمان انتشار | مشاهده پیام |
|---|---|---|---|---|
No results found. | ||||
Price Chart of Decentraland
سود 3 Months :
سیگنالهای Decentraland
Filter
Sort messages by
Trader Type
Time Frame

MANA Analysis (12H)
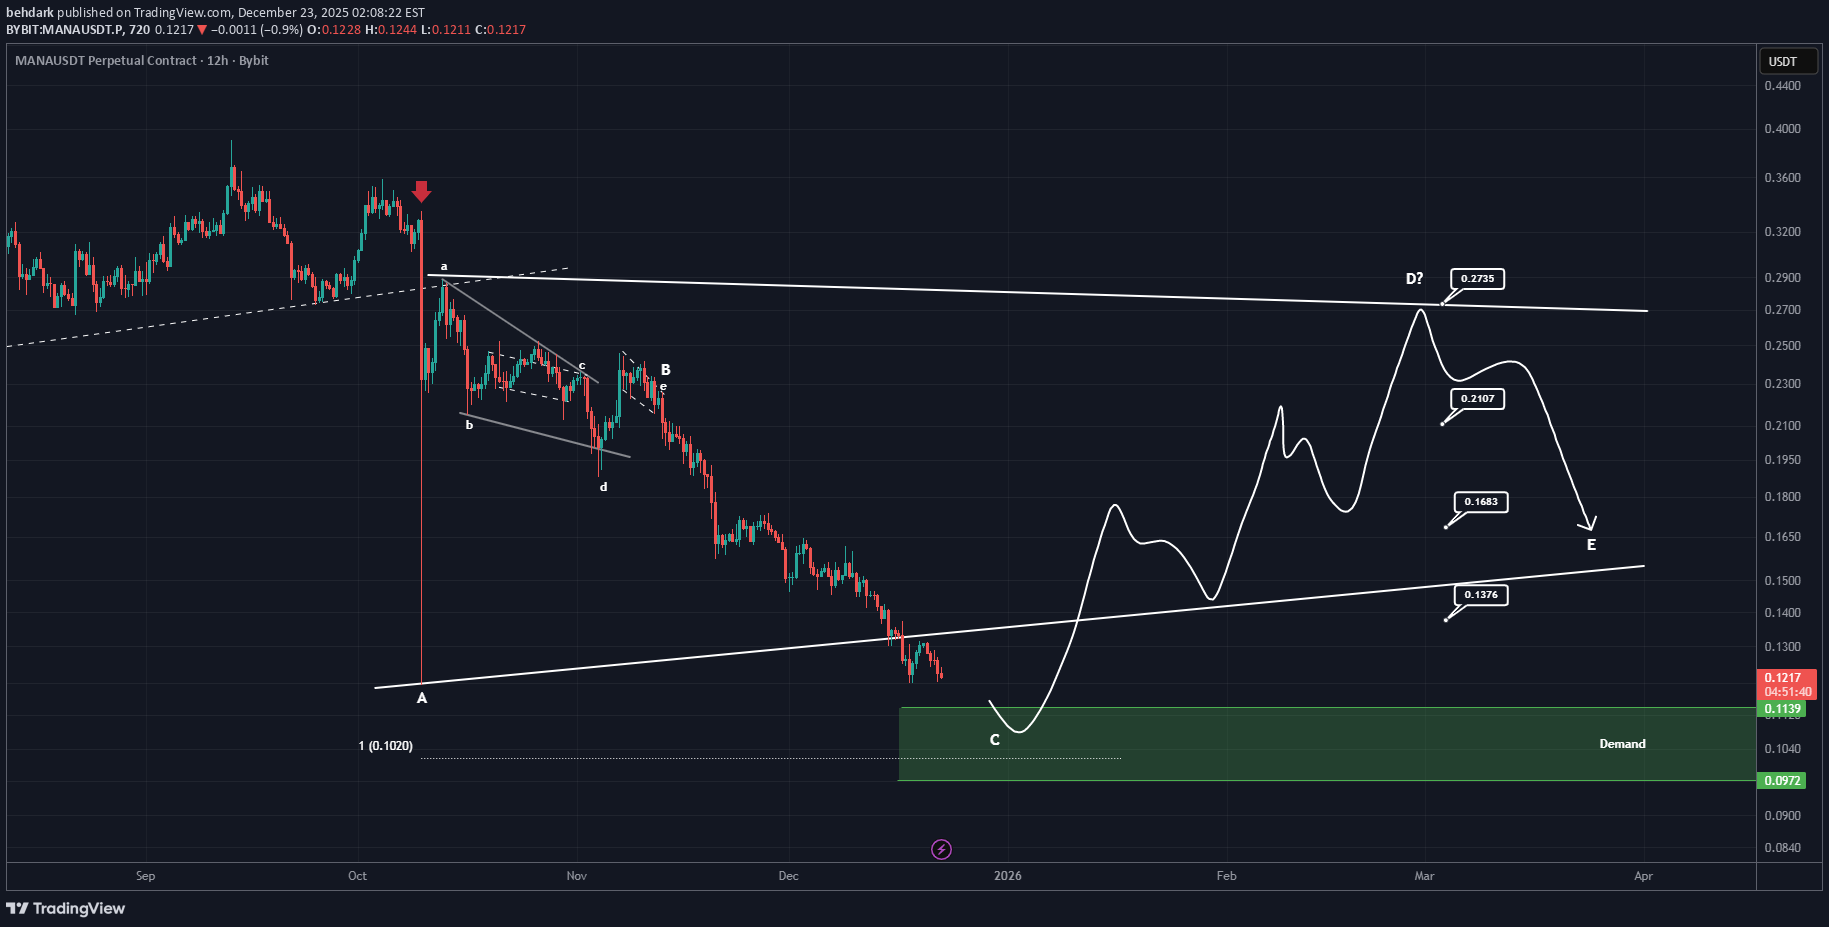
The area marked with the red arrow was where the entire market crashed. Now, in the futures market, this area has been filled with a shadow. The price can potentially rebound from below the shadow, i.e., the green box, and make a strong recovery because the scenario we’re watching is a triangle. Currently, wave C, which is a corrective wave, is coming to an end, and wave D, a bullish wave, will start soon. The market is low-volume and weak, and market makers are easily manipulating it, so plan your entries using DCA. Targets are marked on the chart. For risk management, please don't forget stop loss and capital management When we reach the first target, save some profit and then change the stop to entry Comment if you have any questions Thank You

مانا (MANA) در نقطه حساس: خیزش تاریخی یا سقوط آزاد؟
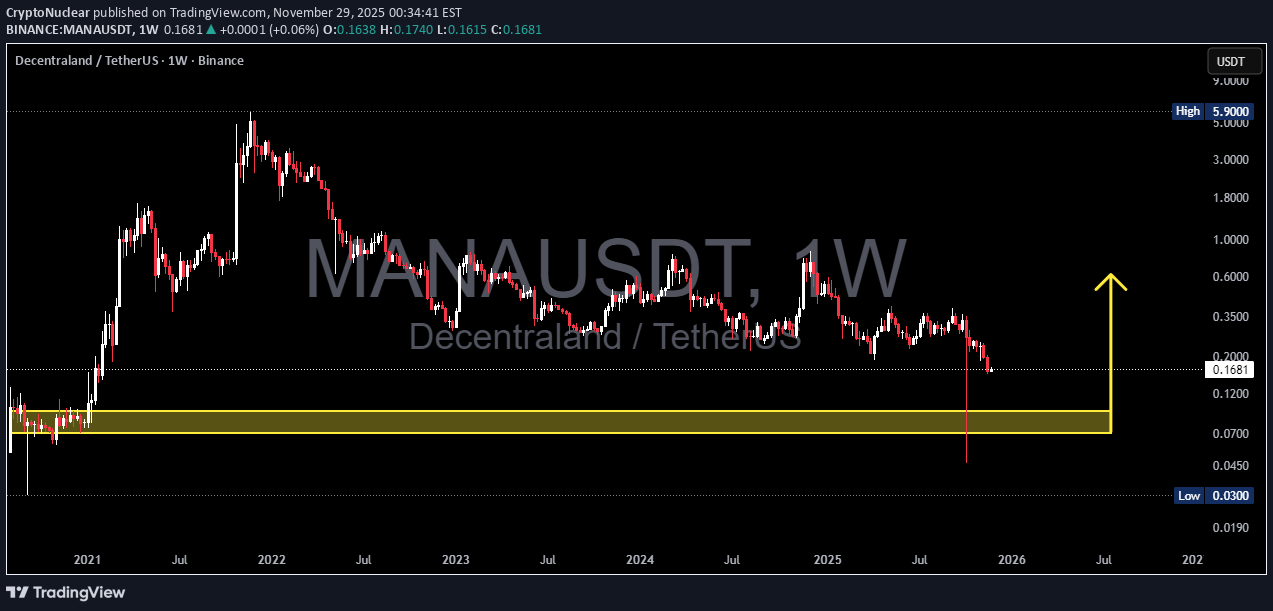
MANA is approaching one of the most important price zones in its entire history. The yellow block at 0.095–0.07 isn’t just a support — it’s the origin demand, the very place where the 2021 macro bull run began. Now, after years of decline, price is returning to this area. The question is simple: Does this zone still hold enough buyers… or will it become the doorway to new lows? --- 🎯 Key Chart Highlights Weekly structure remains bearish, forming consistent lower highs and lower lows since 2022. A massive liquidity sweep (wick into ~0.03) hints at institutional stop-hunting before recovering. Price is now sliding back toward 0.095–0.07, a major historical accumulation base. Below this zone, the next strong support is only around 0.03. In other words: this is a multi-year decision point. --- 📌 Bullish Scenario — “Rebound From the Birthplace of the Last Bull Run” If price taps the 0.095–0.07 zone and: forms a weekly bullish engulfing, prints a higher low, or shows strong buy-side volume… then MANA may enter a new accumulation phase, similar to early 2021. Potential upside targets: 0.20 (local resistance) 0.35 (major supply zone) 0.60–1.00 if the broader crypto market turns bullish This makes the zone a prime area for long-term accumulation. --- 📌 Bearish Scenario — “If the Historical Support Collapses” If weekly closes below 0.07, then: MANA forms a new macro lower low, downtrend continues aggressively, next strong support sits at 0.03. A breakdown here typically triggers: panic selling, cascading stop losses, strong short pressure, accelerated downward momentum. This is the scenario long holders must watch closely. --- 📌 Major Pattern Insight Macro Downtrend since 2022 Liquidity Grab Wick showing smart-money activity Retest of Origin Demand where the last bull cycle started --- 📣 Conclusion MANA is standing at a multi-year crossroads. The 0.095–0.07 zone isn’t just technical—it’s psychological. It represents the thin line between a major reversal and a deeper breakdown. Aggressive traders see it as a potential accumulation zone, while conservative traders will wait for weekly confirmation. Whatever happens next, the next major move will likely begin right here. #MANA #Decentraland #CryptoAnalysis #Altcoins #DemandZone #SupportZone #PriceAction #TechnicalAnalysis #CryptoMarket #AltcoinOutlook

پیشبینی صعودی قوی مانا (MANA): فرصت خرید با اهداف قیمتی جدید!
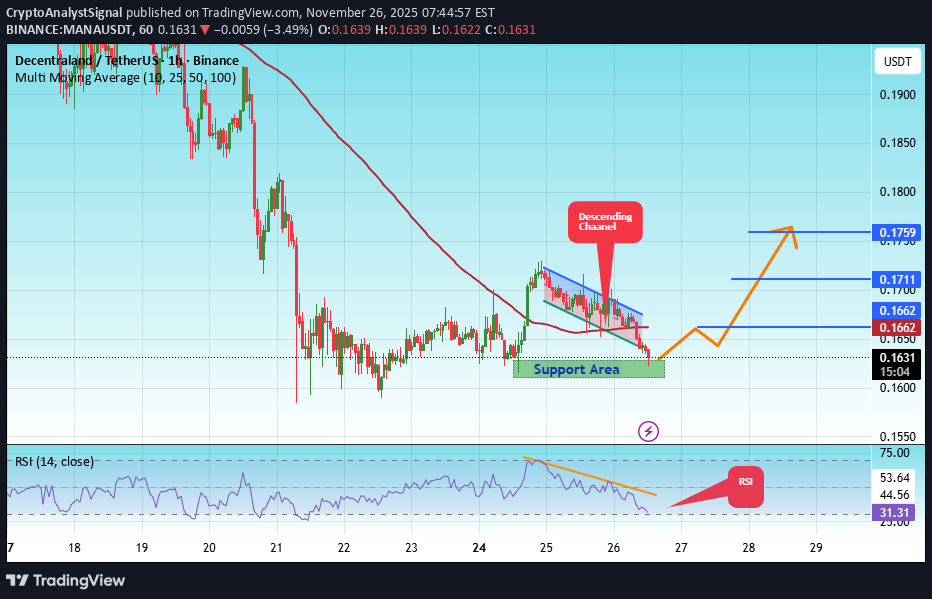
#MANA The price is moving within an ascending channel on the 1-hour timeframe and is adhering to it well. It is poised to break out strongly and retest the channel. We have a downtrend line on the RSI indicator that is about to break and retest, which supports the upward move. There is a key support zone in green at 0.1615, representing a strong support point. We have a trend of consolidation above the 100-period moving average. Entry price: 0.1632 First target: 0.1662 Second target: 0.1711 Third target: 0.1760 Don't forget a simple money management rule: Place your stop-loss order below the green support zone. Once you reach the first target, save some money and then change your stop-loss order to an entry order. For any questions, please leave a comment. Thank you.#MANA First target: 0.1662 Reached Second target: 0.1711 Reached
سیگنال خرید مانا (MANA): آماده جهش بزرگ با اهداف مشخص!
#MANA The price is moving within an ascending channel on the 1-hour timeframe and is adhering to it well. It is poised to break out strongly and retest the channel. We have a downtrend line on the RSI indicator that is about to break and retest, which supports the upward move. There is a key support zone in green at 0.1615, representing a strong support point. We have a trend of consolidation above the 100-period moving average. Entry price: 0.1632 First target: 0.1662 Second target: 0.1711 Third target: 0.1760 Don't forget a simple money management rule: Place your stop-loss order below the green support zone. Once you reach the first target, save some money and then change your stop-loss order to an entry order. For any questions, please leave a comment. Thank you.

پیشنهاد خرید قاطع مانا (MANA): فرصت اسکالپ سود سریع با ریسک کنترلشده!
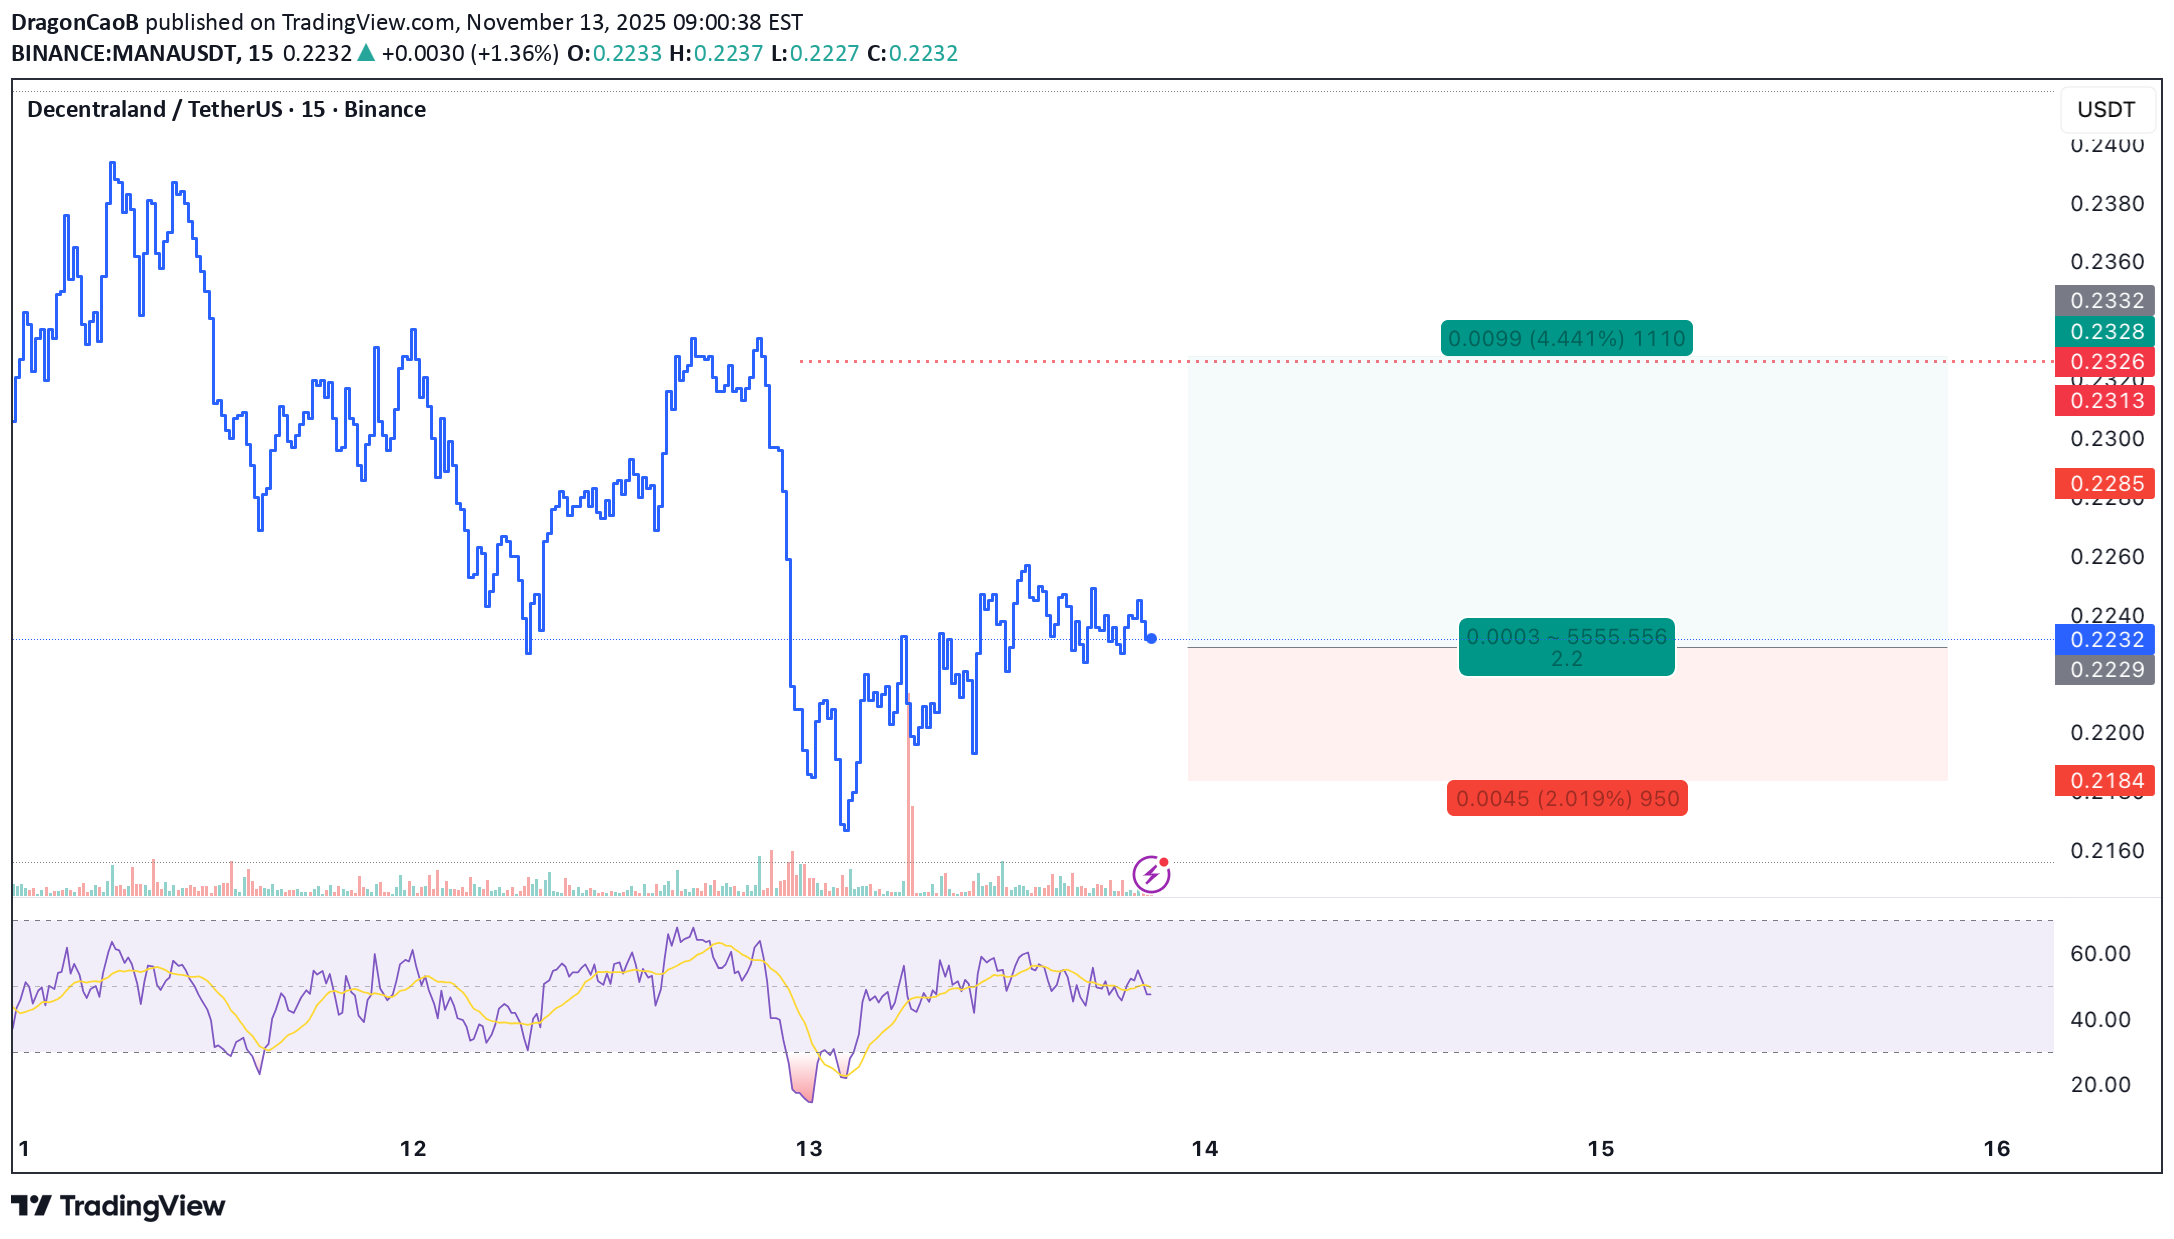
📈 Scalp Long – MANA Price is holding firmly above a strong support zone. Buying pressure has reappeared on the 5m and 15m timeframes, signaling potential upward momentum. A short-term move to retest the local high is likely. 🎯 Trade Setup: Take Profit (TP): 0.2328 Stop Loss (SL): 0.2184 Risk/Reward Ratio (RR): 1 : 2.2 A clean long setup supported by solid demand and renewed bullish momentum — ideal for a precise scalp

تحلیل نمودار MANA/USDT: پایان نزول و آغاز موج صعودی قوی!
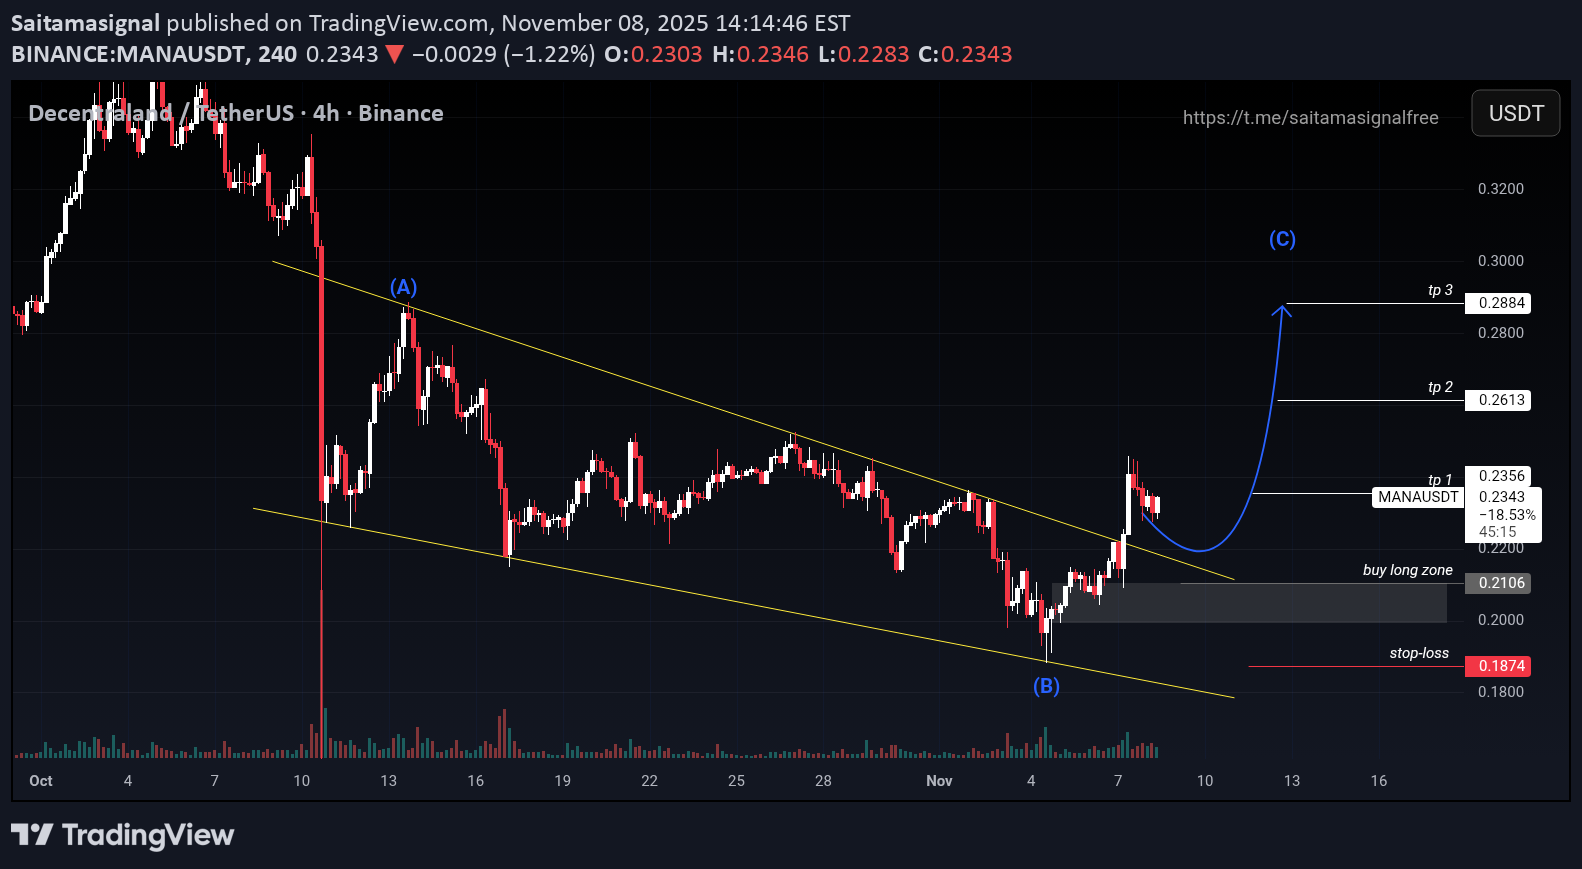
MANA/USDT 4H chart was previously in a descending channel (regular decline). Points (A) and (B) here illustrate a corrective pattern similar to the Elliott Wave ABC structure, where: (A) = corrective peak (B) = corrective bottom (strong support) The next logical target is (C), which is a rebound/relief rally. And indeed, a breakout from the descending channel has been seen, indicating the end of the downward phase and the market has entered the initial phase of an uptrend.

مانا (MANA): انفجار 400 درصدی در راه است؟ راز 1300 روز انباشت!
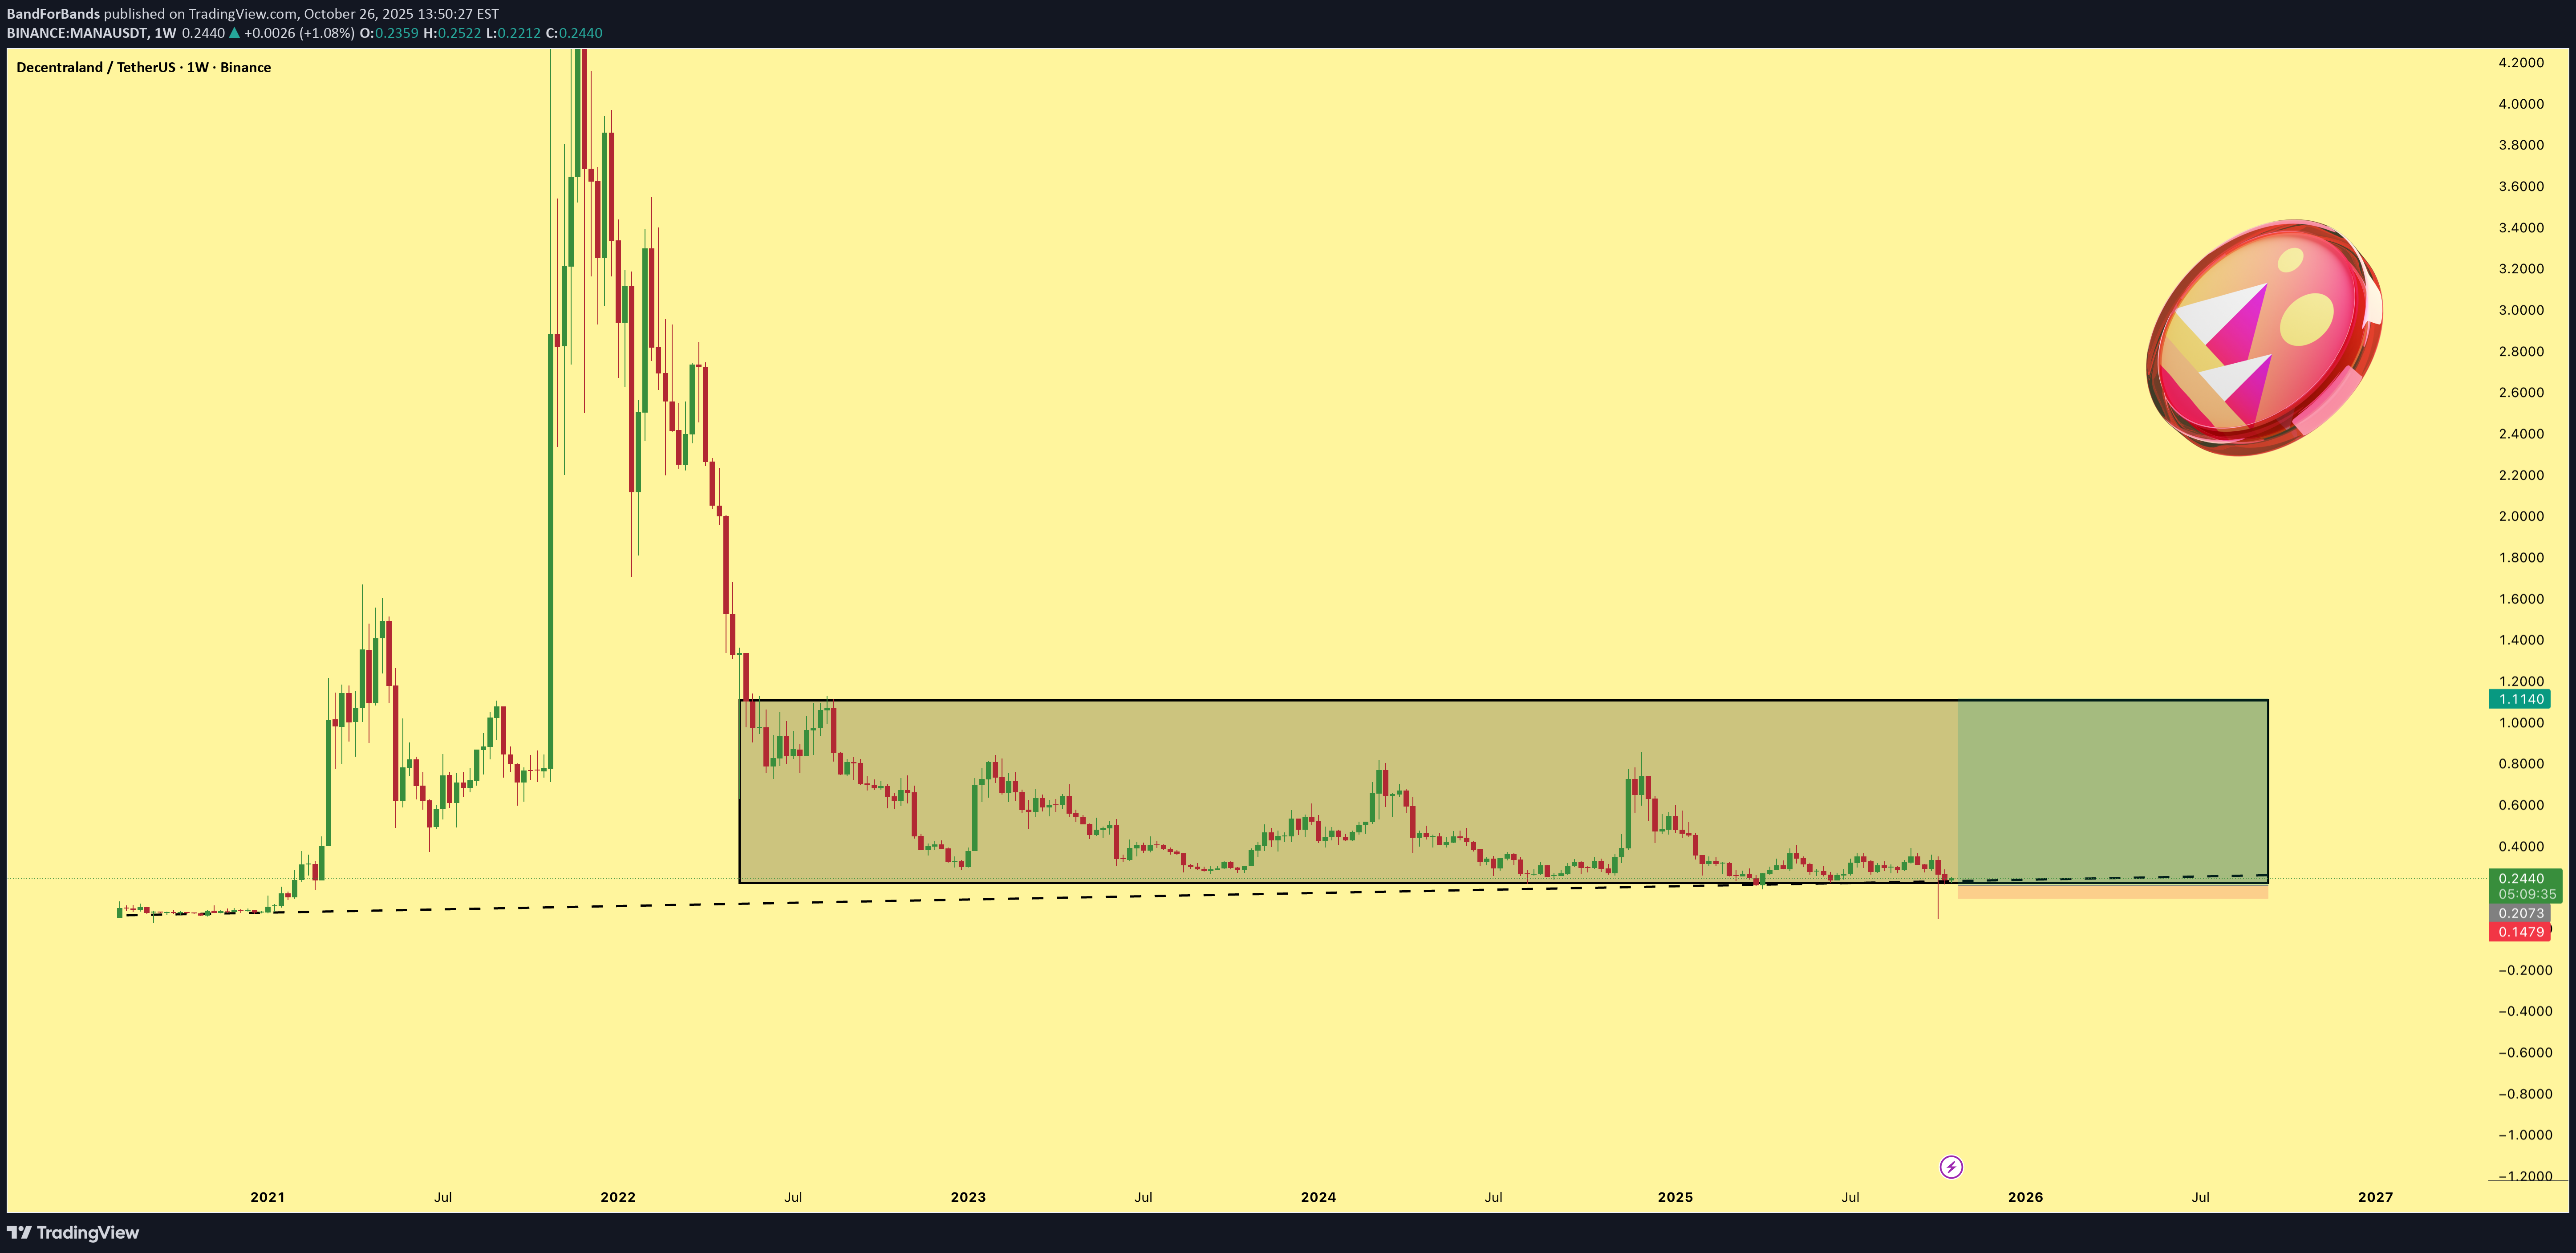
MANA has been consolidating in a massive 1300-day accumulation pattern, with support holding perfectly throughout. This long-term stability signals a strong likelihood of another resistance test ahead, offering over 400% potential upside from current levels once momentum picks up.

آینده ارزهای دیجیتال: فاجعه یا فرصت بزرگ برای پول هوشمند؟
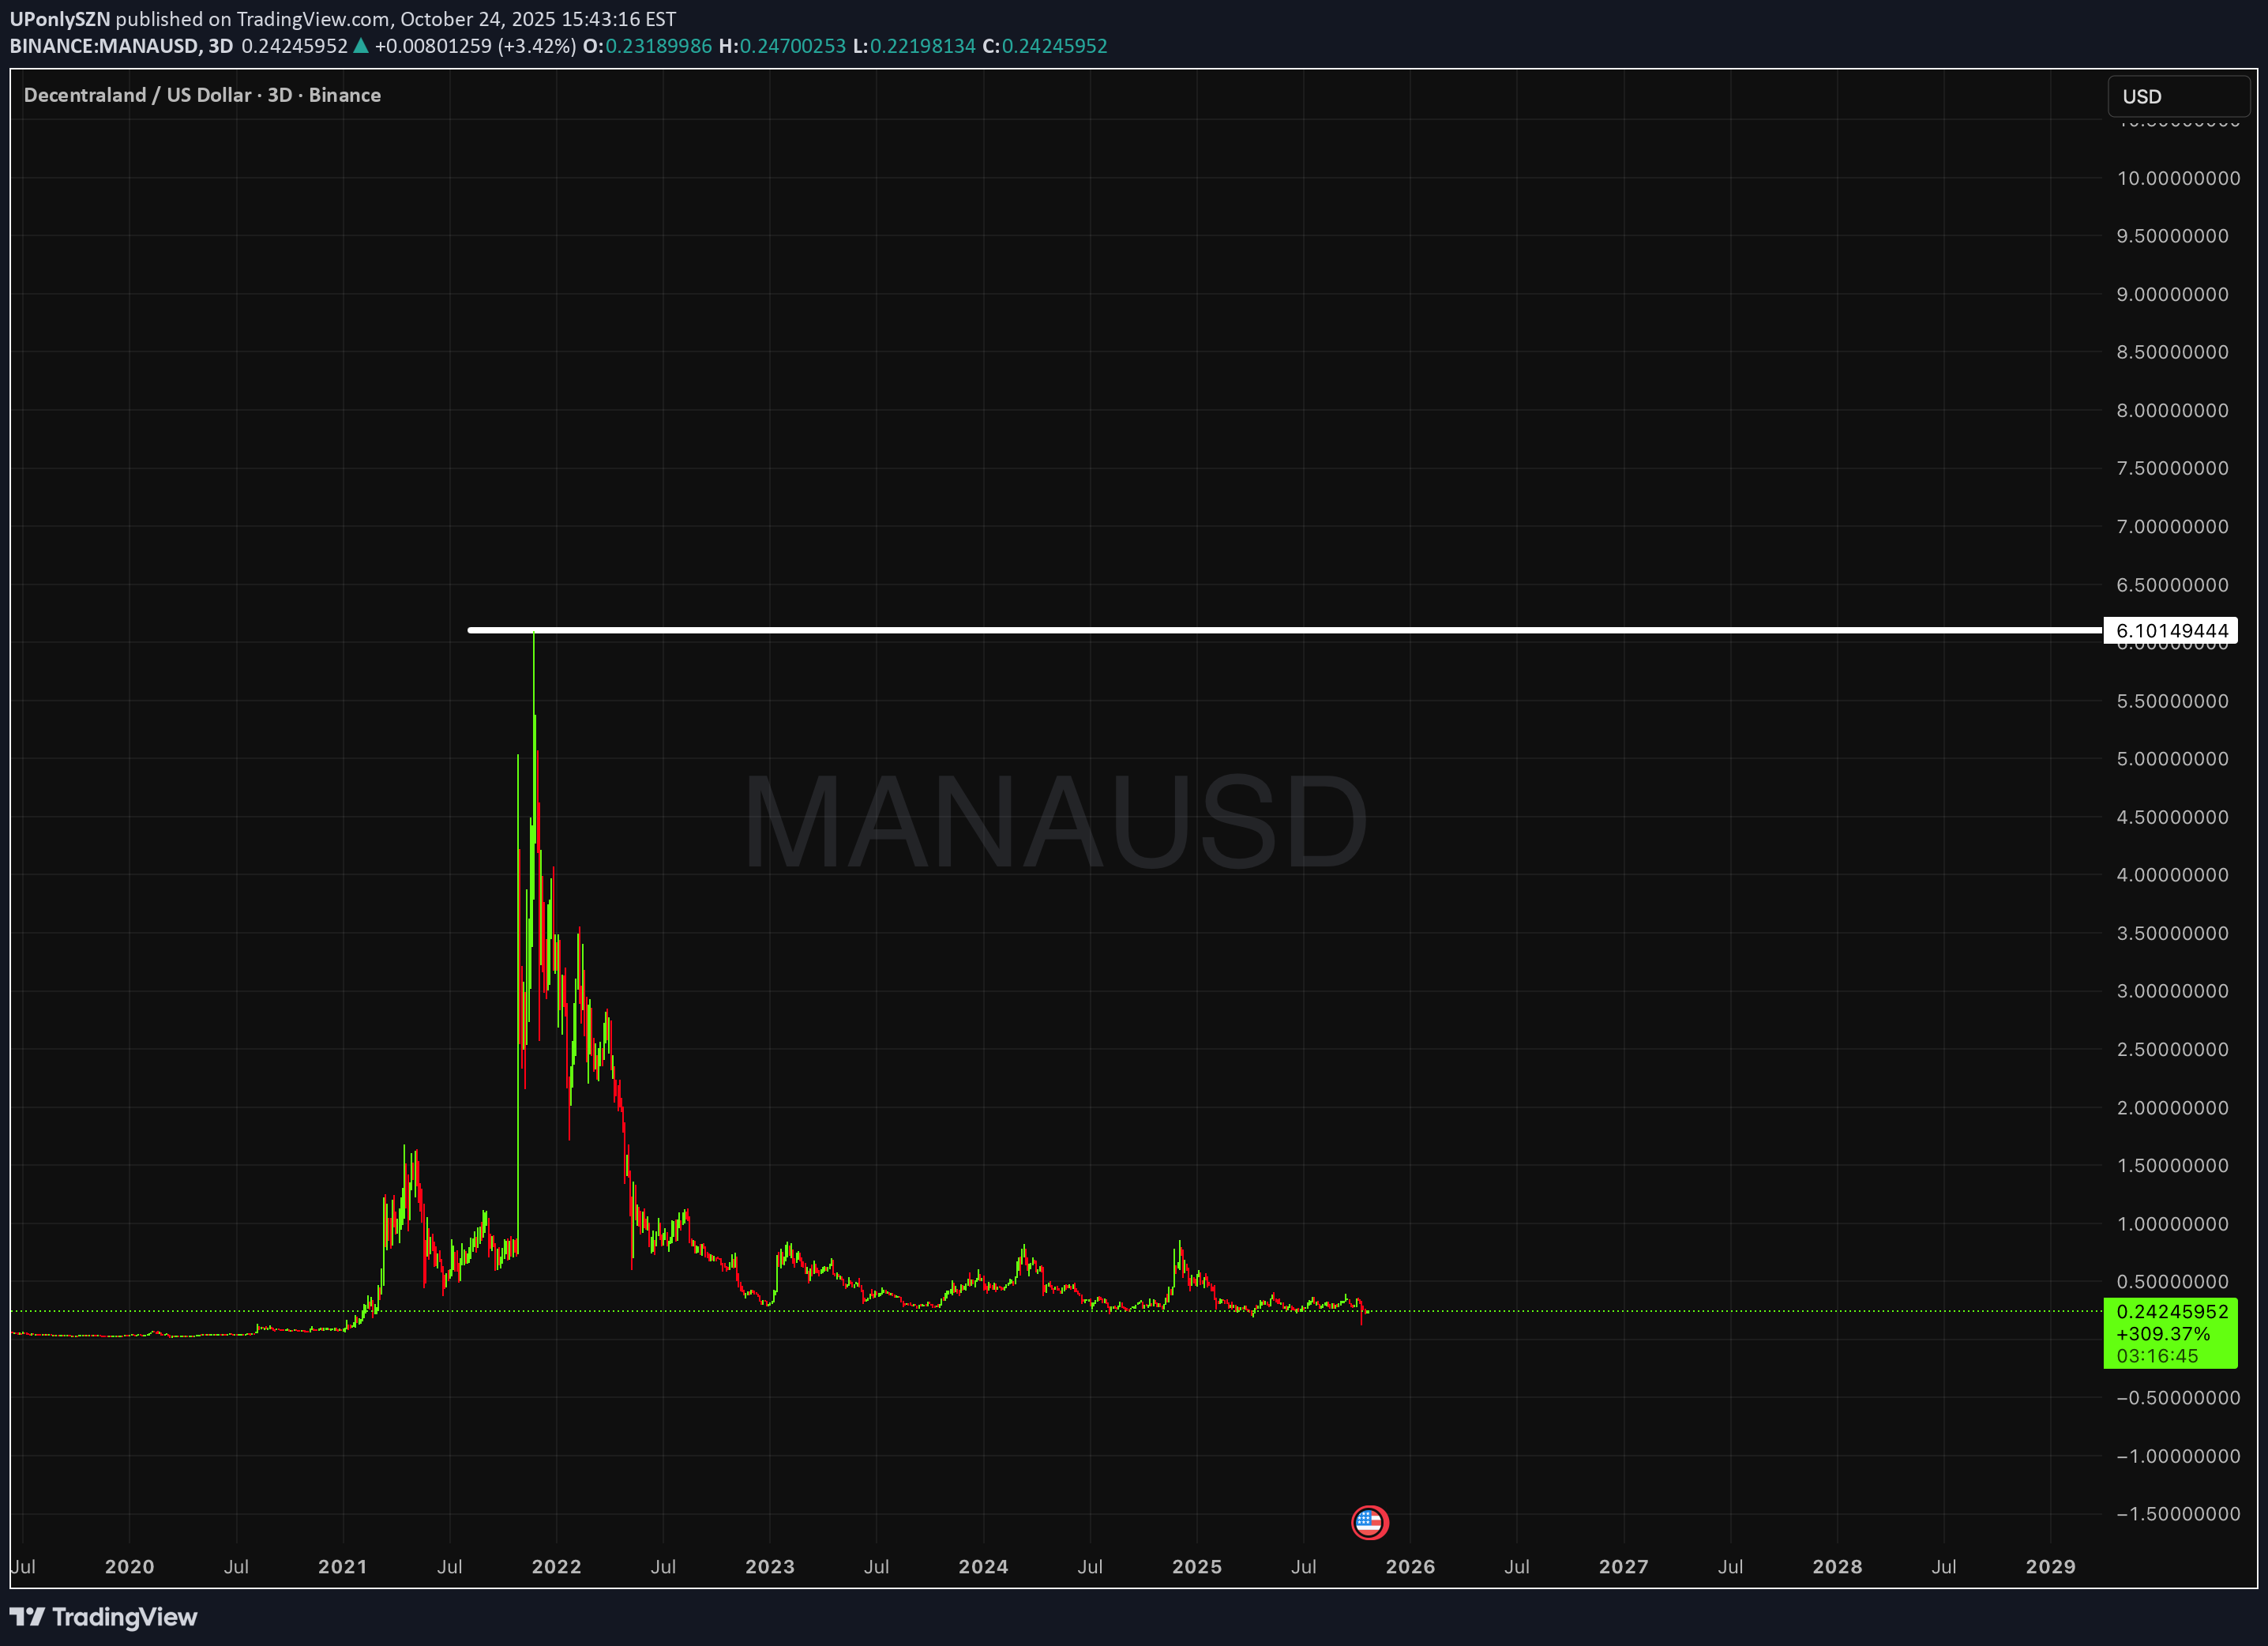
Are you ready to live on the metaverse or are you going to HFSP. anyway this is the bottom (maybe) (real). the 4 year defi bear market has destroyed the weak hands and now the smart money will come in and take your little coins . NFA
تحلیل گام به گام: سیگنال خرید قدرتمند (MANA) با پتانسیل سود 2.6 برابری!
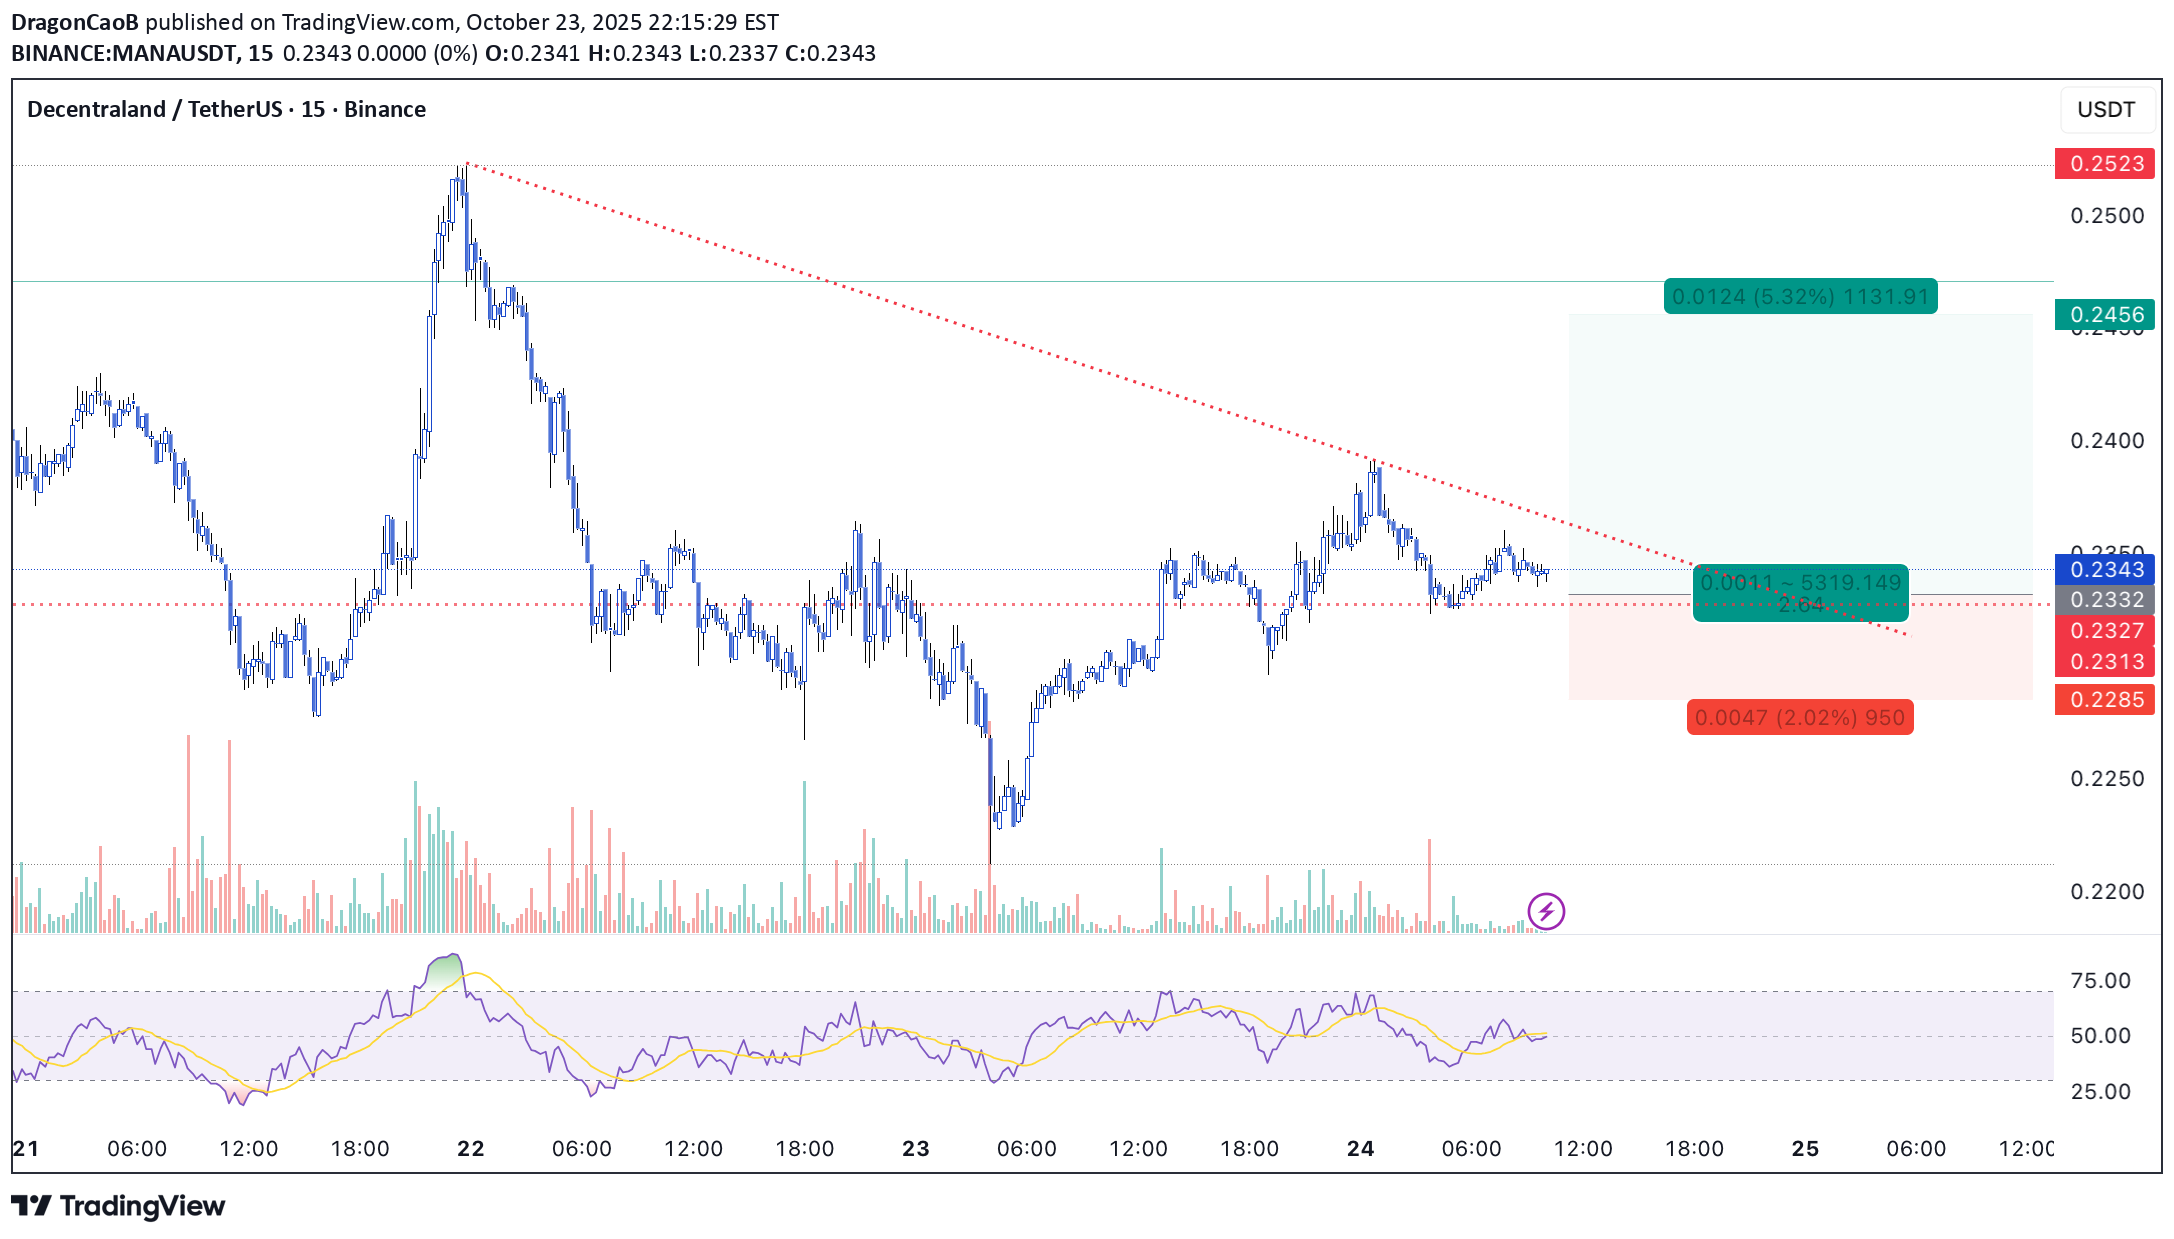
🎯 Trade Setup – LONG Reason: RSI is in the buy-zone (momentum shifting). Trendline of short-term downtrend is preparing to break. Price is being supported at a buying zone. Entry scenario: After confirmed break of the short-term down-trendline + support hold. TP (Take Profit): 0.2458 SL (Stop Loss): 0.2286 Risk/Reward: ~ 1 : 2.6 📌 Key technical confirmation Use the Relative Strength Index (RSI) to validate momentum shift; RSI should back the bullish thesis. Mind Math Money +1 Confirm trendline has been broken or about to break, because a broken downtrendline often signals reversal. goodcryptoX +1 Ensure price is anchored by a support zone – this gives the stop-loss validity and the risk structure clear. ✅ Conclusion This is a clean long-setup: momentum + structural breakout + support in place. With R:R of ~1 : 2.6, the trade has attractive reward potential relative to risk. But discipline matters—only execute after your breakout confirmation, stick to SL, and don’t over-size. Let me know if you’d like the same format for another coin or a different timeframe.

تحلیل طلایی: سیگنال فروش قوی با الگوی سر و شانه در ماناوسدتی (MANAUSDT)

0.2988 Target I am thinking of Short Processing Shoulder head shoulder formation I don't conflict with the possible trend of Bitcoin.
Disclaimer
Any content and materials included in Sahmeto's website and official communication channels are a compilation of personal opinions and analyses and are not binding. They do not constitute any recommendation for buying, selling, entering or exiting the stock market and cryptocurrency market. Also, all news and analyses included in the website and channels are merely republished information from official and unofficial domestic and foreign sources, and it is obvious that users of the said content are responsible for following up and ensuring the authenticity and accuracy of the materials. Therefore, while disclaiming responsibility, it is declared that the responsibility for any decision-making, action, and potential profit and loss in the capital market and cryptocurrency market lies with the trader.