
KAS
Kaspa
| تریدر | نوع سیگنال | حد سود/ضرر | زمان انتشار | مشاهده پیام |
|---|---|---|---|---|
 GoonBoyCryptoRank: 16065 | خرید | حد سود: تعیین نشده حد ضرر: تعیین نشده | 12/4/2025 | |
 SwallowAcademyRank: 30699 | خرید | حد سود: تعیین نشده حد ضرر: تعیین نشده | 12/9/2025 | |
 coinpediamarketsRank: 30719 | خرید | حد سود: تعیین نشده حد ضرر: تعیین نشده | 12/2/2025 | |
خرید | حد سود: تعیین نشده حد ضرر: تعیین نشده | 12/7/2025 |

Price Chart of Kaspa
سود 3 Months :
سیگنالهای Kaspa
Filter
Sort messages by
Trader Type
Time Frame
SwallowAcademy
Kaspa (KAS): If Buyers Don't Secure This Zone We Are Doomed
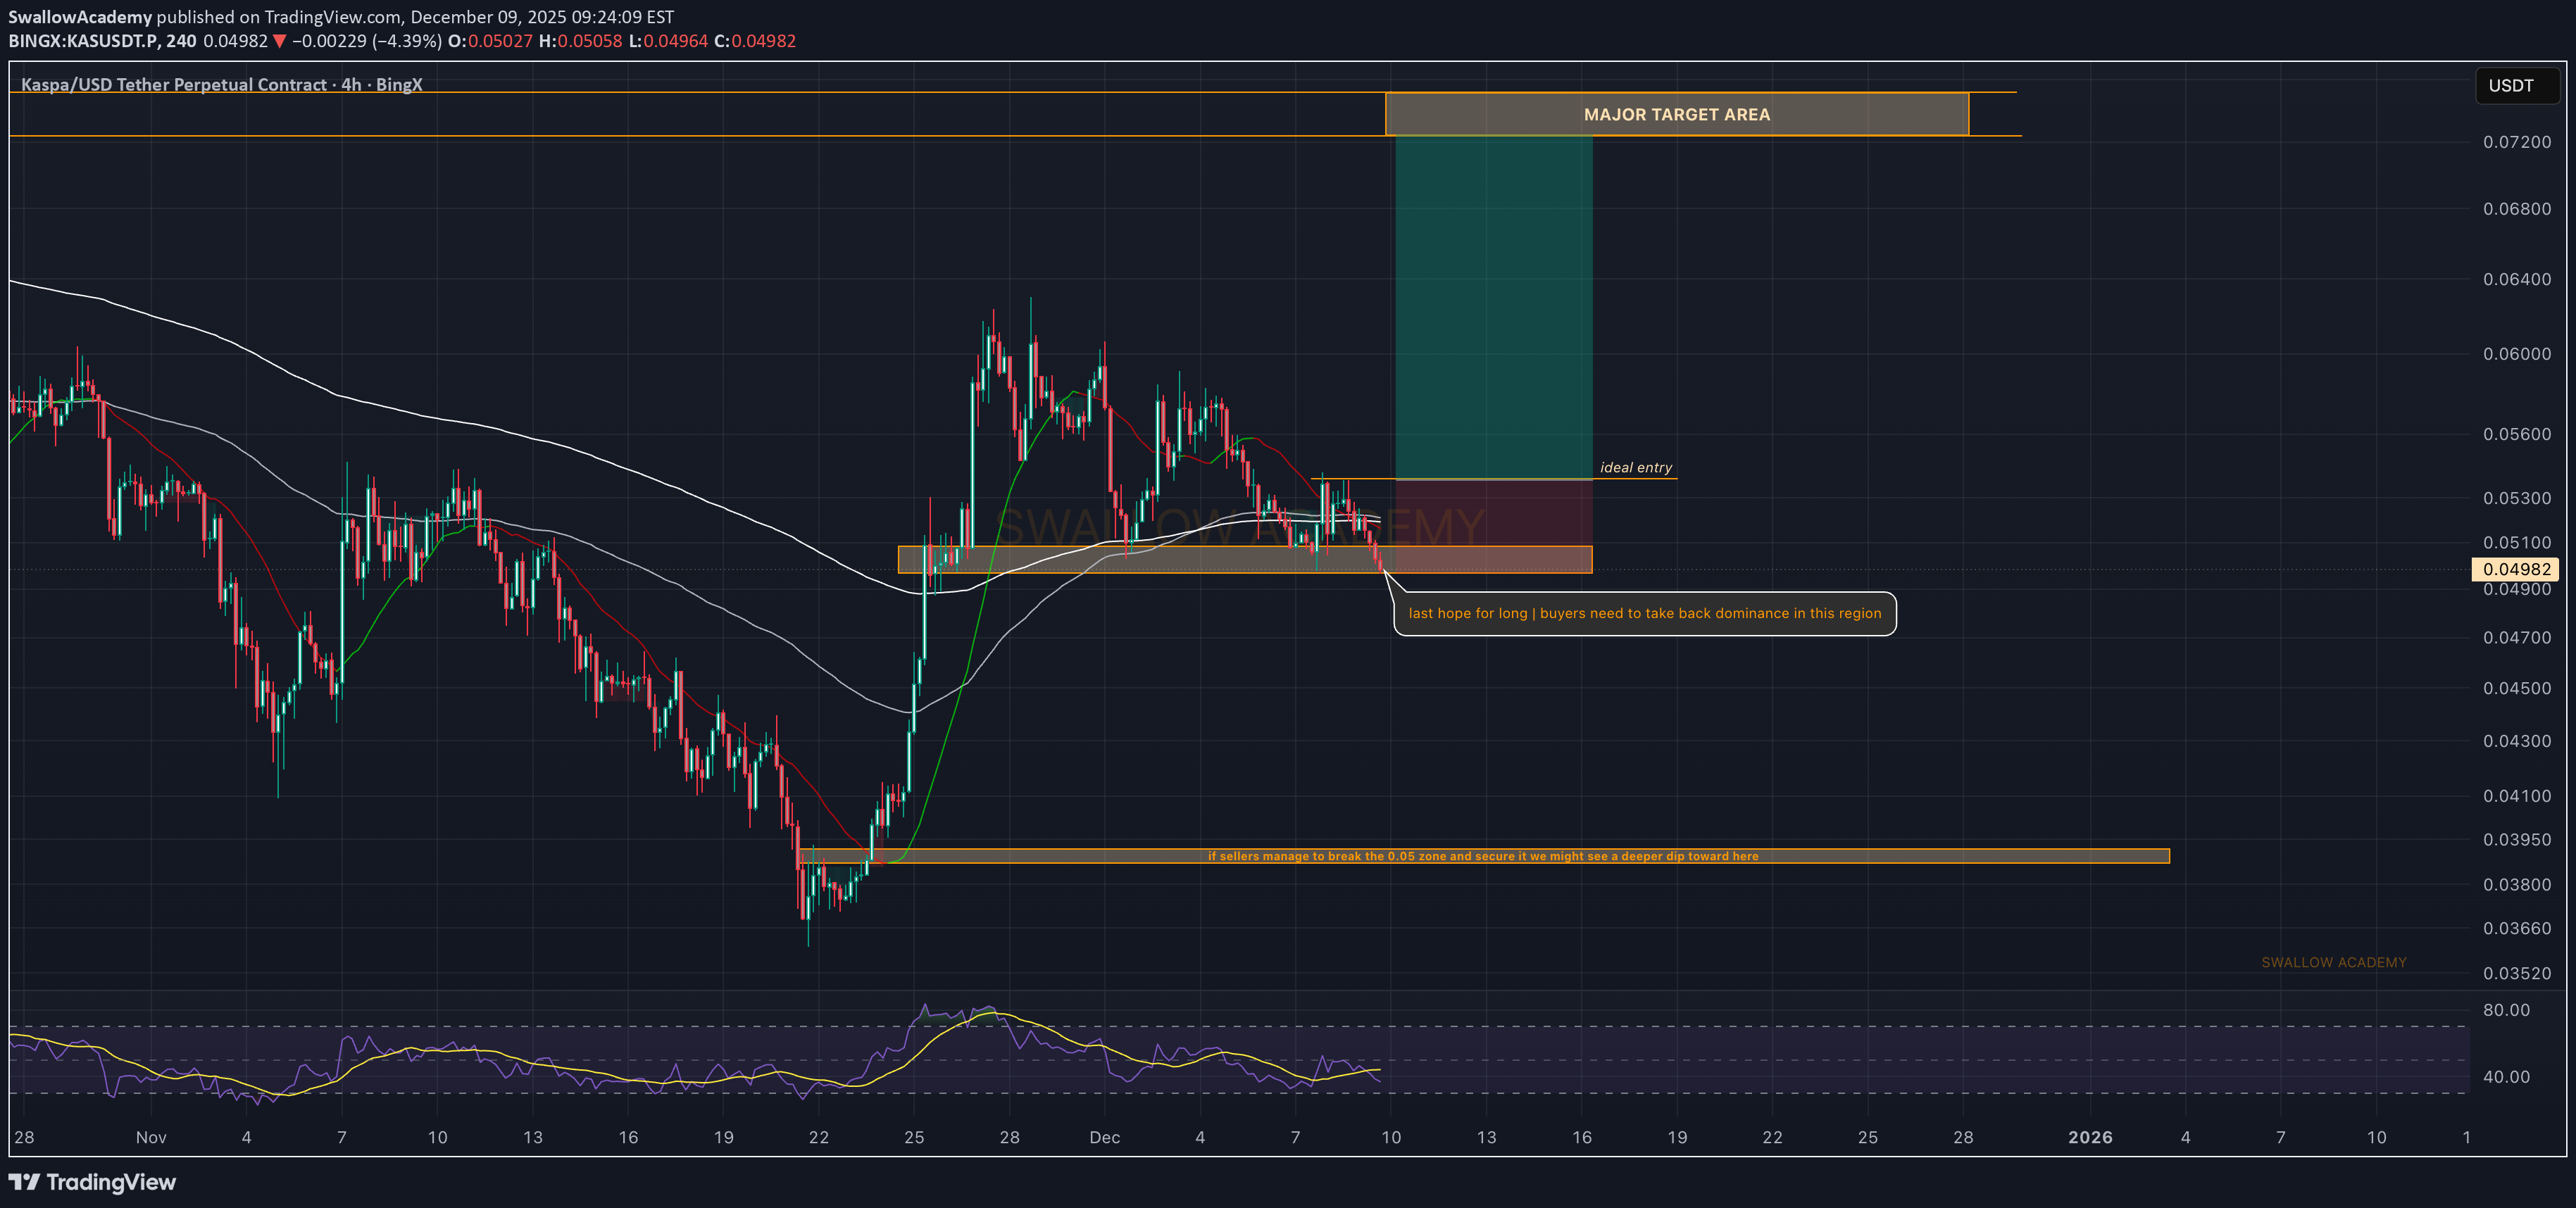
KAS pulled back into the last support zone we marked, and this is the spot where buyers need to take back dominance. The reaction isn’t strong yet, but the zone is holding, so the long idea still makes sense as long as price stays above it. For continuation, we need to see buyers reclaim that small resistance above the “ideal entry” zone. That becomes the trigger that confirms the build-up and opens the move toward the major target area. Until that reclaim, we’re just watching how price behaves in this support and whether buyers manage to step back in. Swallow Academy
کاسپا (KAS) منفجر میشود: سیگنال خرید قوی و مسیر هموار تا ۰.۰۸ دلار!
GoonBoyCrypto
تحلیل تکنیکال کاسپا (KAS): آیا موج صعودی بزرگ پس از کفسازی آغاز میشود؟
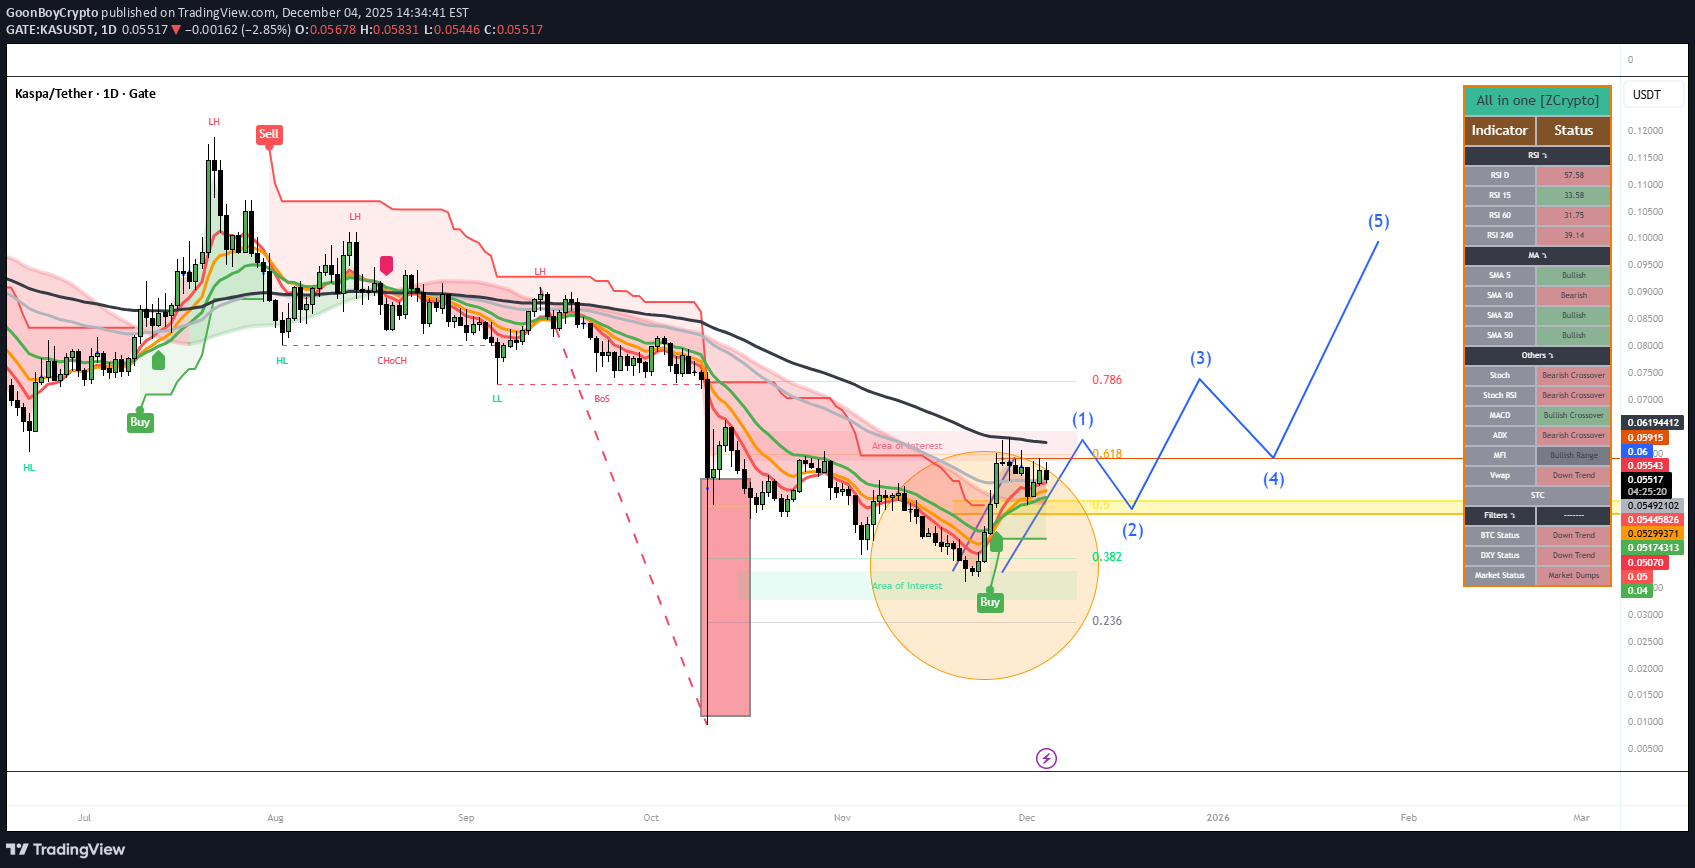
Chart Analysis This is a daily (1D) candlestick chart for KAS/USDT on the Gate.io exchange, created by "GoonBoyCrypto" as of December 4, 2025. It covers historical price action from July 2025 onward, with projections extending into early 2026 (up to March). The price scale ranges roughly from 0.0500 to 0.1500 USDT, indicating Kaspa's value has been trading in a low range during this period. The chart incorporates elements of Smart Money Concepts (SMC), Fibonacci levels, and an Elliott Wave count, along with buy/sell signals and areas of interest. Here's a breakdown: Key Price Action and Patterns Uptrend Phase (July–August 2025): The chart starts with a bullish move, marked by a green "Buy" signal near a low of ~0.08 USDT. Price rallies to a high of approximately ~0.14 USDT, forming a green-shaded bullish area. This is followed by a pullback to a "HL" (Higher Low), suggesting temporary support. Downtrend Phase (August–December 2025): After peaking, a red "Sell" signal appears at the top, labelled "LH" (likely Lower High). The trend shifts bearish with a "ChCh" (Change of Character) and "BoS" (Break of Structure), indicating a reversal from bullish to bearish structure. Price declines steadily, with pink-shaded bearish areas and a sharp red downward arrow highlighting a major drop (possibly in November), bottoming out near ~0.04 USDT. A large red candle emphasises this capitulation. Potential Reversal (December 2025 Onward): At the low, there's another green "Buy" signal and an orange-circled "Area of Interest" (possibly an order block or fair value gap for accumulation). The price forms a bottoming pattern, like a consolidation triangle or wedge, before breaking out upward. Elliott Wave Projection: The numbered labels (1) through (5) suggest an impulsive bullish wave count starting from the December low:(1): Initial up to ~0.0618 USDT. (2): Retrace down to ~0.0382 USDT. (3): Extension up to ~0.0786 USDT. (4): Pullback to ~0.0236 USDT (this seems aggressive and may indicate a deep correction or a labelling error; it could be a Fib 0.236 retracement level). (5): Projected upward leg, pointing toward higher levels (potentially ~0.10 USDT or beyond, based on the line's trajectory into 2026). These levels (0.236, 0.382, 0.618, 0.786) are classic Fibonacci retracement/extension points, likely drawn from the major high-to-low move, guiding the wave targets. Indicators used feature the "All in One [Crypto]" indicator suite, including RSI, Stochastic (Stoch), MACD, ADX, Veup, and others. Signals are mixed: Bearish Signals: Stoch RSI (Bearish Crossover), MACD (Bearish Crossover), ADX (Bearish Range), Veup STC (Down Trend), DX (Down Trend, Market Dump). Bullish Signals: SMA 10 (Bullish), SMA 20 (Bullish), SMA 30 (Bullish Others), some RSI variants (e.g., RSI 40 at 36.83, potentially oversold). Neutral/Other: RSI 14 at 50.3 (neutral), overall suggesting waning bearish momentum but not yet fully bullish. This aligns with a potential reversal if support holds. The chart creates an optimistic approach, projecting a bullish breakout from the current low, with the wave (5) extending into February–March 2026. However, the mixed indicators highlight risks if the downtrend resumes. My Prediction Based on the chart's technical setup, Kaspa appears to be at a critical inflexion point after a prolonged downtrend, with signs of exhaustion and a potential bullish reversal. The Elliott Wave count and buy signal at the "Area of Interest" suggest accumulation around 0.04–0.05 USDT, setting up for an impulse higher. If price holds above the recent low (0.0236–0.0382 USDT) and breaks above wave (3) resistance (~0.0786 USDT), it could confirm the uptrend. Short-Term (Next 1–3 Months, into Q1 2026): Bullish, targeting ~0.06–0.10 USDT (Fib extensions and wave (5) projection). This matches recent sentiment for near-term gains. Medium-Term (2026): If the reversal holds, potential for 0.20–0.50 USDT, driven by tech upgrades (e.g., ZK, DagKnight, vProgs) and listings. This aligns with broader predictions of 0.50–0.80 USDT. Long-Term (2027–2028): Highly bullish if adoption grows (e.g., dApps, RWA integration, high TPS/hashrate). Targets could reach 1–5 USDT or higher, based on power-law growth models and comparisons to other L1s like SOL, BNB & ETH. Risks include a breakdown below ~0.04 USDT, which could lead to further downside (e.g., 0.02 USDT), especially if Bitcoin weakens or network metrics (e.g., hashrate at 630 PH/s) falter. Crypto is volatile—this is not financial advice; consider market conditions and DYOR. I am not an advisor just a Kas Maxi sharing my personal views for fun
coinpediamarkets
کاسپا آماده جهش بزرگ؟ تحلیل حیاتی قیمت و نقاط عطف صعودی بیت کوین (KAS)
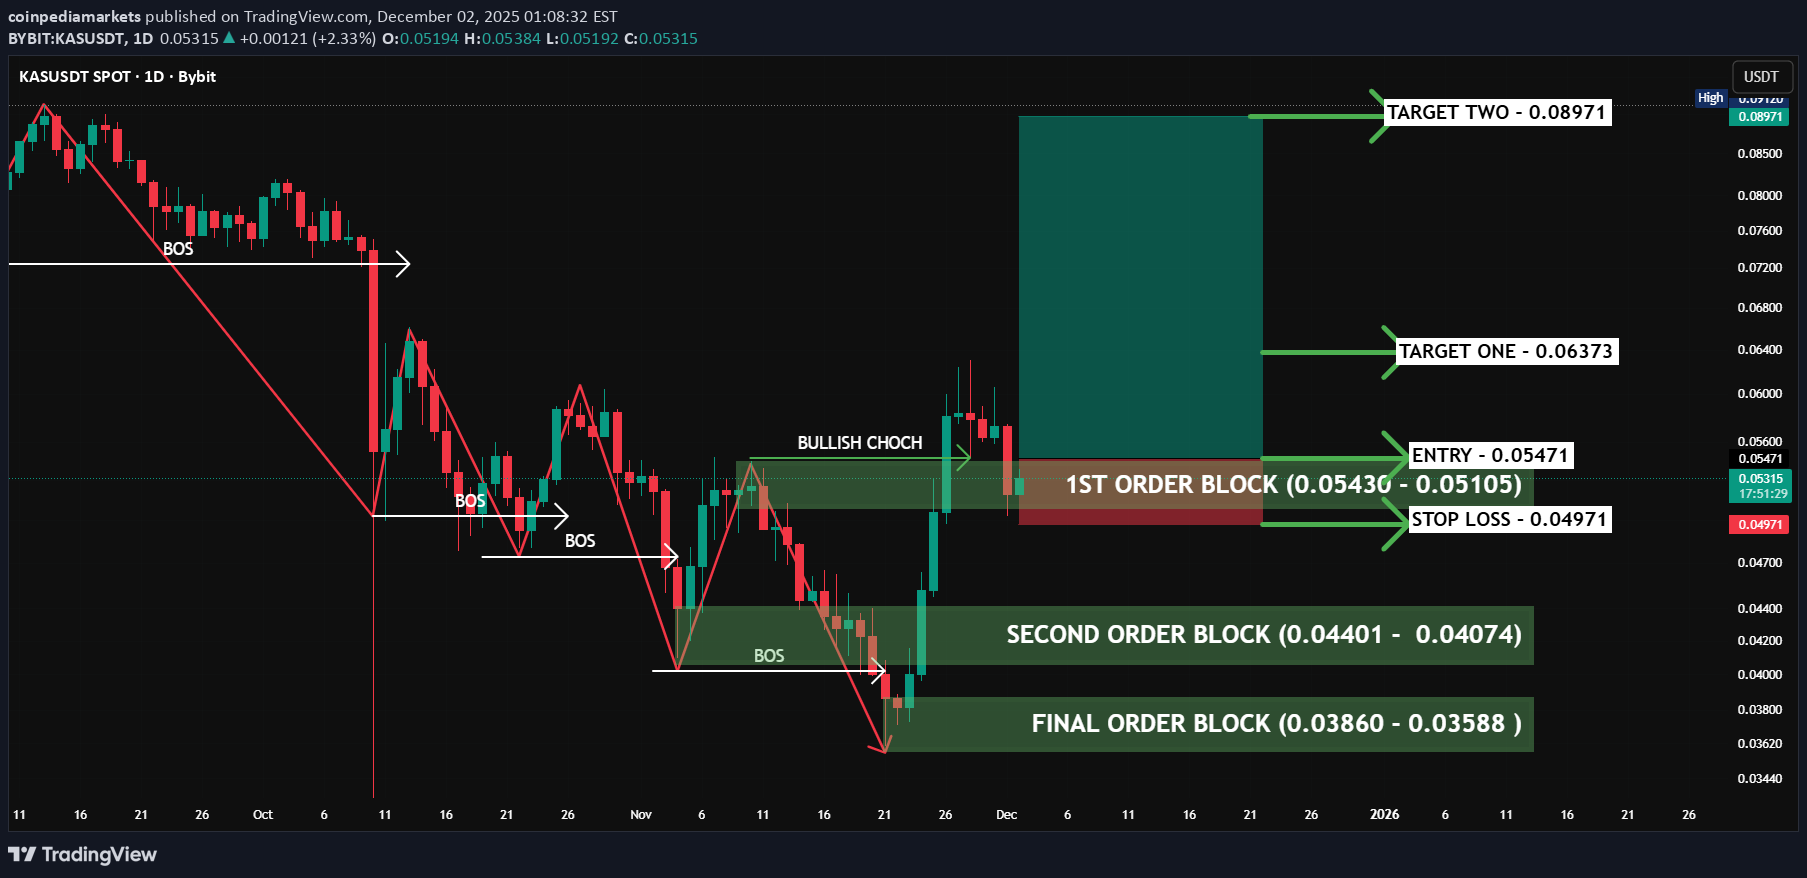
KASUSDT just tapped into the first order block (0.05430 – 0.05105) and reacted with a bullish push, signaling a potential reversal after the confirmed bullish CHoCH on the daily timeframe. If this reaction holds, price could aim for the upside targets at 0.06373 and 0.08971 as marked on the chart. This first order block is crucial—holding above it keeps the bullish structure intact. A break below 0.05105 could open the path to the deeper order blocks at 0.04401 – 0.04074 and 0.03860 – 0.03588. Always manage your risk with the stop-loss at 0.04971 in volatile conditions. For deeper insights and more chart breakdowns, don’t forget to like and comment.Entry activated, Let's hope for Target One

Crypto4light
کاسپا (KAS) آماده جهش به سطح بازگشایی سالانه ۲۰۲۵؟ دو سناریوی محتمل پیش رو!

I think KASUSDT can bounce at least in middle term to yearly open 2025 + the same level its a first big liquidity pool! On left side you can see pure 3 drives pattern! So congrats everyone who out in 2024 Because when on weekly tf after 11000% gains any asset form this pattern its so rare can move higher! Usually its a bearish sign! We already sweep sell side liquidity and close first main M fvg! But like usual we have a most possible 2 scenarios! - Negative we can drop to next m fvg and only after that bounce to yearly open - Positive hold the line now close W fvg and after small retest going to yearly 2025 open next year!

MyCryptoParadise
شکست قطعی KASUSDT تایید شد؟ | آیا در دام نوسان گیر میافتید؟
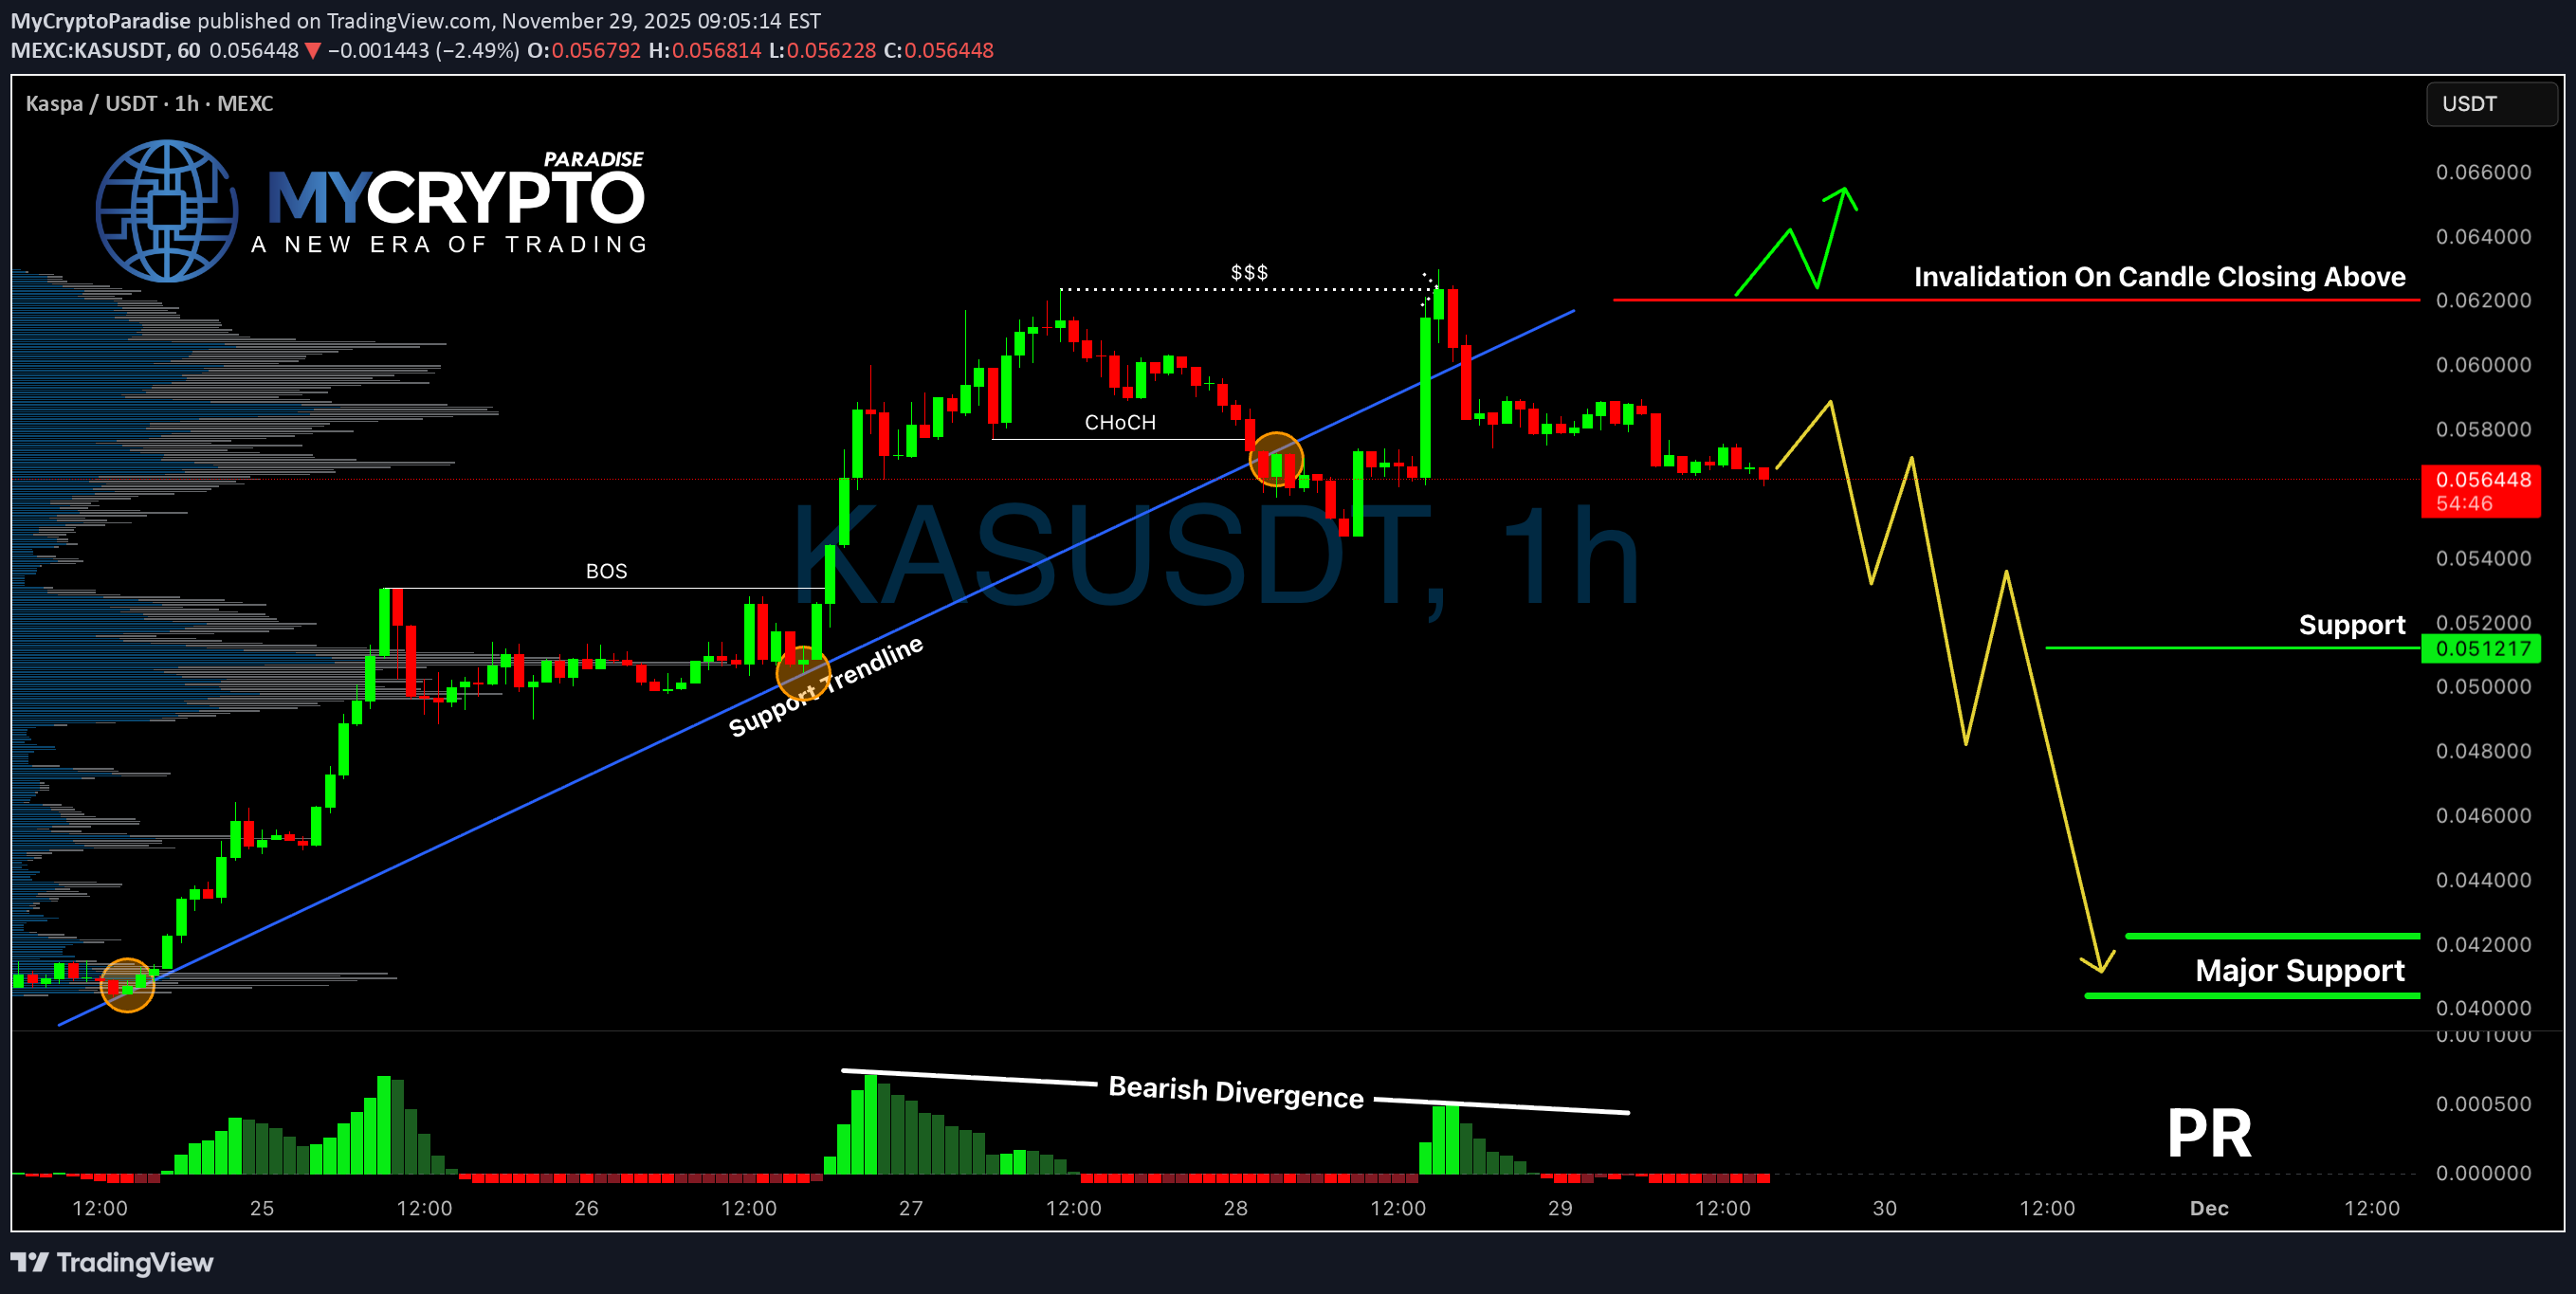
Yello Paradisers, have you already positioned yourself on KASUSDT’s bearish move, or are you about to get trapped by a false bounce? The market just gave us a major clue, and ignoring it could cost you. 💎KASUSDT has officially broken below a critical supportive trendline, which was previously holding the structure intact. This breakdown wasn’t random—it came with a clean bearish CHoCH (Change of Character), and the MACD histogram is flashing a clear bearish divergence. These combined signals significantly increase the probability that this is not just a minor pullback, but the beginning of a more aggressive downside move. 💎From the current market level, there is already a straightforward 1:1 risk-reward opportunity on the table. However, if price pulls back toward the previous support (now resistance), that would offer a much better entry zone with improved risk-reward. But don’t jump in blindly—what we want to see at that level is a bearish candlestick confirmation. Without it, you're only guessing. With it, you’re trading with probability on your side. 💎On the flip side, if KASUSDT breaks out and closes decisively above the invalidation level, that would fully invalidate the current bearish thesis. In that case, it’s smarter to stay on the sidelines and wait for a new high-probability setup to form. This market doesn’t reward impulsive decisions—it rewards patience, discipline, and precision. 🎖Strive for consistency, not quick profits. Treat the market as a businessman, not as a gambler. MyCryptoParadise iFeel the success🌴💎Boom! #KASUSDT is doing just what we said. Down 12.89% and looking good!
پیشبینی آینده کاسپا (KAS) تا سال ۲۰۲۶: آیا این قیمت کف است؟
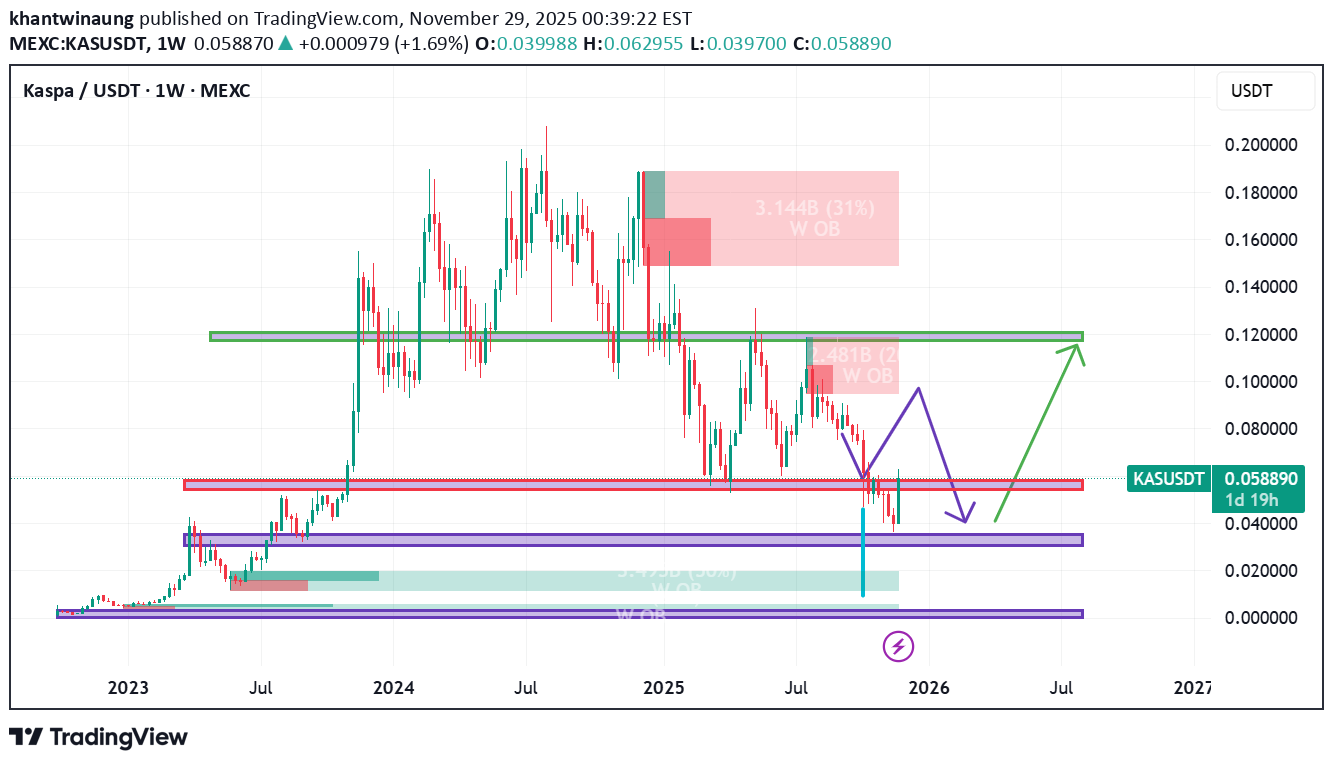
Here’s a detailed analysis of the chart for Kaspa (KAS/USDT) and its potential outlook for 2026: 1. Current Price & Trend Current Price: Around $0.0586. Recent Movement: The price has dropped sharply (around -22%) and is near a strong support zone. Timeframe: Weekly chart (1W), so each candle represents one week. 2. Key Support & Resistance Zones Support Zones: $0.040 – $0.045 (purple zone): Strong historical support; price bounced here before. $0.010 – $0.025 (lower purple zone): Major long-term support if the first zone fails. Resistance Zones: $0.10 – $0.12 (green zone): Significant resistance; price struggled to break this level previously. $0.18 – $0.20 (upper level): Previous high and major supply zone. 3. Projected Scenarios for 2026 Bullish Scenario (Green Arrow): Price holds above $0.04 and breaks $0.10 resistance. Target: $0.12 – $0.18 by mid-to-late 2026. Requires strong market sentiment and volume. Bearish Scenario (Purple Arrow): Price fails to hold $0.04 support and drops toward $0.02. Could happen if overall crypto market weakens or Kaspa loses momentum. 4. Indicators & Patterns Order Blocks: Red zones indicate previous supply areas where sellers dominated. Trend: Currently in a downtrend but near a critical support zone. Volume: Not shown here, but likely declining during the drop. ✅ Updated Bullish Analysis for 2026 Current Situation: Price is around $0.058, very close to the strong support zone at $0.04–$0.05. Historically, this zone acted as a major accumulation area, so the downside risk is limited unless the market collapses. Why It’s Likely to Rebound: Bottom Formation: Price has already retraced significantly from highs ($0.18), suggesting sellers are exhausted. Positive News: Strong fundamentals and project updates will attract buyers. Market Cycle: If Bitcoin enters a bull run in 2026, altcoins like Kaspa typically surge. ✅ Summary: Key level to watch: $0.04 support. If it holds → potential recovery toward $0.10–$0.12. If it breaks → risk of drop to $0.02.

WaveRiders2

DEXWireNews
رشد انفجاری کاسپا (KAS) با افزایش 20 درصدی؛ راز پشت این جهش بزرگ چیست؟
Kaspa ( KAS ) Surge 17% today amidst Network upgrade boosts. Kaspa Breaks Through Momentum Wall as Network Confidence Builds KAS has pushed up nearly 20% in the last 24 hours, reclaiming the $0.06 zone with surprising strength after several days of tight consolidation. The move seems driven more by conviction: rising liquidity, steady miner participation, and the continued narrative around #Kaspa 's blockDAG throughput advantage are giving it a fundamentally supported lift. The $0.13 axis is the resistant point KAS needs to break to cement a move to the $.0.50 pivot. However, failure to break that region will resort to consolidation to the base of the support point. What Is KASPA (KAS)? Kaspa is a fast, scalable Layer-1 cryptocurrency built on proof-of-work (PoW) and powered by the GHOSTDAG protocol — a novel consensus mechanism that extends Nakamoto’s original design. Unlike traditional blockchains that discard competing blocks, GHOSTDAG allows parallel blocks to coexist and orders them within a Directed Acyclic Graph (blockDAG), enabling high throughput while preserving decentralization and security. Kaspa currently processes 10 blocks per second, with a long-term goal of scaling to 100 blocks per second, offering confirmation times limited only by internet latency. Kaspa Price Data The Kaspa price today is $0.059932 USD with a 24-hour trading volume of $122,411,751 USD. Kaspa is up 15.10% in the last 24 hours. The current CoinMarketCap ranking is #47, with a market cap of $1,615,781,305 USD. It has a circulating supply of 26,960,329,287 KAS coins and a max. supply of 28,704,026,601 KAS coins.
WaveRiders2
تحلیل فنی KAS: آیا مقاومت شکسته میشود یا قیمت در دام میافتد؟
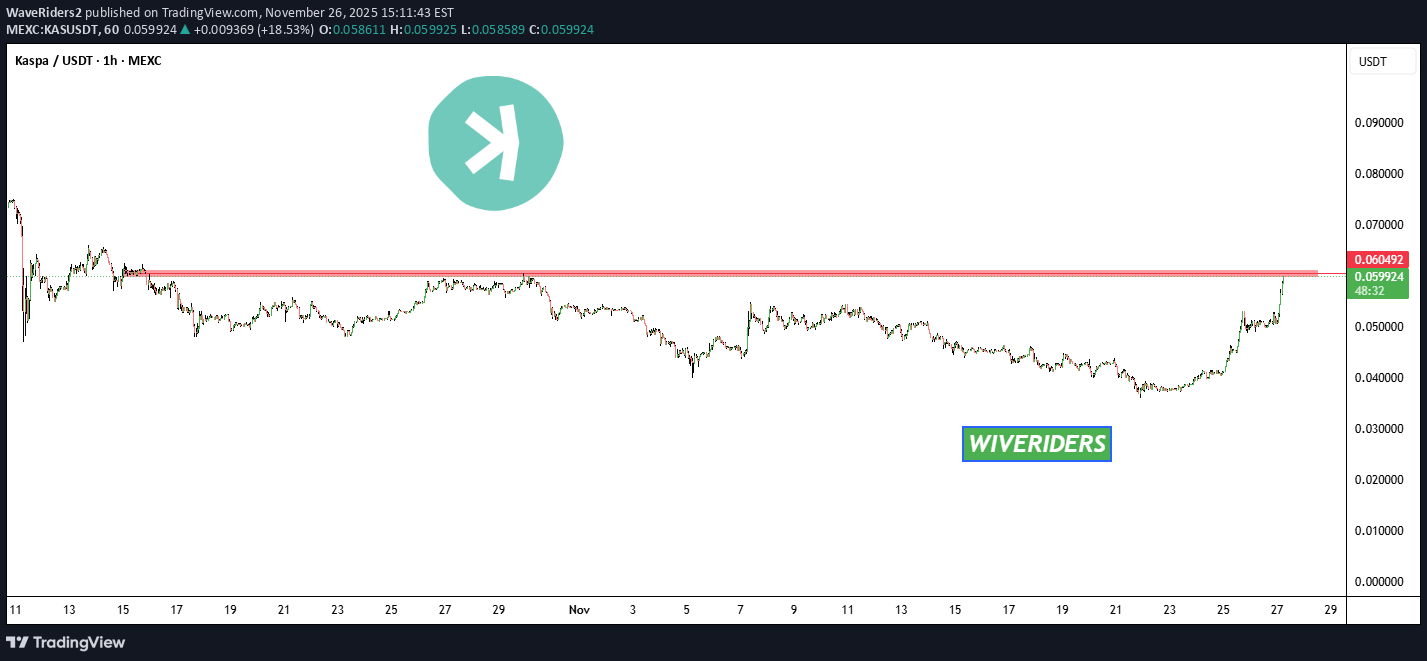
🚨📊 KAS Update KAS is approaching an important resistance zone 🔴, but sellers are not in control this time. Price is moving upward with strength, and this next red zone will be the key level to watch. KAS must break out above this resistance to show a clean continuation toward higher targets. Until that breakout happens, price may face some slowdown at the resistance area.
Disclaimer
Any content and materials included in Sahmeto's website and official communication channels are a compilation of personal opinions and analyses and are not binding. They do not constitute any recommendation for buying, selling, entering or exiting the stock market and cryptocurrency market. Also, all news and analyses included in the website and channels are merely republished information from official and unofficial domestic and foreign sources, and it is obvious that users of the said content are responsible for following up and ensuring the authenticity and accuracy of the materials. Therefore, while disclaiming responsibility, it is declared that the responsibility for any decision-making, action, and potential profit and loss in the capital market and cryptocurrency market lies with the trader.