
Crypto4light
@t_Crypto4light

What symbols does the trader recommend buying?
Purchase History
پیام های تریدر
Filter
Crypto4light
Sui and potential new all time high

I still think we will see a new ath SUIUSDT question only how high and where the price will stop! My targets are unchanged and are indicated on the chart! After the initiation accumulation distribution phases that we played just filigree, the price tested the first zone of interest once again with a wick on October 10! It makes no sense to go back to it again or to the lower zone! The next move is waiting for the weekly block order withdrawal weak high and the final impulse to the marked targets!
Crypto4light

Crypto4light
Bitcoin Cycles and Russell 2000! What's the Connection?

I'm not a BTC maxi, and I'm not against BTC at all! I just never understood the fanatics—whether it's the BTC cult or XRP. As I've said before, the human brain is wired to hunt for patterns, confirmations, and setups where none actually exist! That's how conspiracy theories are born! Sure, on a global scale, conspiracies and certain ideas do turn out to be true! But with BTC and its 4-year cycle model, halvings, and all that jazz, it's such an oversimplified framework—tailor-made for people who aren't used to looking beyond the surface or thinking critically at all! Why bother thinking when they've told you there's this orange coin that should pump every 4 years, then the miners' rewards get slashed and the coin should pump again! Why? Nobody's ever explained it! It's just that, back then, the halving model was the only marketing gimmick tied to the tech side that could draw in users! How else was a brand-new asset, fresh out of nowhere in the world, supposed to grab attention? So they cooked up this price-growth stimulus like that! But the market's matured now—demand has exploded, enough to soak up any supply out there. To me, the halving is more of a news event that rallies all the market's forces into a tight timeframe, making it easier to reboot the whole thing. As far as I'm concerned, the whole story about halvings driving BTC's cycles and growth is pure fiction! On the chart, they've just slapped on the Bitcoin halvings, and down at the bottom is the RUT (Russell 2000)—that's the index of 2,000 small-cap companies across all sorts of sectors! How does it end up that the reactions on the charts are identical? Are people buying stocks in companies based on the halving of some made-up digital coin? Or is it way simpler: global investors, riding favorable market vibes in the moment, just pile into risk assets—and that includes both Bitcoin and those 2,000 small-cap companies And for all you BTC diehards to chew on: The RUT index kicked off in the late '80s! Thirty years before that orange coin even showed up! Every asset—especially in crypto—needs some kind of hook, a legend, a mystery! Something to stir up the buzz! So let's not keep dragging in the halving as some magical force! Just like we shouldn't put blind faith in these so-called cycles! BTCUSD
Crypto4light
Cardano: Final Retest of Demand Before Parabolic Leg?

This weekly ADAUSDT idea maps out a possible end‑of‑cycle accumulation inside the large red demand box that has held price since 2023. I work with this fib levels since top in 2021. Price is retesting this zone while still trading under the long‑term descending trendline, (line chart) creating conditions for a potential macro breakout once that line is reclaimed and flipped to support. The dashed path outlines an impulsive leg toward the mid‑range around 1.30–1.95, (to 0.5 of fib Weekly) followed by higher Fibonacci extensions up to the 1.618 at roughly 4.55, with invalidation below the lower boundary of the demand box
Crypto4light
HBAR simple chart for 2026

Check out this long-term HBARUSDT chart. Idea is pretty simple! I track this chart since 2021 and if we cut all noise we can find the best zone for spot accumulation (marked box zone) Key supports at 0.10 current level or even better retest 0.08 again! Levels for fixation step by step Yearly open 2025. Fibonacci extensions levels and 1.618 by mid-2026 around 0.65 cents would be enough for this cycle! But i understand majority waiting over 1$ price! But most likely it will not happen! What's your HBAR target? DYOR!
Crypto4light
تحلیل تکنیکال تیایاییواسدیتی: سقوط نهایی تا کانال و ناحیه کلیدی ۲۷!
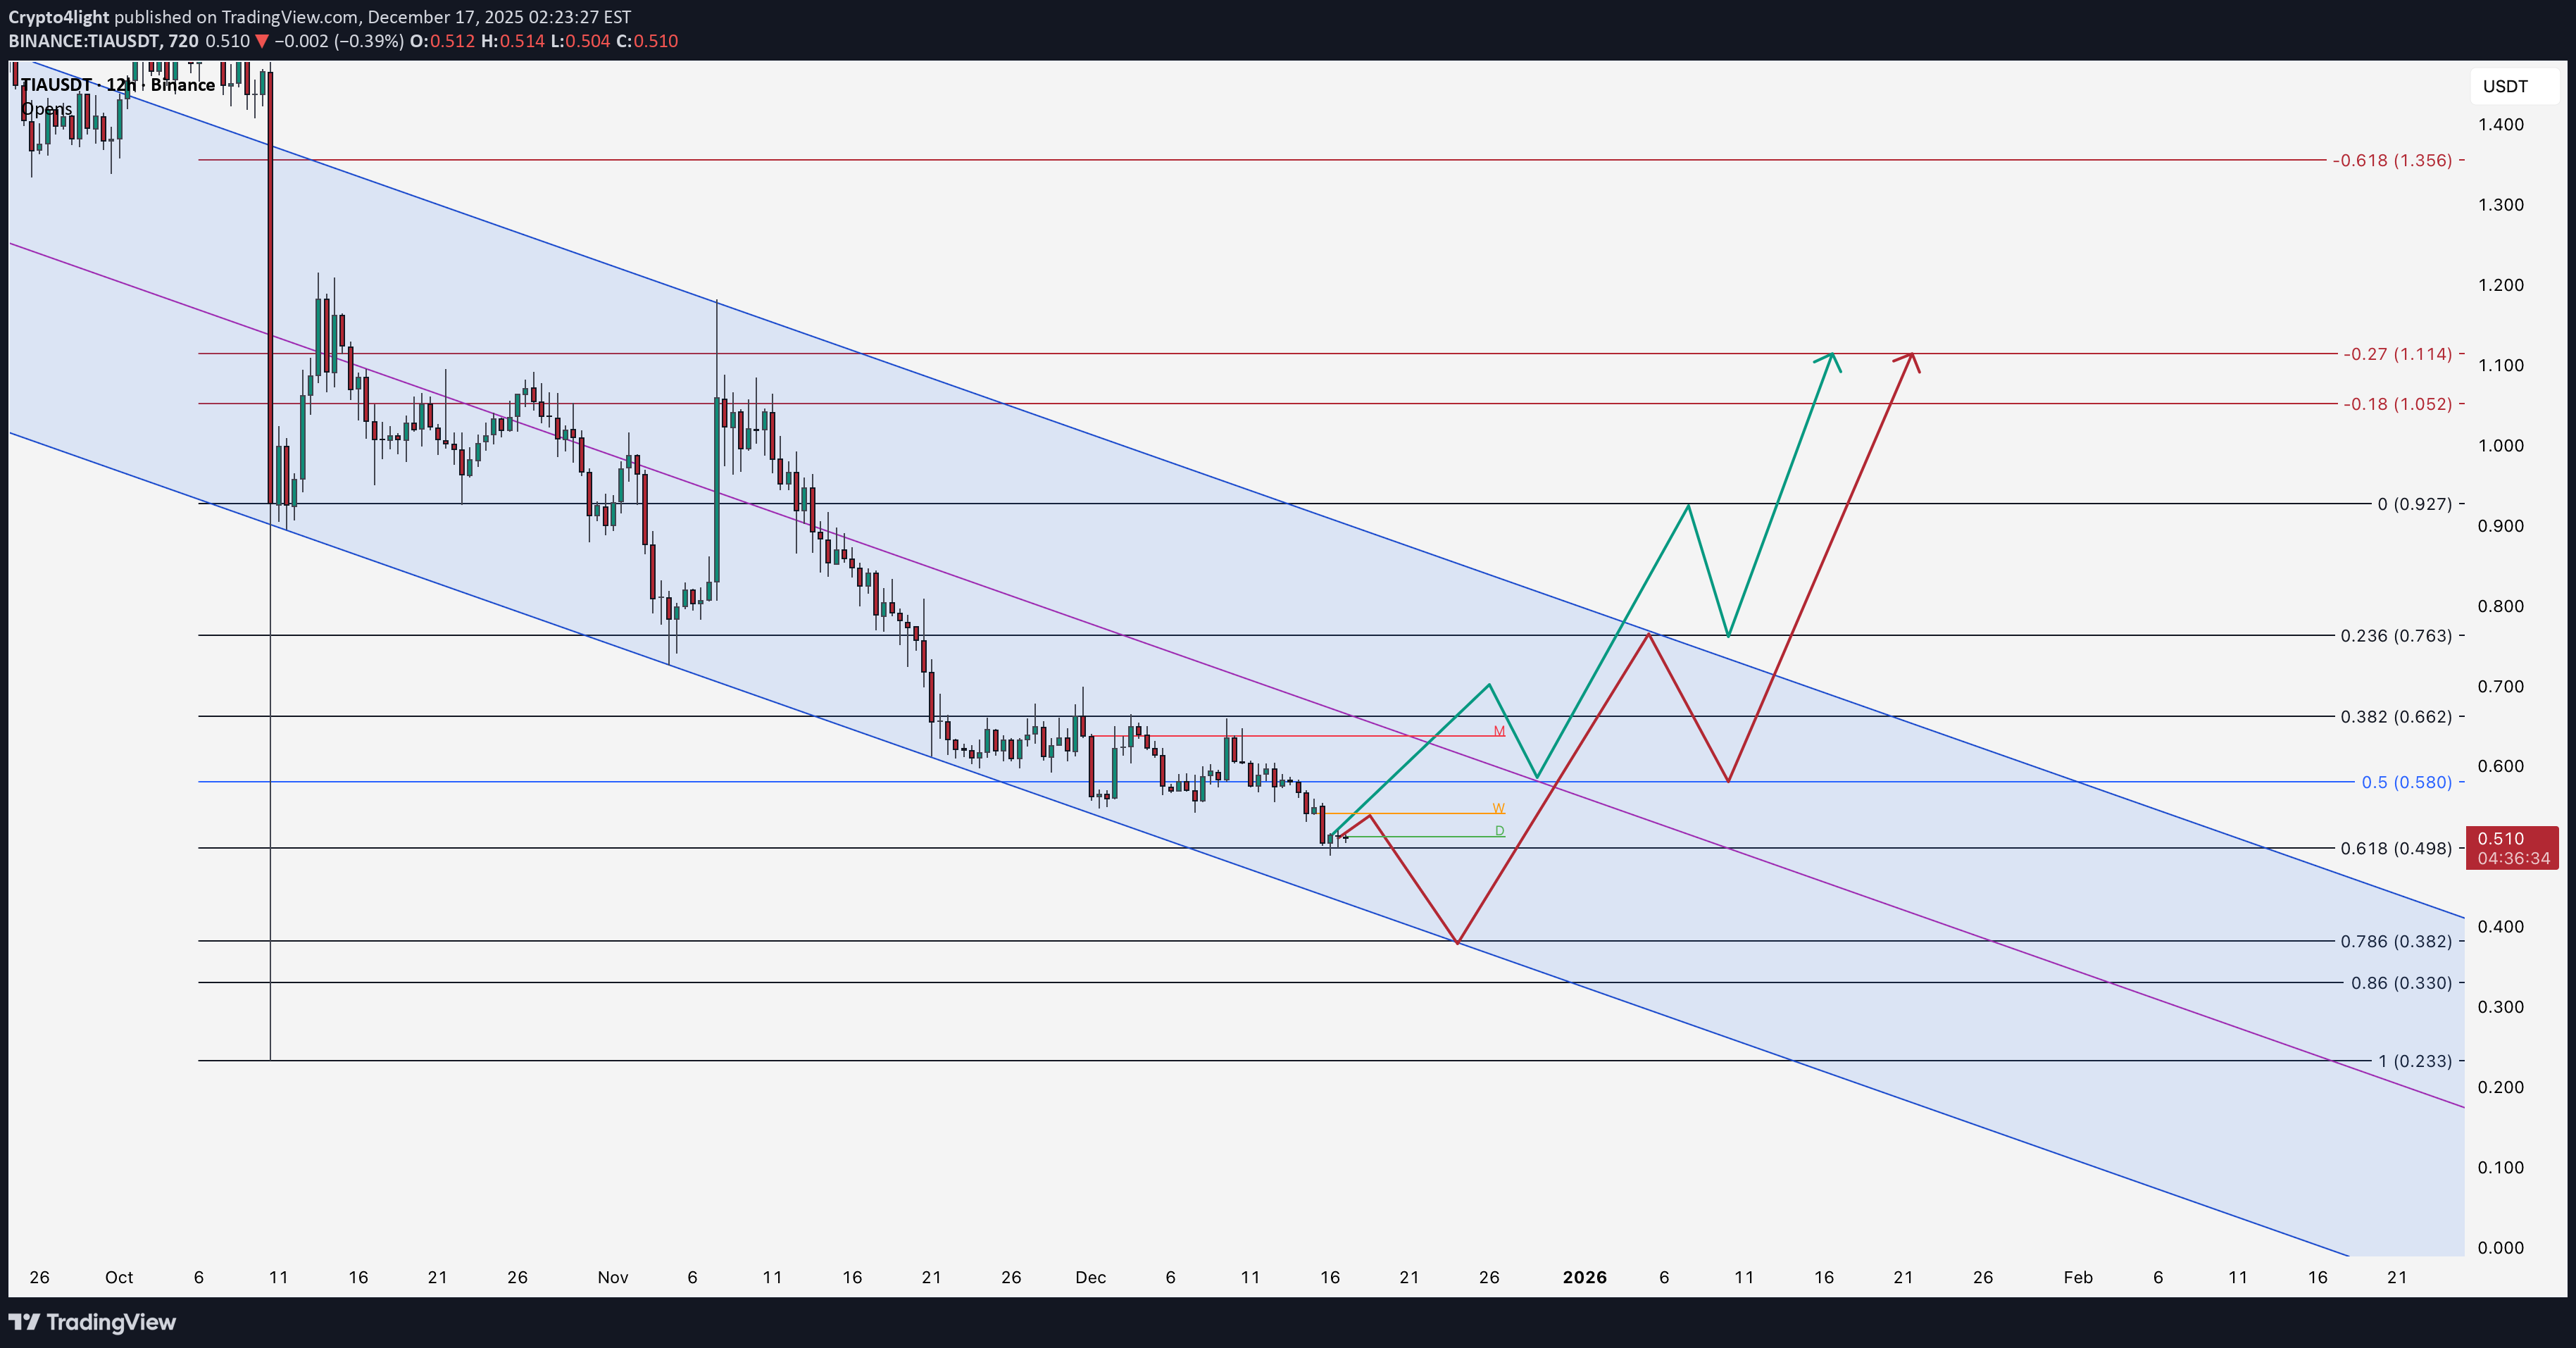
Simple idea with fib (wick Daily from 10 october) TIAUSDT We already at 0.61 fib but based on channel and Japan decision about rates in next few days we can see final drop to 3rd touch of channel around 23-26 December! After that road will be to equilibrium of channel and 27 zone of fib where more than okay withdraw initial deposit or fix local trade
Crypto4light
ZEN Daily Demand Reload for a New Leg Up
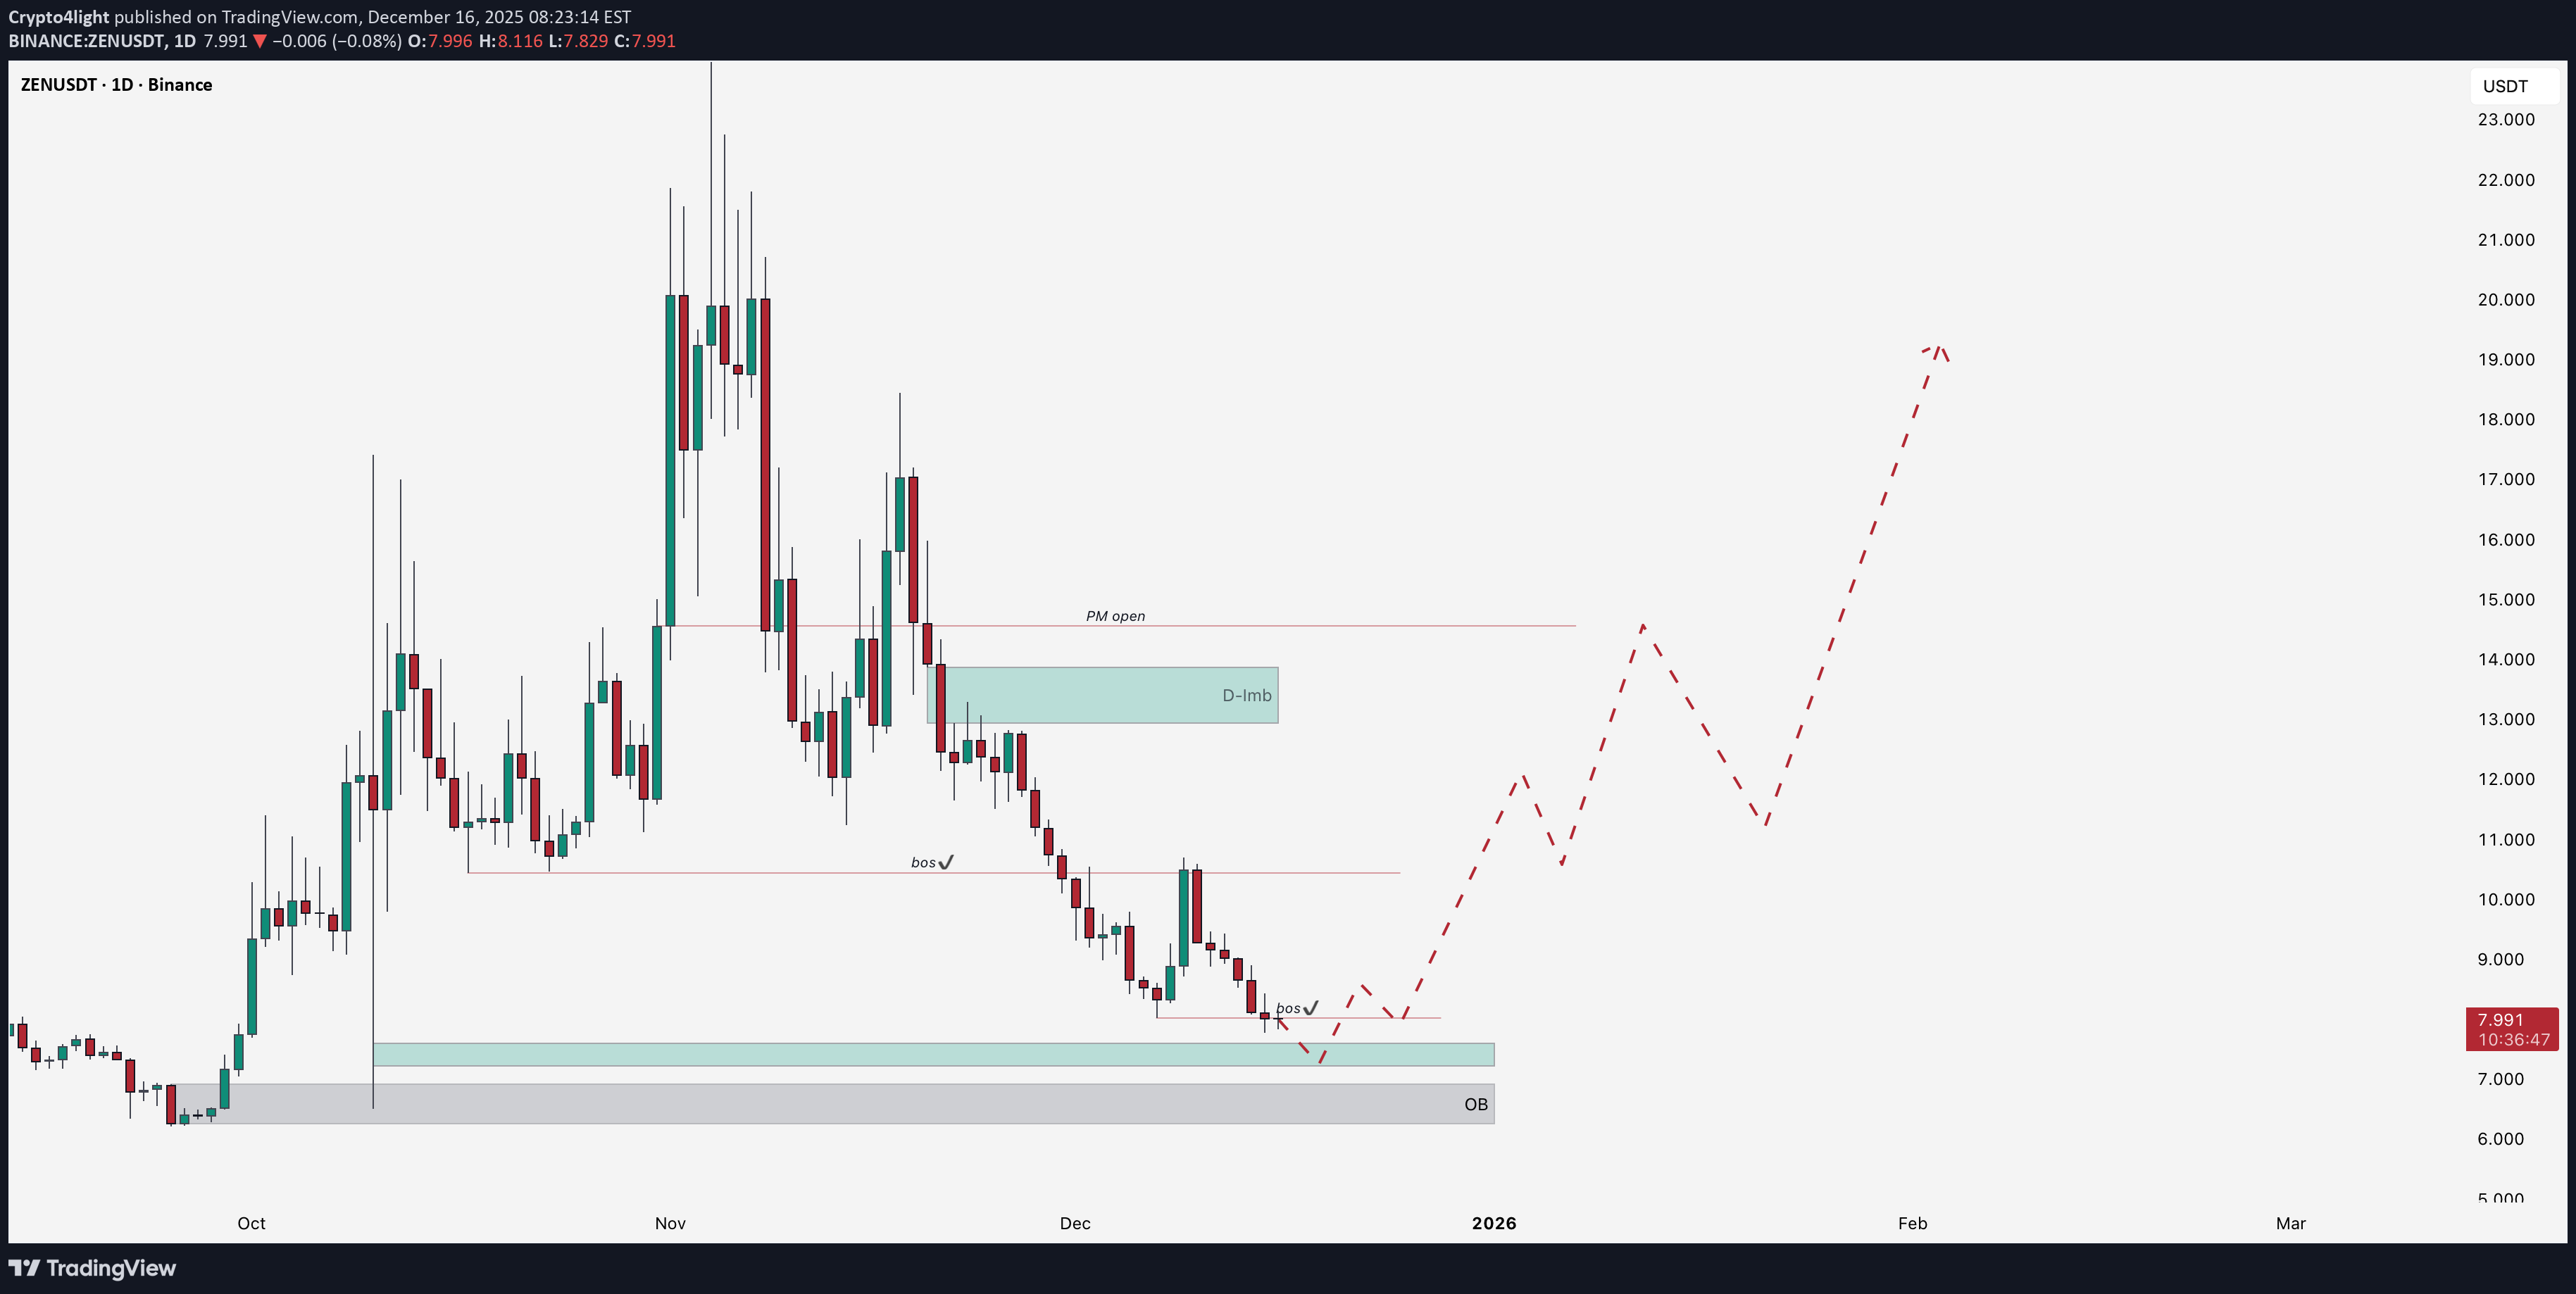
This ZENUSDT idea focuses on a potential bullish reversal from higher‑timeframe demand after an extended daily downtrend. The road can be open to strong demand/OB zone at the bottom of the chart, where previous buying originated, and a short‑term break of structure is already marked, hinting at the start of a possible shift in momentum. The dashed path projects a series of higher highs and higher lows targeting first the daily imbalance (D‑Imb) around the prior range, and then a larger continuation move toward the 17–19 USDT area, with the current demand zone used as invalidation for the setup. Timing around after 26 December 2025
Crypto4light
Manta at Discount: Two Scenarios From the 10 Oct Wick
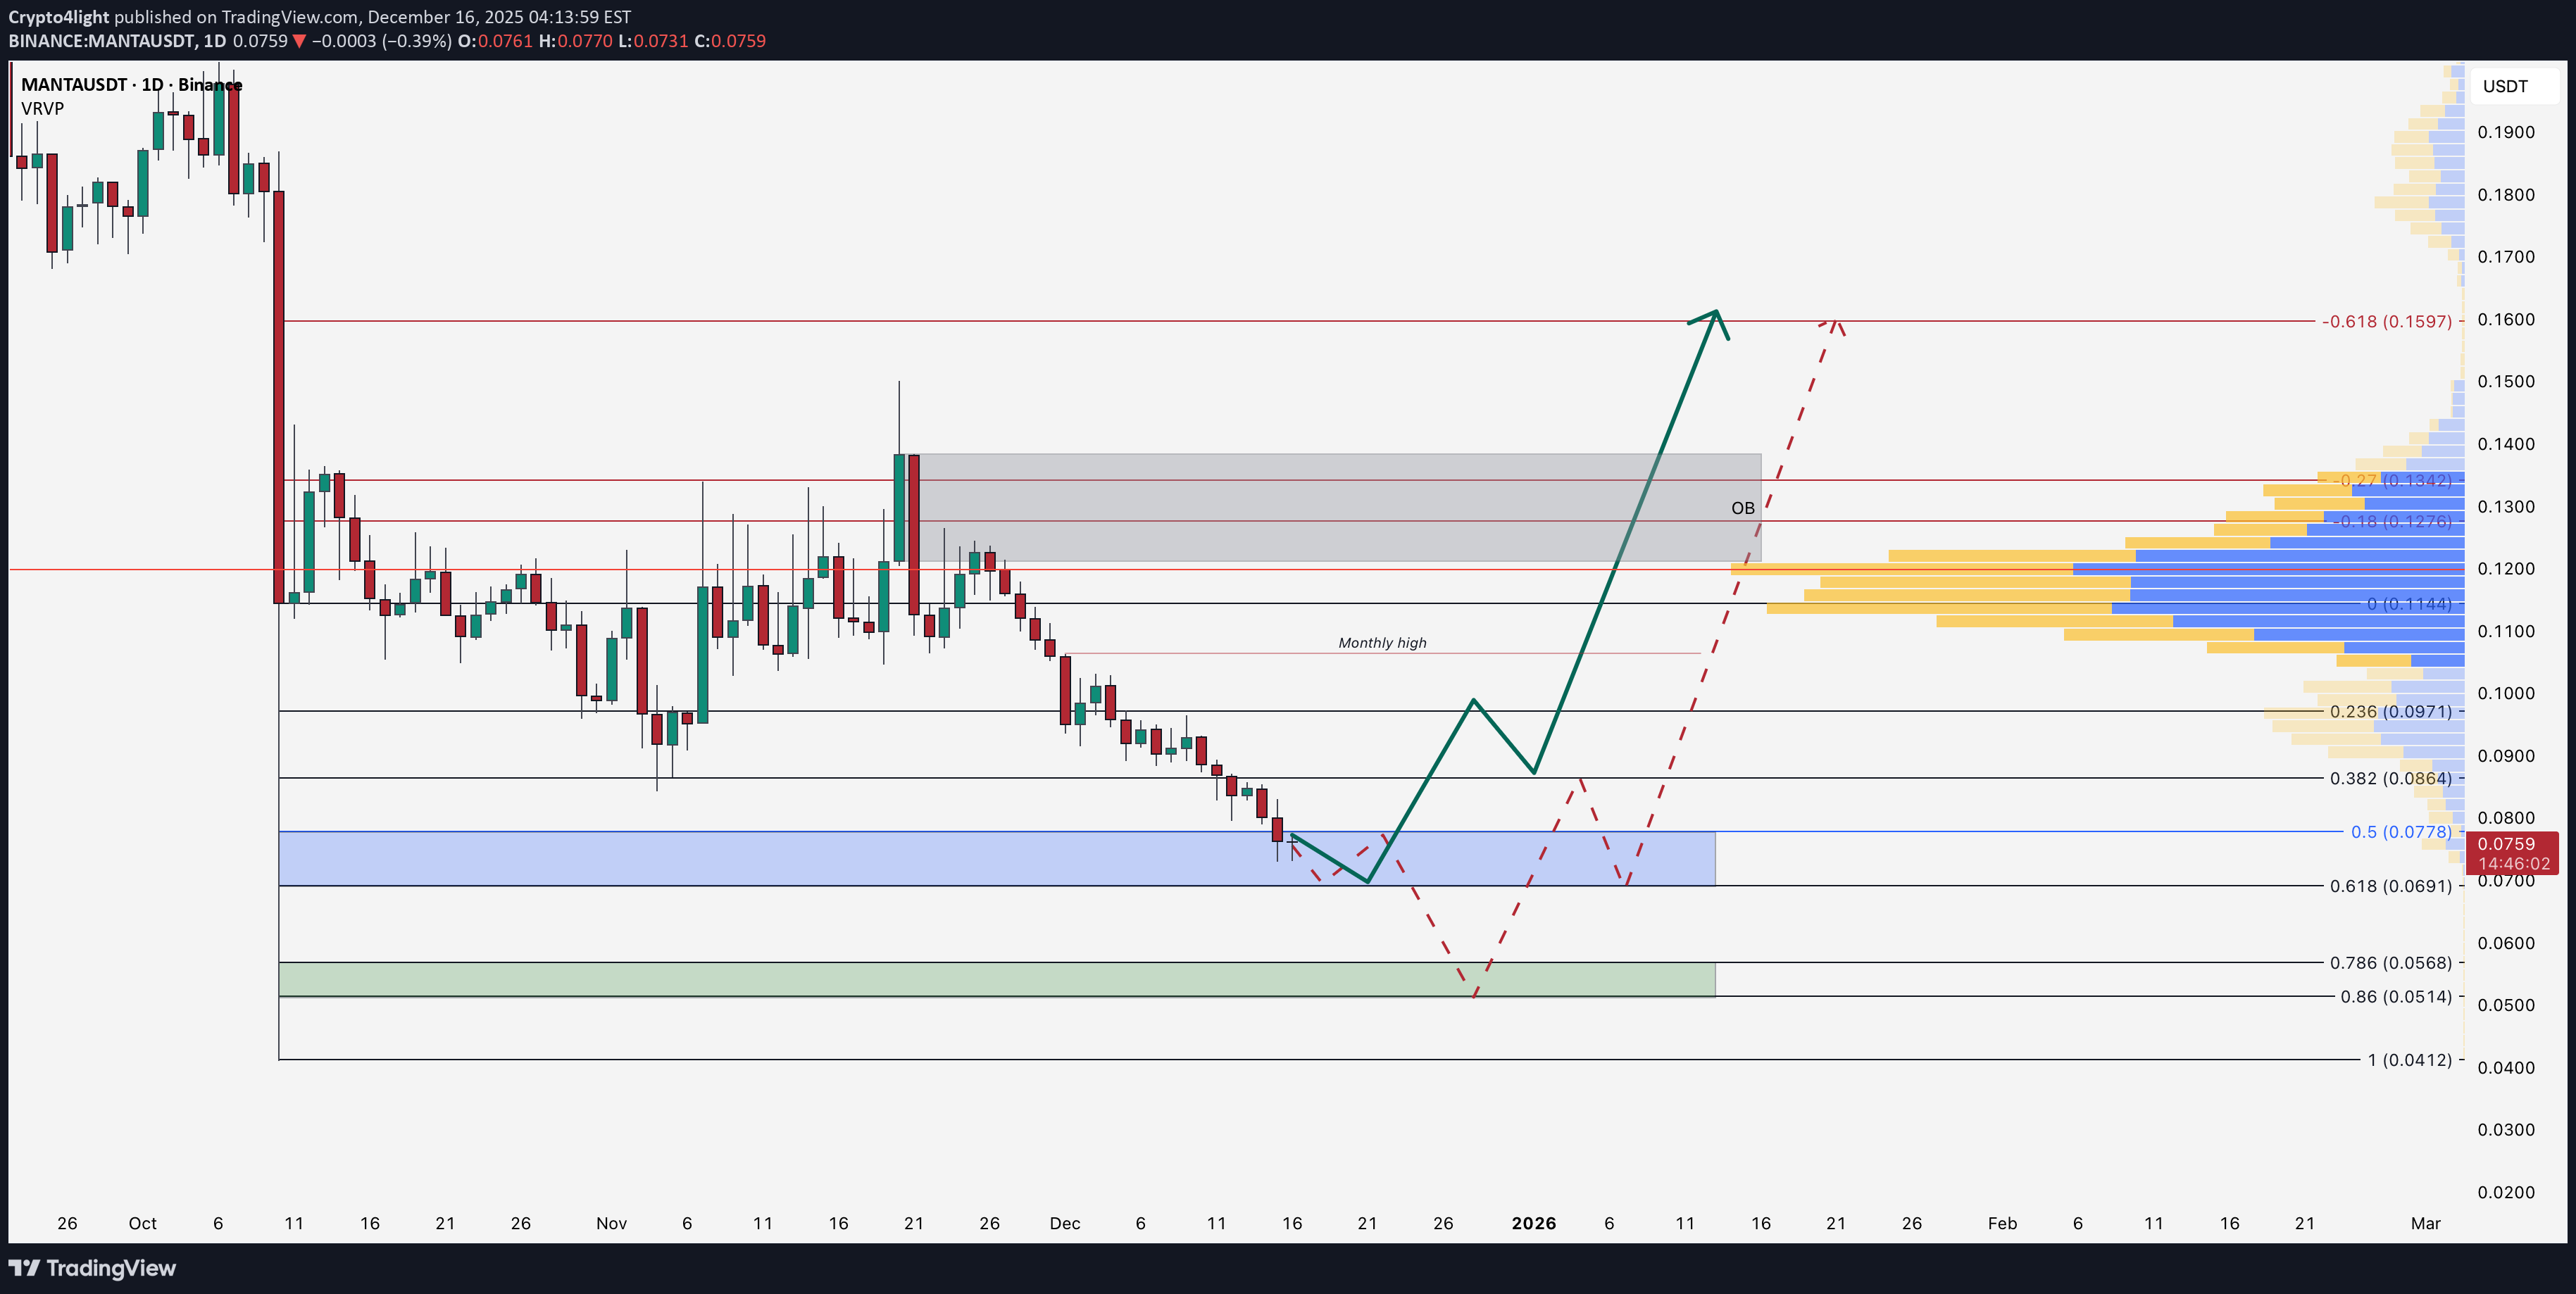
Two possible paths for MANTAUSDT based on the Fibonacci levels of the long wick left after the 10 October sell‑off. Price has been in a steady downtrend and is now trading inside a higher‑timeframe demand zone (blue), which lines up with the 50–61.8% retracement of that October wick move. From here the primary scenario is a bullish reversal: accumulation inside this demand, a higher low, and then an impulsive rally into the daily order block (grey), targeting roughly the 0.12–0.16 region where previous range highs and the main volume POC (point of control) The alternative scenario is a deeper sweep of liquidity. If the first reaction from the blue zone fails, price can extend toward the lower green demand area, close to the 0.786–0.86 retracement of the same wick. A capitulation into this zone would complete a larger discount before a stronger mid‑term reversal, with the same upside targets later at the grey order block and high‑volume cluster. Invalidation is a clean breakdown below the green zone, while take‑profits are staged first around the mid‑range / “monthly high” and then into 0.12–0.16.
Crypto4light
ZRO Post-Listing Power: Retest Accumulation & Bullish Breakout
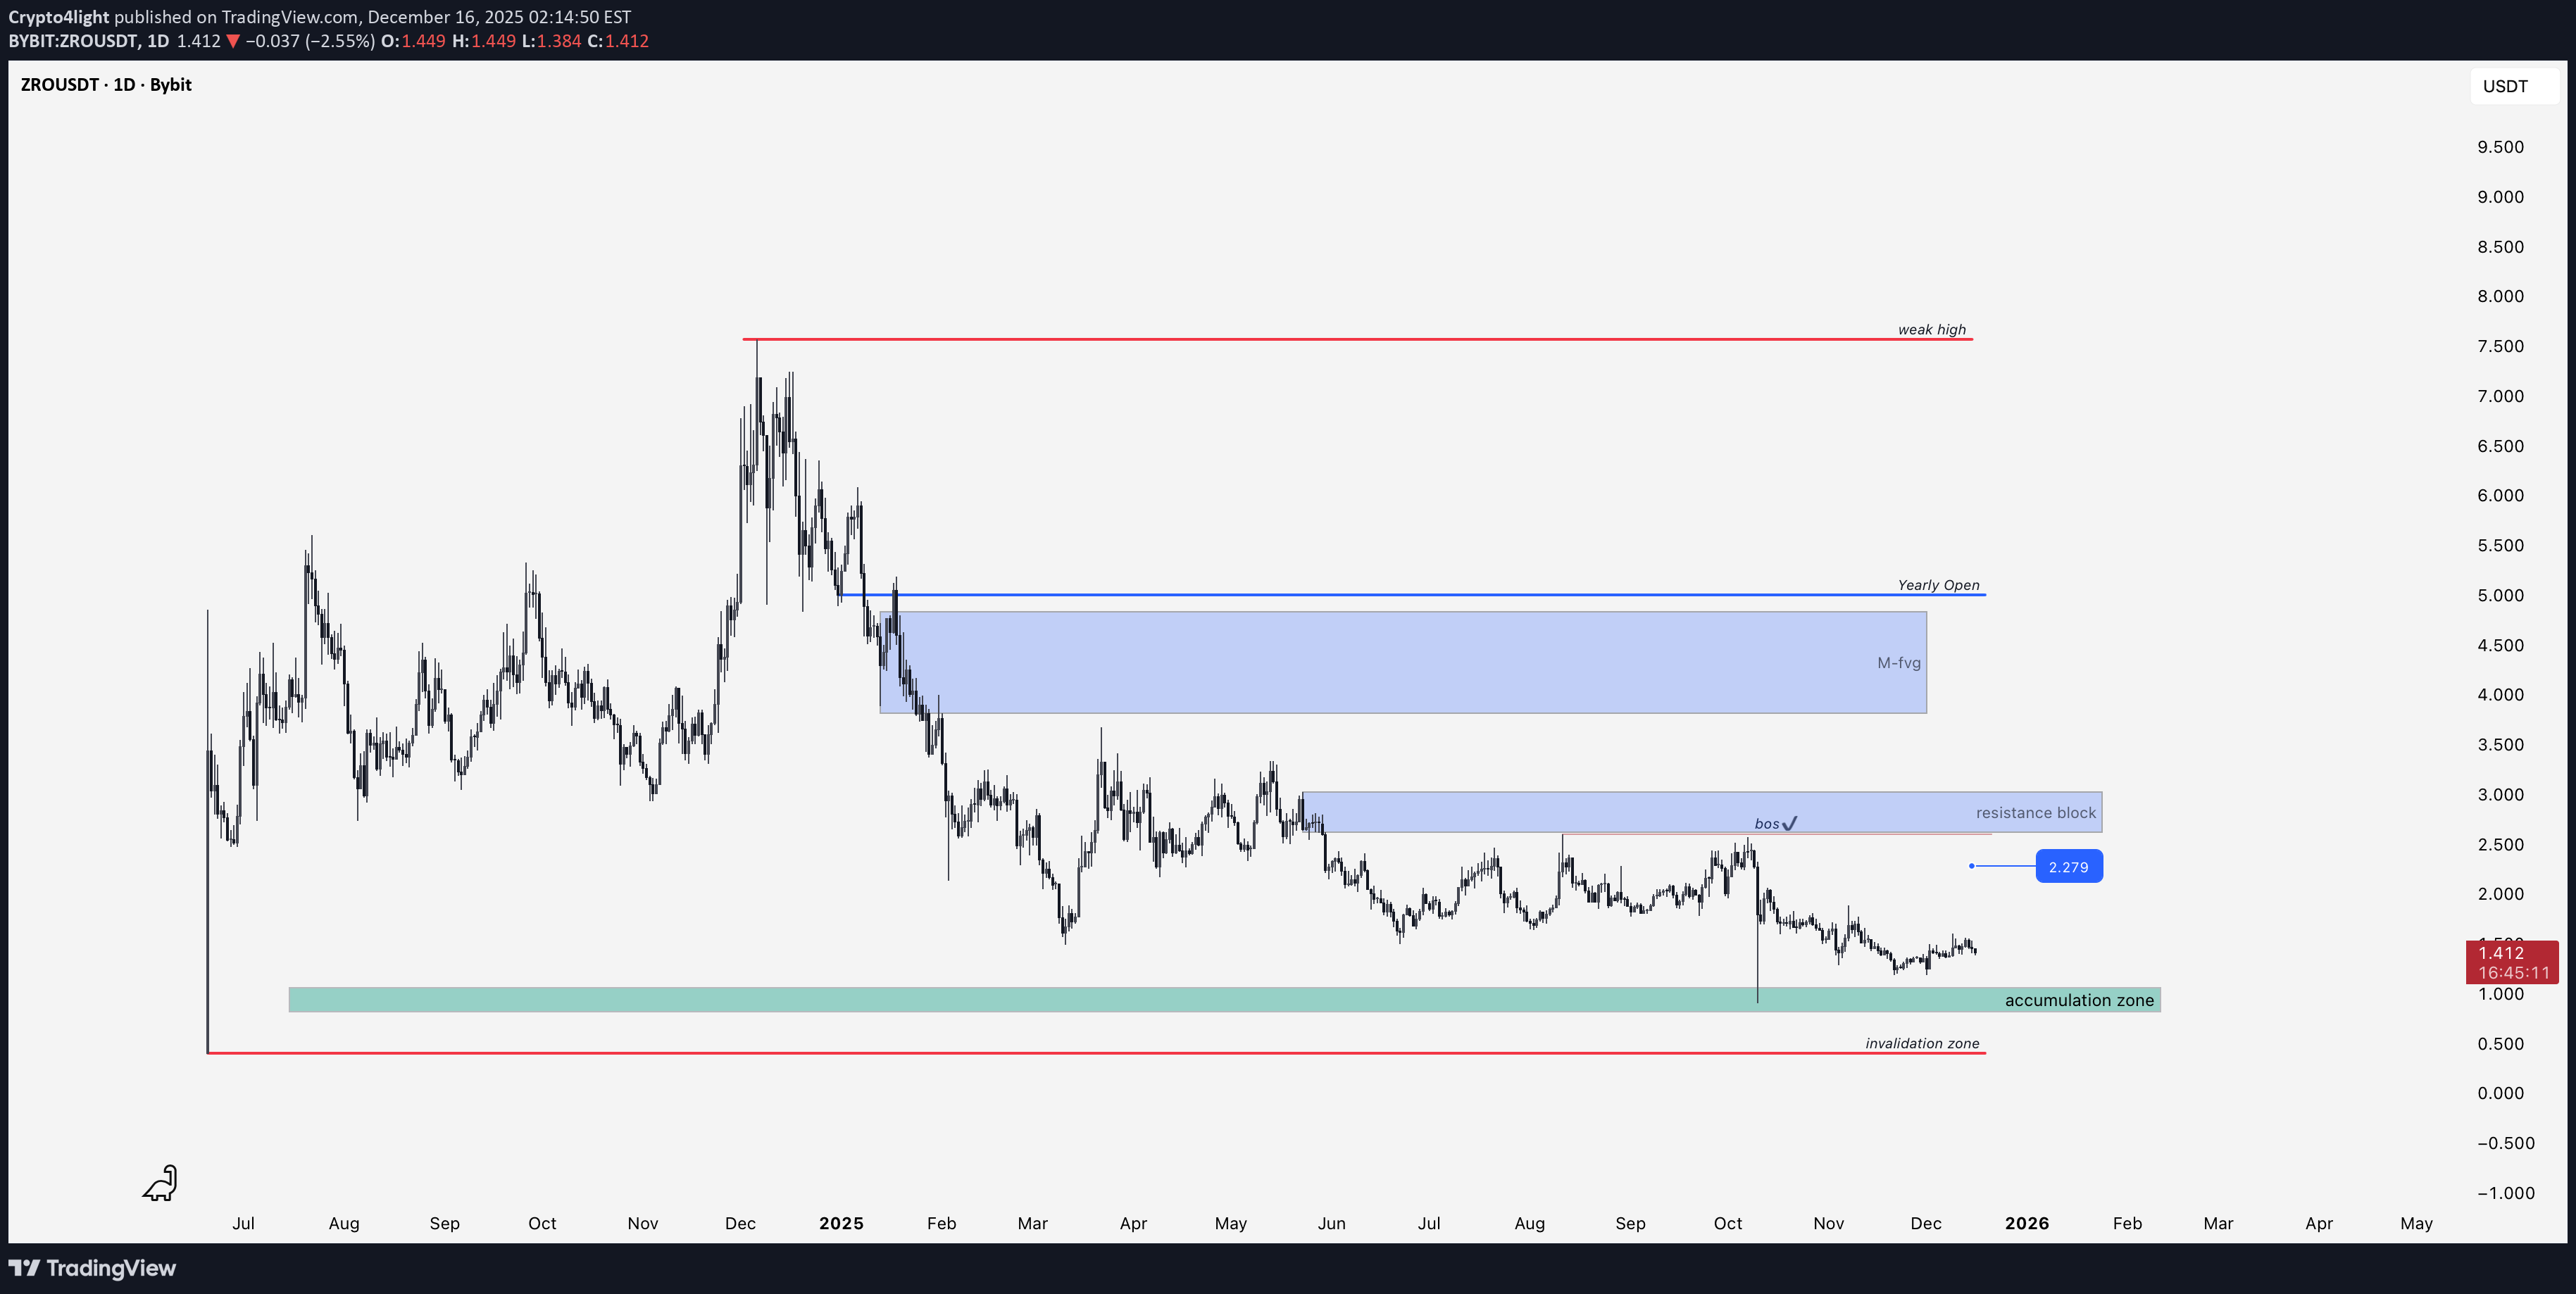
ZRO looks pretty decent after the listing compared to the charts of tokens that were added to exchanges at the same time! ZROUSDT Technically, we've reached the Initiation Accumulation Distribution phase up to the last accumulation zone! But it's always profitable to start DCA here. Invalidation of the idea if the price goes below the listing price! Locally, I ideally expect a retest of the accumulation zone followed by an upward movement to the resistance block and a structure break on the daily timeframe! The next targets will be the monthly imbalance and the opening of 2025! Upon reaching these targets, it will be relevant to update the idea!
Crypto4light
تحلیل تکنیکال ژوپیتر (JUP): نواحی کلیدی که الان باید زیر نظر بگیرید!
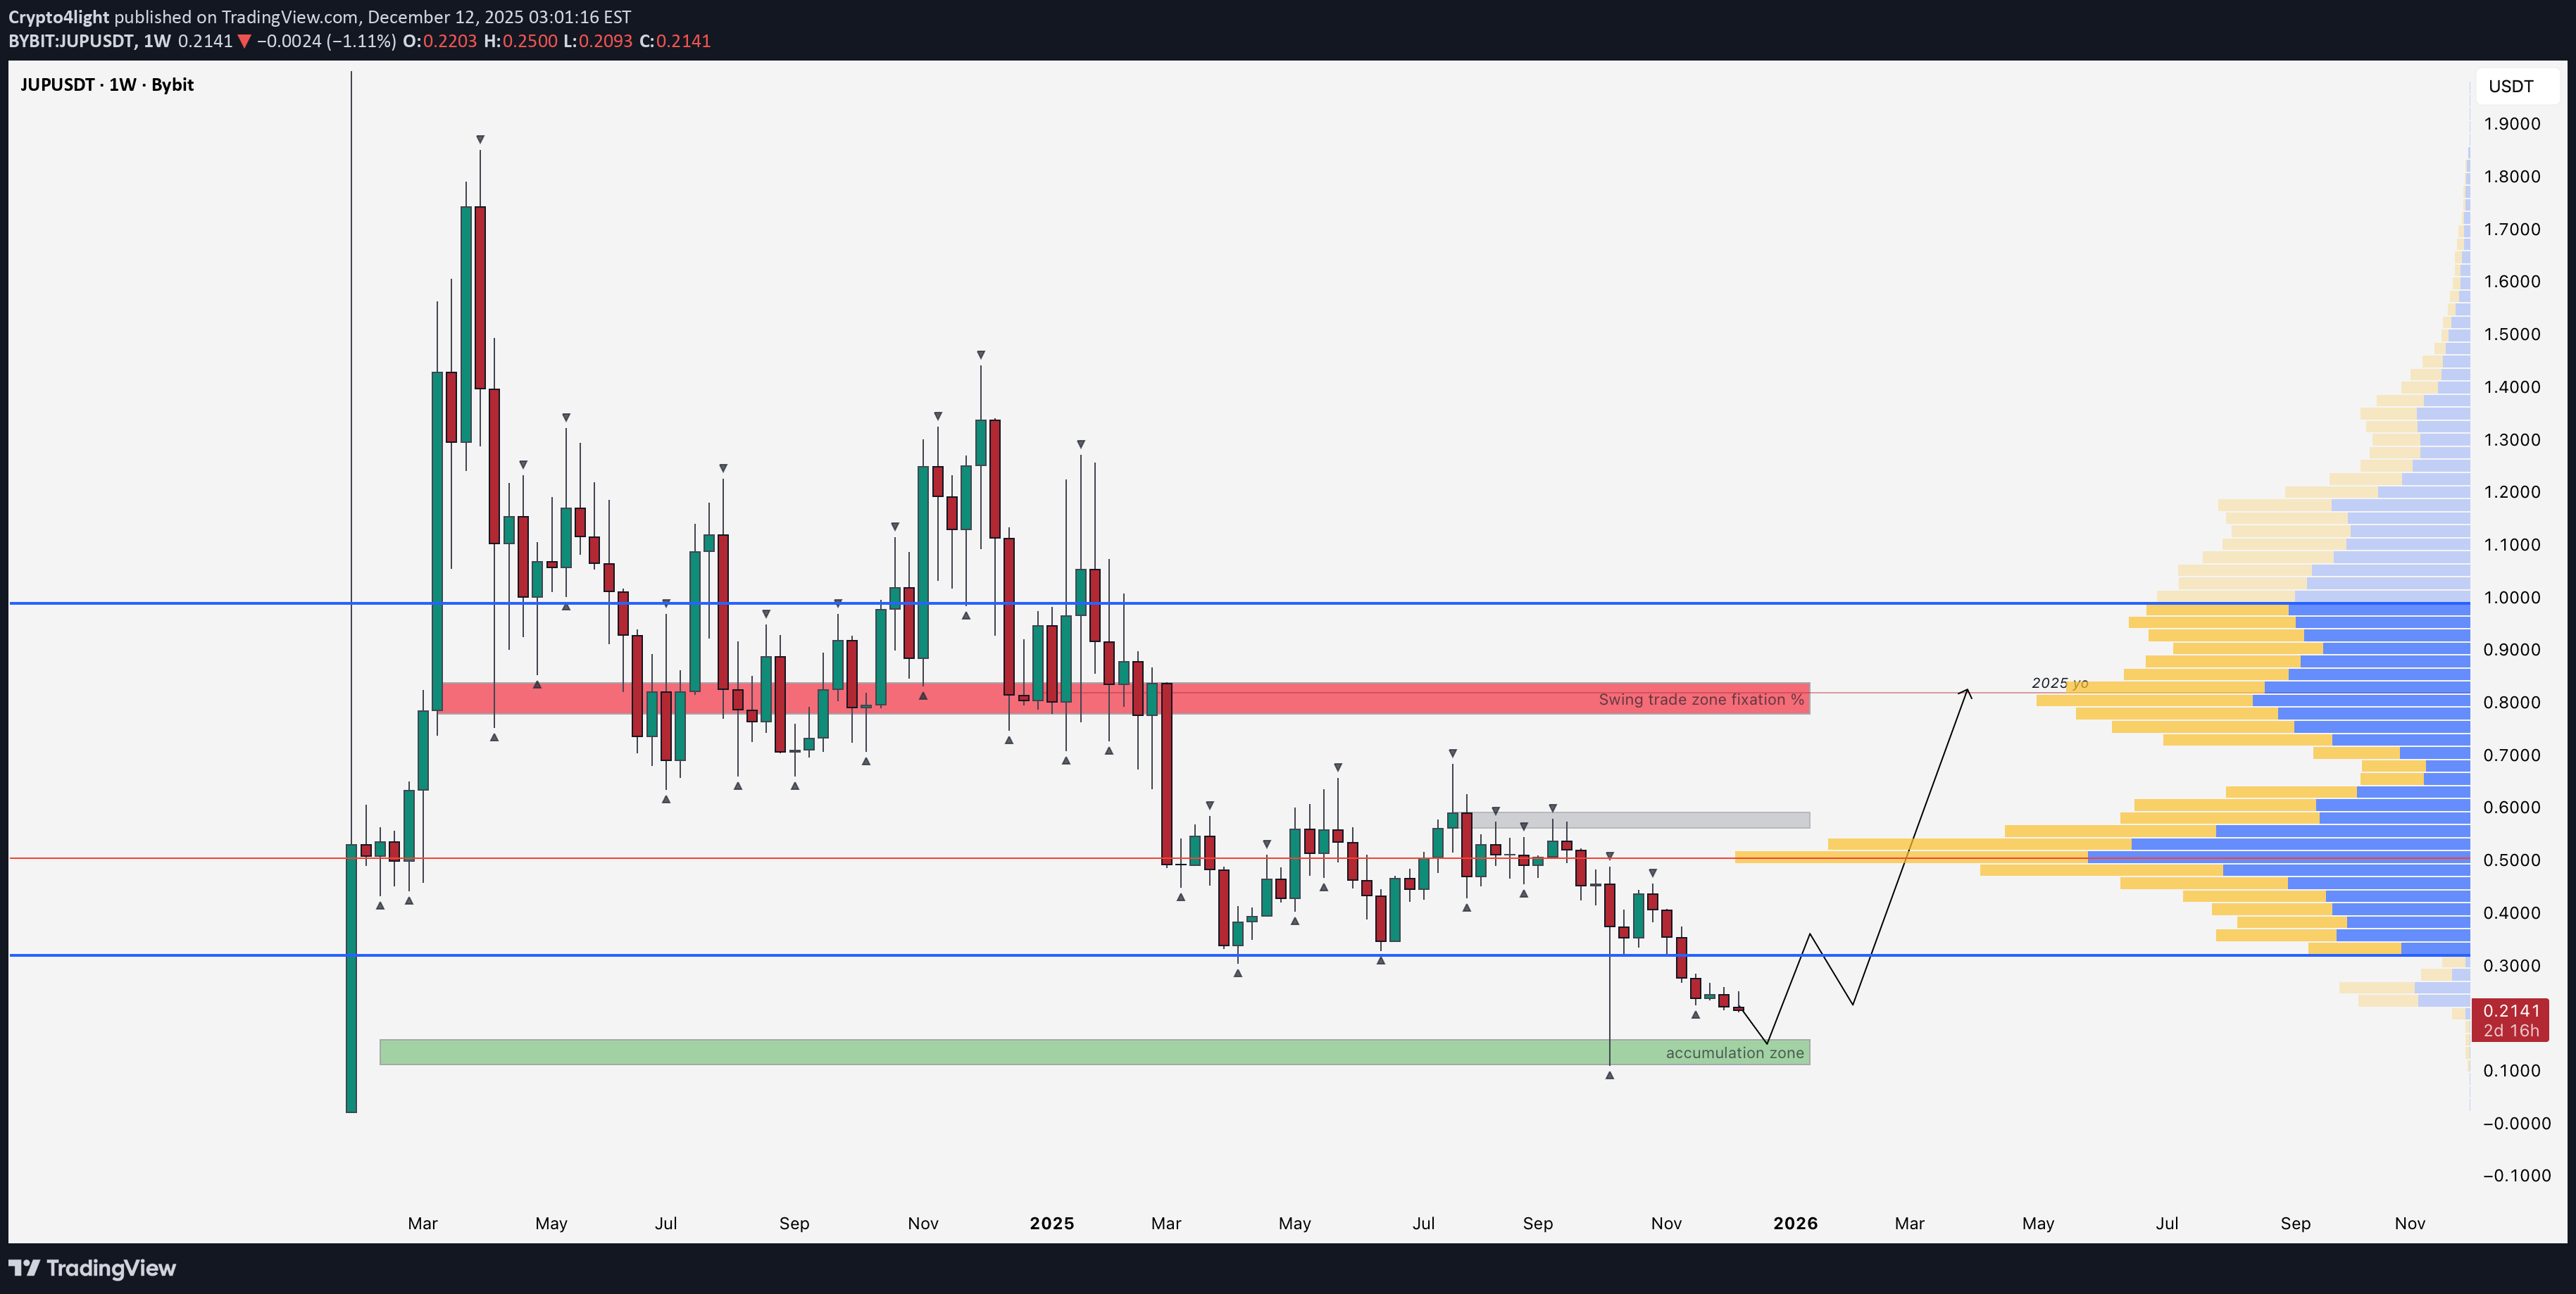
Jupiter Technical Analysis: Key Zones to Watch Right Now JUPUSDT The initial idea published on the second day after the listing has played out perfectly! We reached the marked accumulation zone almost to the cent. Sometimes even the most unlikely zones perform exactly as expected — because the initiation–accumulation–distribution cycle is the basic scenario for nearly all tokens after listing. Now, two years later, we’ve returned to the accumulation zone. The ideal scenario would be to retest this zone once again. The idea becomes invalid if the price drops below $0.02, which I believe is quite unlikely. The swing position take-profit zone is marked in red — this also aligns with the 2025 yearly open. The first resistance zone on a rebound, likely around January next year, will be the Point of Control and the weekly order block.
Disclaimer
Any content and materials included in Sahmeto's website and official communication channels are a compilation of personal opinions and analyses and are not binding. They do not constitute any recommendation for buying, selling, entering or exiting the stock market and cryptocurrency market. Also, all news and analyses included in the website and channels are merely republished information from official and unofficial domestic and foreign sources, and it is obvious that users of the said content are responsible for following up and ensuring the authenticity and accuracy of the materials. Therefore, while disclaiming responsibility, it is declared that the responsibility for any decision-making, action, and potential profit and loss in the capital market and cryptocurrency market lies with the trader.