
khantwinaung
@t_khantwinaung

What symbols does the trader recommend buying?
Purchase History
پیام های تریدر
Filter
پیشبینی آینده کاسپا (KAS) تا سال ۲۰۲۶: آیا این قیمت کف است؟
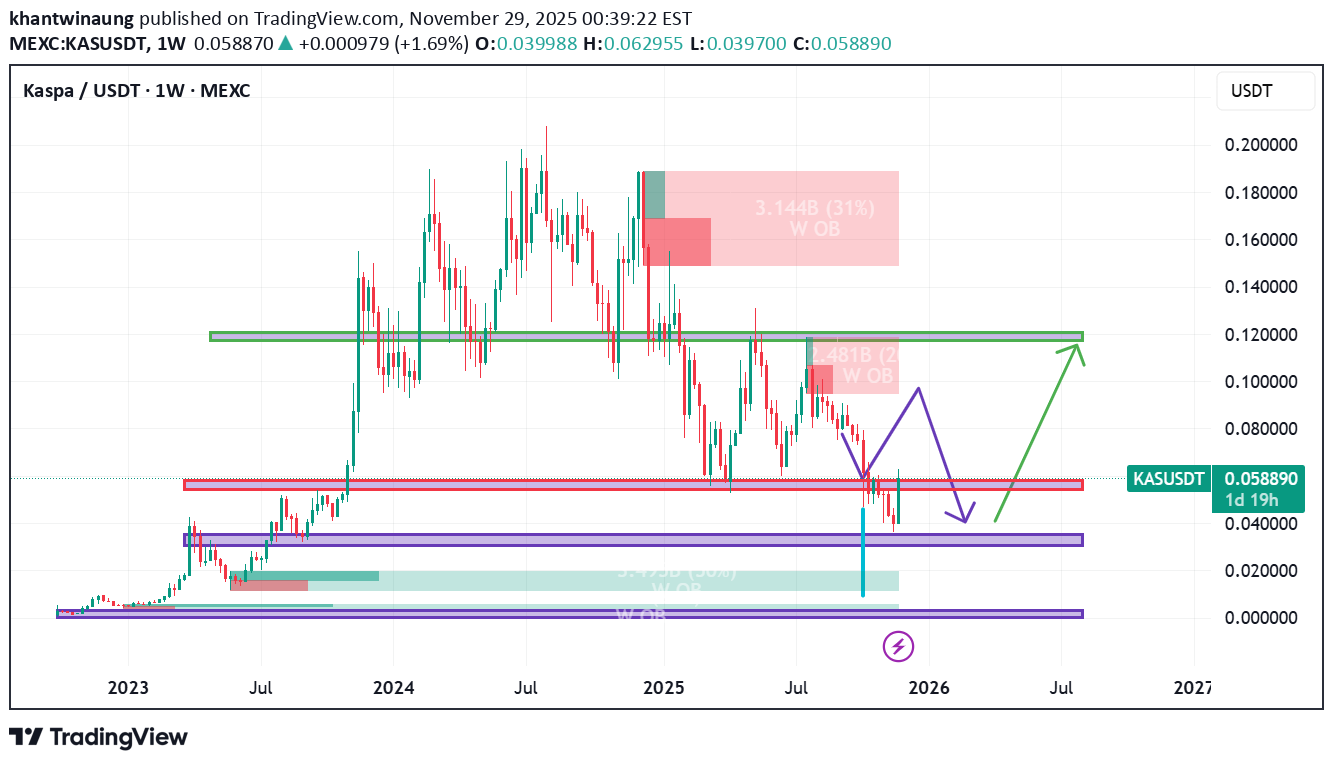
Here’s a detailed analysis of the chart for Kaspa (KAS/USDT) and its potential outlook for 2026: 1. Current Price & Trend Current Price: Around $0.0586. Recent Movement: The price has dropped sharply (around -22%) and is near a strong support zone. Timeframe: Weekly chart (1W), so each candle represents one week. 2. Key Support & Resistance Zones Support Zones: $0.040 – $0.045 (purple zone): Strong historical support; price bounced here before. $0.010 – $0.025 (lower purple zone): Major long-term support if the first zone fails. Resistance Zones: $0.10 – $0.12 (green zone): Significant resistance; price struggled to break this level previously. $0.18 – $0.20 (upper level): Previous high and major supply zone. 3. Projected Scenarios for 2026 Bullish Scenario (Green Arrow): Price holds above $0.04 and breaks $0.10 resistance. Target: $0.12 – $0.18 by mid-to-late 2026. Requires strong market sentiment and volume. Bearish Scenario (Purple Arrow): Price fails to hold $0.04 support and drops toward $0.02. Could happen if overall crypto market weakens or Kaspa loses momentum. 4. Indicators & Patterns Order Blocks: Red zones indicate previous supply areas where sellers dominated. Trend: Currently in a downtrend but near a critical support zone. Volume: Not shown here, but likely declining during the drop. ✅ Updated Bullish Analysis for 2026 Current Situation: Price is around $0.058, very close to the strong support zone at $0.04–$0.05. Historically, this zone acted as a major accumulation area, so the downside risk is limited unless the market collapses. Why It’s Likely to Rebound: Bottom Formation: Price has already retraced significantly from highs ($0.18), suggesting sellers are exhausted. Positive News: Strong fundamentals and project updates will attract buyers. Market Cycle: If Bitcoin enters a bull run in 2026, altcoins like Kaspa typically surge. ✅ Summary: Key level to watch: $0.04 support. If it holds → potential recovery toward $0.10–$0.12. If it breaks → risk of drop to $0.02.
Disclaimer
Any content and materials included in Sahmeto's website and official communication channels are a compilation of personal opinions and analyses and are not binding. They do not constitute any recommendation for buying, selling, entering or exiting the stock market and cryptocurrency market. Also, all news and analyses included in the website and channels are merely republished information from official and unofficial domestic and foreign sources, and it is obvious that users of the said content are responsible for following up and ensuring the authenticity and accuracy of the materials. Therefore, while disclaiming responsibility, it is declared that the responsibility for any decision-making, action, and potential profit and loss in the capital market and cryptocurrency market lies with the trader.