Technical analysis by GoonBoyCrypto about Symbol KAS: Buy recommendation (12/4/2025)

GoonBoyCrypto
تحلیل تکنیکال کاسپا (KAS): آیا موج صعودی بزرگ پس از کفسازی آغاز میشود؟
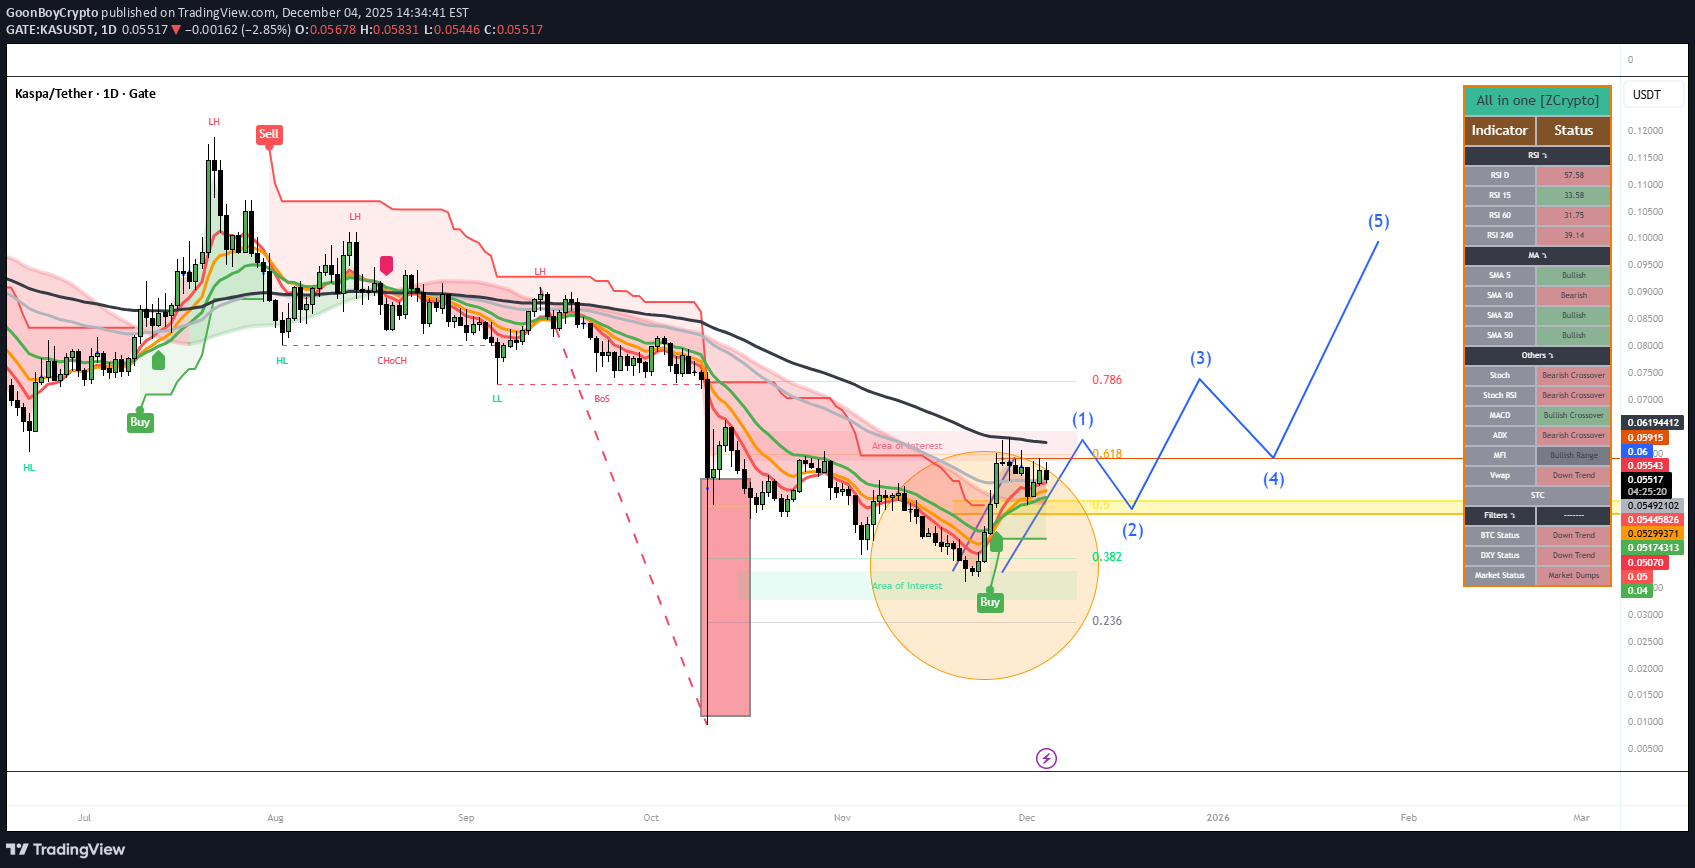
Chart Analysis This is a daily (1D) candlestick chart for KAS/USDT on the Gate.io exchange, created by "GoonBoyCrypto" as of December 4, 2025. It covers historical price action from July 2025 onward, with projections extending into early 2026 (up to March). The price scale ranges roughly from 0.0500 to 0.1500 USDT, indicating Kaspa's value has been trading in a low range during this period. The chart incorporates elements of Smart Money Concepts (SMC), Fibonacci levels, and an Elliott Wave count, along with buy/sell signals and areas of interest. Here's a breakdown: Key Price Action and Patterns Uptrend Phase (July–August 2025): The chart starts with a bullish move, marked by a green "Buy" signal near a low of ~0.08 USDT. Price rallies to a high of approximately ~0.14 USDT, forming a green-shaded bullish area. This is followed by a pullback to a "HL" (Higher Low), suggesting temporary support. Downtrend Phase (August–December 2025): After peaking, a red "Sell" signal appears at the top, labelled "LH" (likely Lower High). The trend shifts bearish with a "ChCh" (Change of Character) and "BoS" (Break of Structure), indicating a reversal from bullish to bearish structure. Price declines steadily, with pink-shaded bearish areas and a sharp red downward arrow highlighting a major drop (possibly in November), bottoming out near ~0.04 USDT. A large red candle emphasises this capitulation. Potential Reversal (December 2025 Onward): At the low, there's another green "Buy" signal and an orange-circled "Area of Interest" (possibly an order block or fair value gap for accumulation). The price forms a bottoming pattern, like a consolidation triangle or wedge, before breaking out upward. Elliott Wave Projection: The numbered labels (1) through (5) suggest an impulsive bullish wave count starting from the December low:(1): Initial up to ~0.0618 USDT. (2): Retrace down to ~0.0382 USDT. (3): Extension up to ~0.0786 USDT. (4): Pullback to ~0.0236 USDT (this seems aggressive and may indicate a deep correction or a labelling error; it could be a Fib 0.236 retracement level). (5): Projected upward leg, pointing toward higher levels (potentially ~0.10 USDT or beyond, based on the line's trajectory into 2026). These levels (0.236, 0.382, 0.618, 0.786) are classic Fibonacci retracement/extension points, likely drawn from the major high-to-low move, guiding the wave targets. Indicators used feature the "All in One [Crypto]" indicator suite, including RSI, Stochastic (Stoch), MACD, ADX, Veup, and others. Signals are mixed: Bearish Signals: Stoch RSI (Bearish Crossover), MACD (Bearish Crossover), ADX (Bearish Range), Veup STC (Down Trend), DX (Down Trend, Market Dump). Bullish Signals: SMA 10 (Bullish), SMA 20 (Bullish), SMA 30 (Bullish Others), some RSI variants (e.g., RSI 40 at 36.83, potentially oversold). Neutral/Other: RSI 14 at 50.3 (neutral), overall suggesting waning bearish momentum but not yet fully bullish. This aligns with a potential reversal if support holds. The chart creates an optimistic approach, projecting a bullish breakout from the current low, with the wave (5) extending into February–March 2026. However, the mixed indicators highlight risks if the downtrend resumes. My Prediction Based on the chart's technical setup, Kaspa appears to be at a critical inflexion point after a prolonged downtrend, with signs of exhaustion and a potential bullish reversal. The Elliott Wave count and buy signal at the "Area of Interest" suggest accumulation around 0.04–0.05 USDT, setting up for an impulse higher. If price holds above the recent low (0.0236–0.0382 USDT) and breaks above wave (3) resistance (~0.0786 USDT), it could confirm the uptrend. Short-Term (Next 1–3 Months, into Q1 2026): Bullish, targeting ~0.06–0.10 USDT (Fib extensions and wave (5) projection). This matches recent sentiment for near-term gains. Medium-Term (2026): If the reversal holds, potential for 0.20–0.50 USDT, driven by tech upgrades (e.g., ZK, DagKnight, vProgs) and listings. This aligns with broader predictions of 0.50–0.80 USDT. Long-Term (2027–2028): Highly bullish if adoption grows (e.g., dApps, RWA integration, high TPS/hashrate). Targets could reach 1–5 USDT or higher, based on power-law growth models and comparisons to other L1s like SOL, BNB & ETH. Risks include a breakdown below ~0.04 USDT, which could lead to further downside (e.g., 0.02 USDT), especially if Bitcoin weakens or network metrics (e.g., hashrate at 630 PH/s) falter. Crypto is volatile—this is not financial advice; consider market conditions and DYOR. I am not an advisor just a Kas Maxi sharing my personal views for fun