
JUP
Jupiter
| تریدر | نوع سیگنال | حد سود/ضرر | زمان انتشار | مشاهده پیام |
|---|---|---|---|---|
No results found. | ||||
Price Chart of Jupiter
سود 3 Months :
سیگنالهای Jupiter
Filter
Sort messages by
Trader Type
Time Frame

Goldfinch_song
سیگنال خرید قوی JUP: فرصت بازگشت به میانگین پس از سقوط شدید (آیا کف قیمتی تشکیل شده است؟)
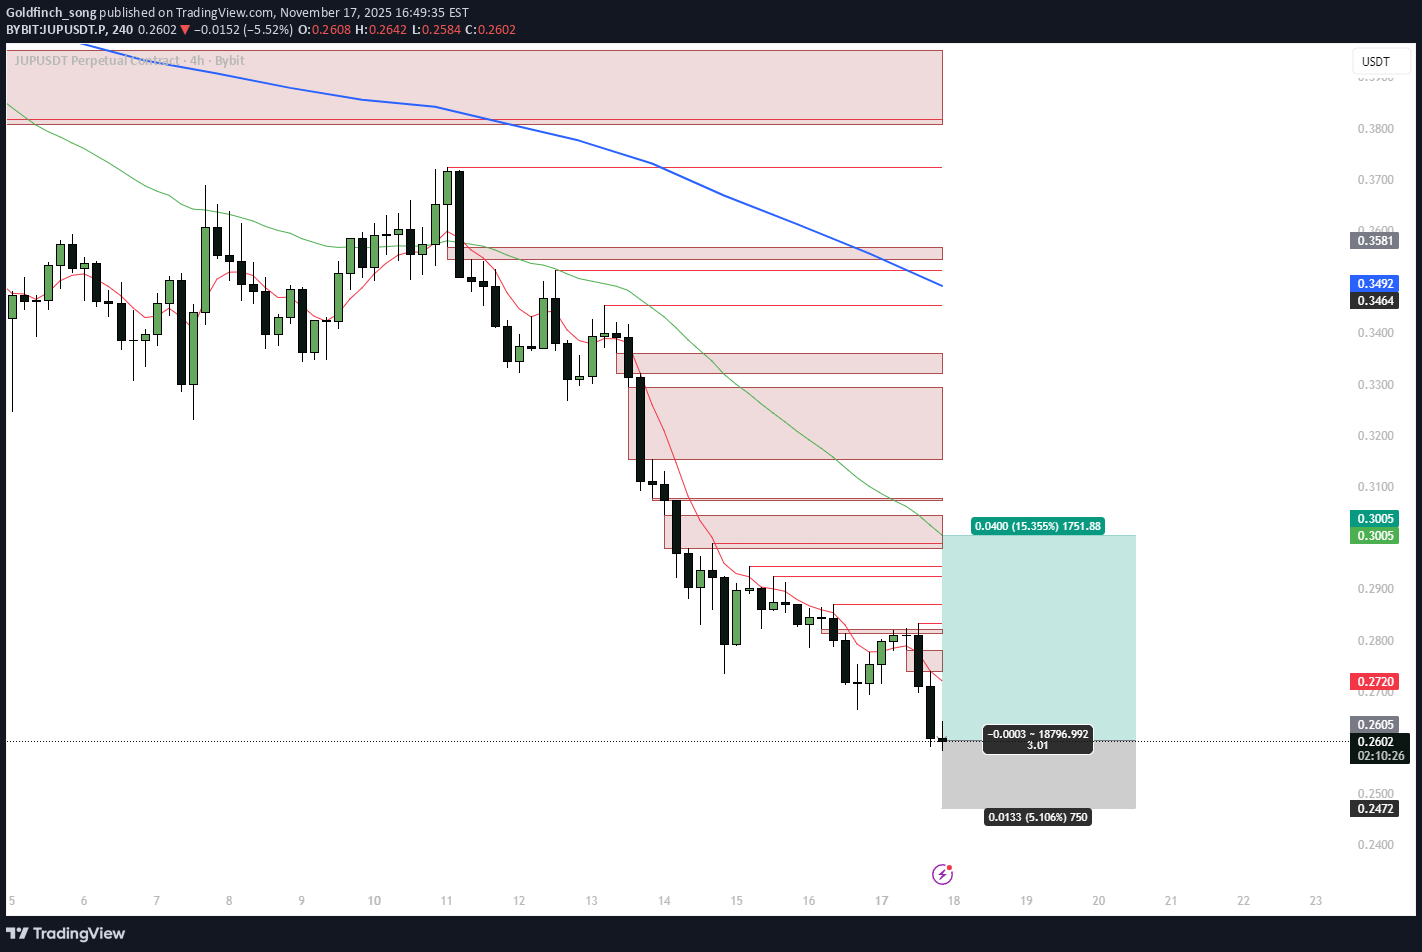
JUPUSDT (Bybit) is trading near the lower end of its autumn range after a clean 4H downtrend from the 0.33–0.34 area. My 4H EMA deviation system has just printed a long signal as price extends away from the higher-timeframe averages. Technical setup (#4h) Price is below the 4H, 1D and 3D EMAs, with Dev% on multiple TFs showing strong downside extension (high single-digit / low double-digit % below the mean). We’ve just tagged a new local low around 0.25–0.26 with several multi-TF exhaustion markers firing near the lower ATR band. Overhead, the first liquidity pocket and resistance cluster sits around 0.26–0.28, with a larger supply/FVG zone and EMA confluence around 0.30–0.31. I treat this move as a late leg of the existing selloff and a potential mean-reversion opportunity back into the 4H EMA ribbon and prior supply. Strategy stats (this 4H deviation system) Backtest/forward sample: 33 trades, all longs Win rate: ~69.7% (23 wins / 10 losses) Avg PnL per trade: ~+4.1% Avg winning trade: ~+10.0% Avg losing trade: ~−9.6% Avg bars in trade: ~34 bars on #4h (≈ 5–6 days), with losers typically lasting longer than winners The system is built to catch oversold 4H swings with a relatively high hit rate and symmetric win/loss size, so sticking to invalidation levels is crucial. Trade plan (swing 3–7 days) Entry: around 0.26 (current long triggered in this area). Main target: 0.300–0.305 — previous 4H supply zone and confluence with the EMA band. Stop / invalidation: below 0.247. A 4H close under this level would mean the current demand failed and opens the door toward deeper supports around 0.23–0.22. This setup offers roughly 3:1 R:R from entry to the 0.30–0.305 target. Fundamental snapshot (Jupiter) Jupiter is the main DEX aggregator and perps venue on Solana. Over the last 30 days: Protocol fees / revenue are roughly $78.8M / $19.0M, showing a robust on-chain business across spot + perps. Governance approved a burn of ~130M JUP (~4% of circulating supply) from the Litterbox Trust (vote passed on 4 Nov 2025). Token unlocks continue on a scheduled basis (e.g. ~53.47M JUP on 28 Oct 2025), keeping some overhang in the short term. November 2025: launch of the Jupiter ICO / launchpad platform, adding another product line on top of swaps and perps. Saros DLMM integration is aimed at deeper liquidity for JUP and ecosystem pairs. Net read: cash-flow-positive DeFi infra with upcoming product catalysts, but short-term price still sensitive to unlocks and derivatives positioning — a good environment for volatile swings and mean-reversion trades. Alternative scenario If unlock / derivative selling pressure accelerates and JUP starts closing 4H candles below 0.247, I’ll consider this idea invalid and look for a new deviation long lower in the 0.23–0.22 zone rather than averaging down. Not financial advice — this is my structured 4H EMA deviation long on JUP, combining system stats with current Jupiter fundamentals.

VIPROSE
جپیتر در نقطه انفجار مثلث نزولی: آیا رشد انفجاری به ۱.۲۶ دلار ممکن است؟
Jupiter is holding above the lower boundary of the descending triangle on the 2-day timeframe🧐 A successful breakout from this compression zone could drive the price toward targets at $0.45, $0.60, $0.76, $0.87, $1.00, $1.15, and $1.26🎯

tradecitypro
تحلیل JUP: آیا خرسها کف حمایتی کلیدی را میشکنند؟ (پیشبینی نزولی)
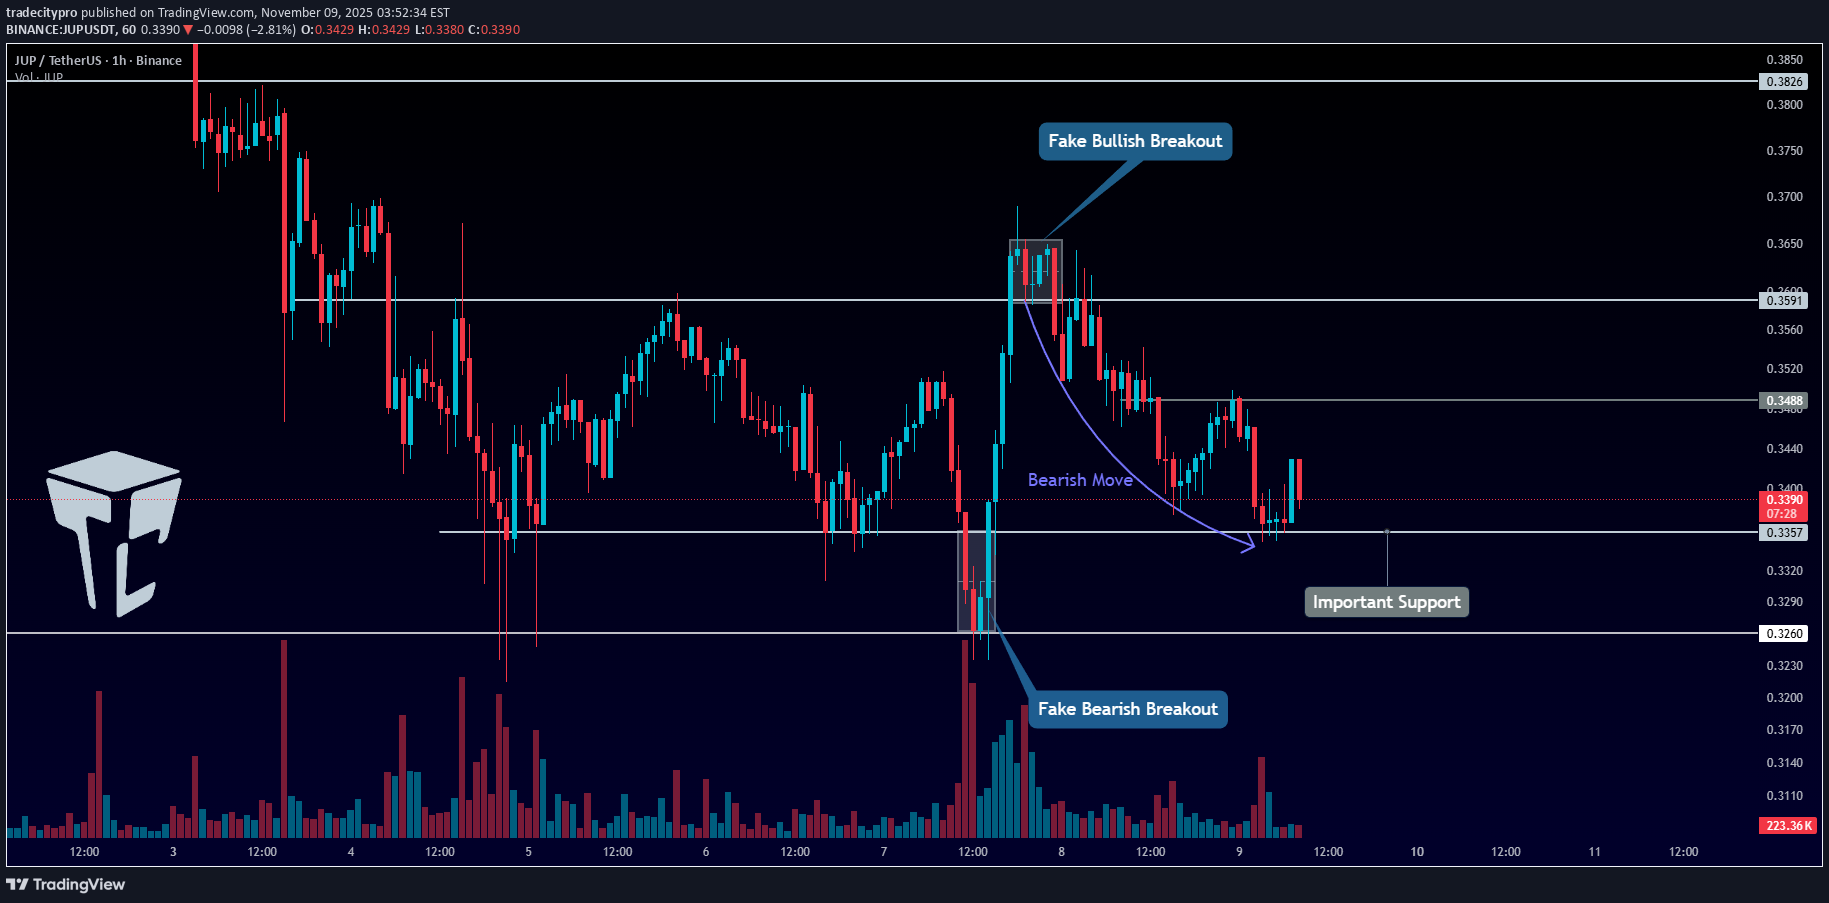
👋 Welcome to TradeCity Pro! In this analysis, I want to review the JUP coin,one of the projects in the Solana ecosystem, with a market cap of $1.09 billion, currently ranked 64th on CoinMarketCap. ⏳ 1-Hour Timeframe On the 1-hour timeframe, this coin has formed a structure between the 0.3357 and 0.3591 levels, and has already faked out the range once to the upside and once to the downside. 🔍 After the fakeout to the upside, the price made a downward move toward the 0.3357 support, and as you can see, the selling volume in the red candles has been very strong. 🎲 At the moment, I believe the sellers have much more control in the market compared to the buyers, so the probability of a further downward move is higher for now. 📈 In that case, we can open a short position if the 0.3357 level breaks. One important thing to note is that the zone between 0.3260 and 0.3357 is a very strong support area where many buyers are active. 📊 So if buying volume enters this range, we may see a shift in market strength. In that case, breaking the 0.3488 level could give us a long position. 📈 The main long trigger for this coin is at 0.3591. However, since the price has already faked this level once, it's better to wait for a reaction to refine the exact breakout point. 📝 Final Thoughts Stay calm, trade wisely, and let's capture the market's best opportunities! This analysis reflects our opinions and is not financial advice. Share your thoughts in the comments, and don’t forget to share this analysis with your friends! ❤️

EyeDoctor
تحلیل تکنیکال JUP: آیا ریزش 5 موجی به پایان رسیده؟ سطوح فیبوناچی و هدف 0.8!
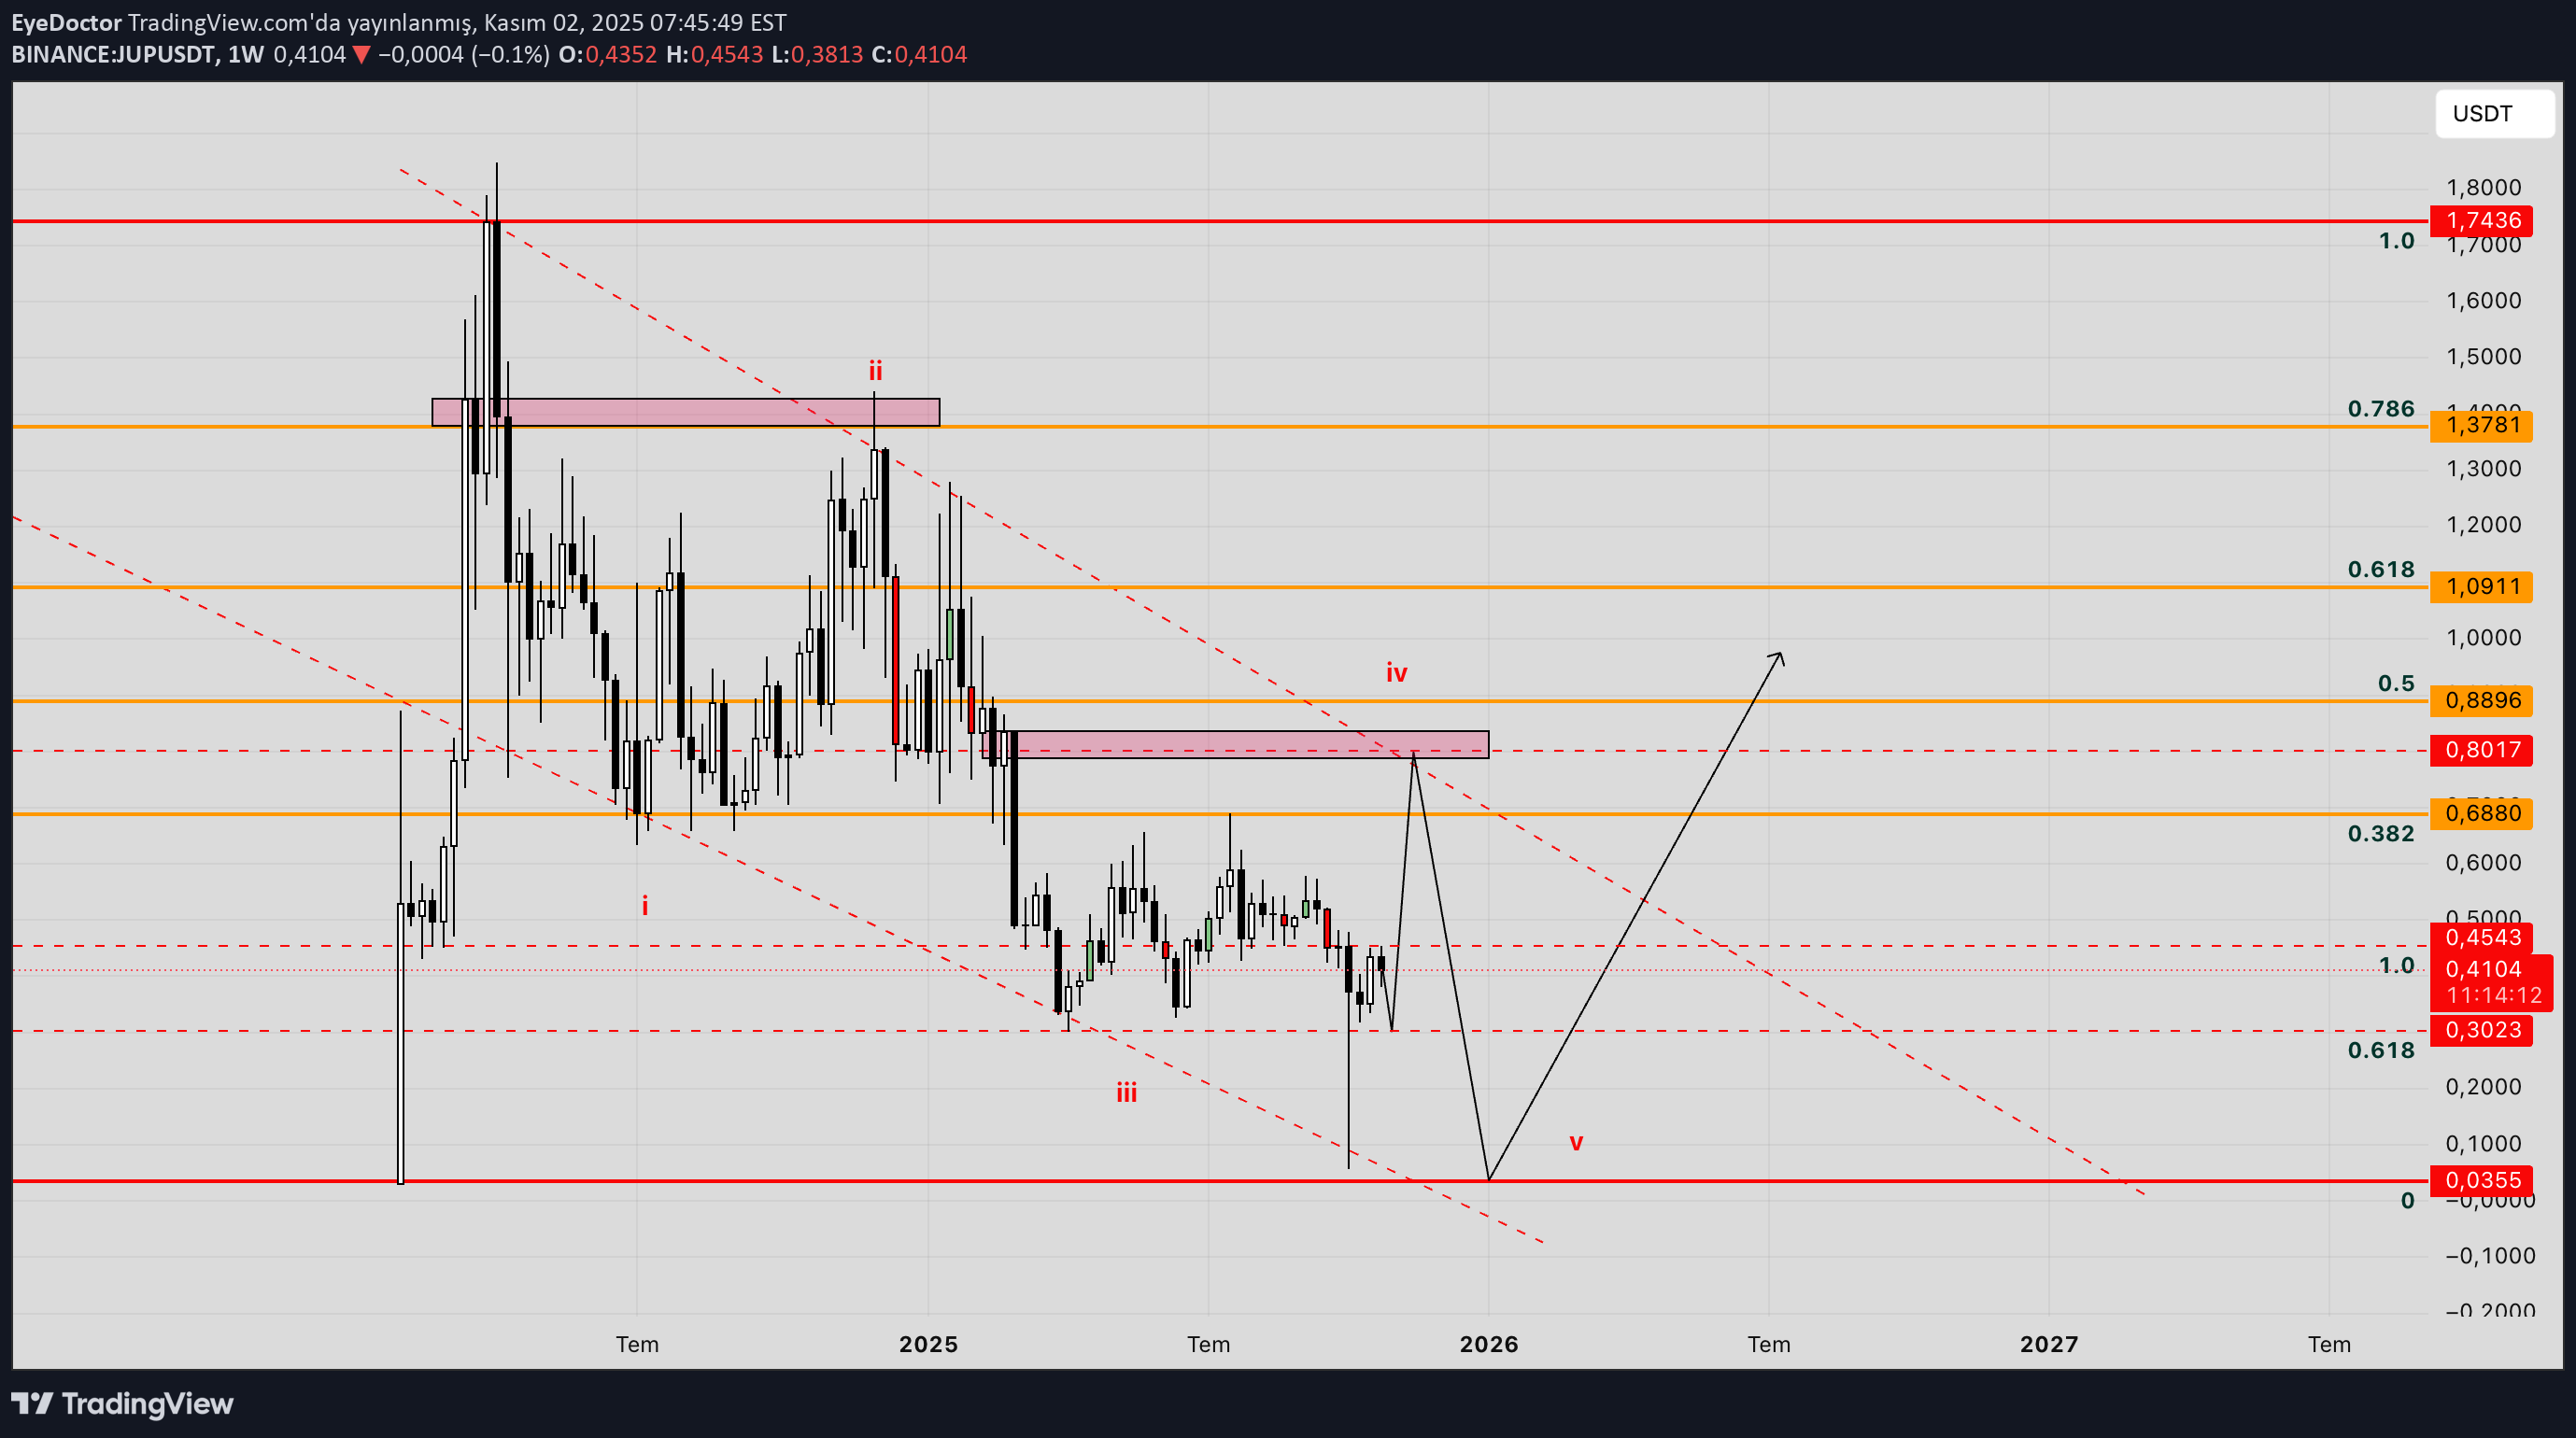
,,,,, Elliot 5 wave decline Fibonacci levels 0.3-->0.8 ? ,,,,,

milad-bit24
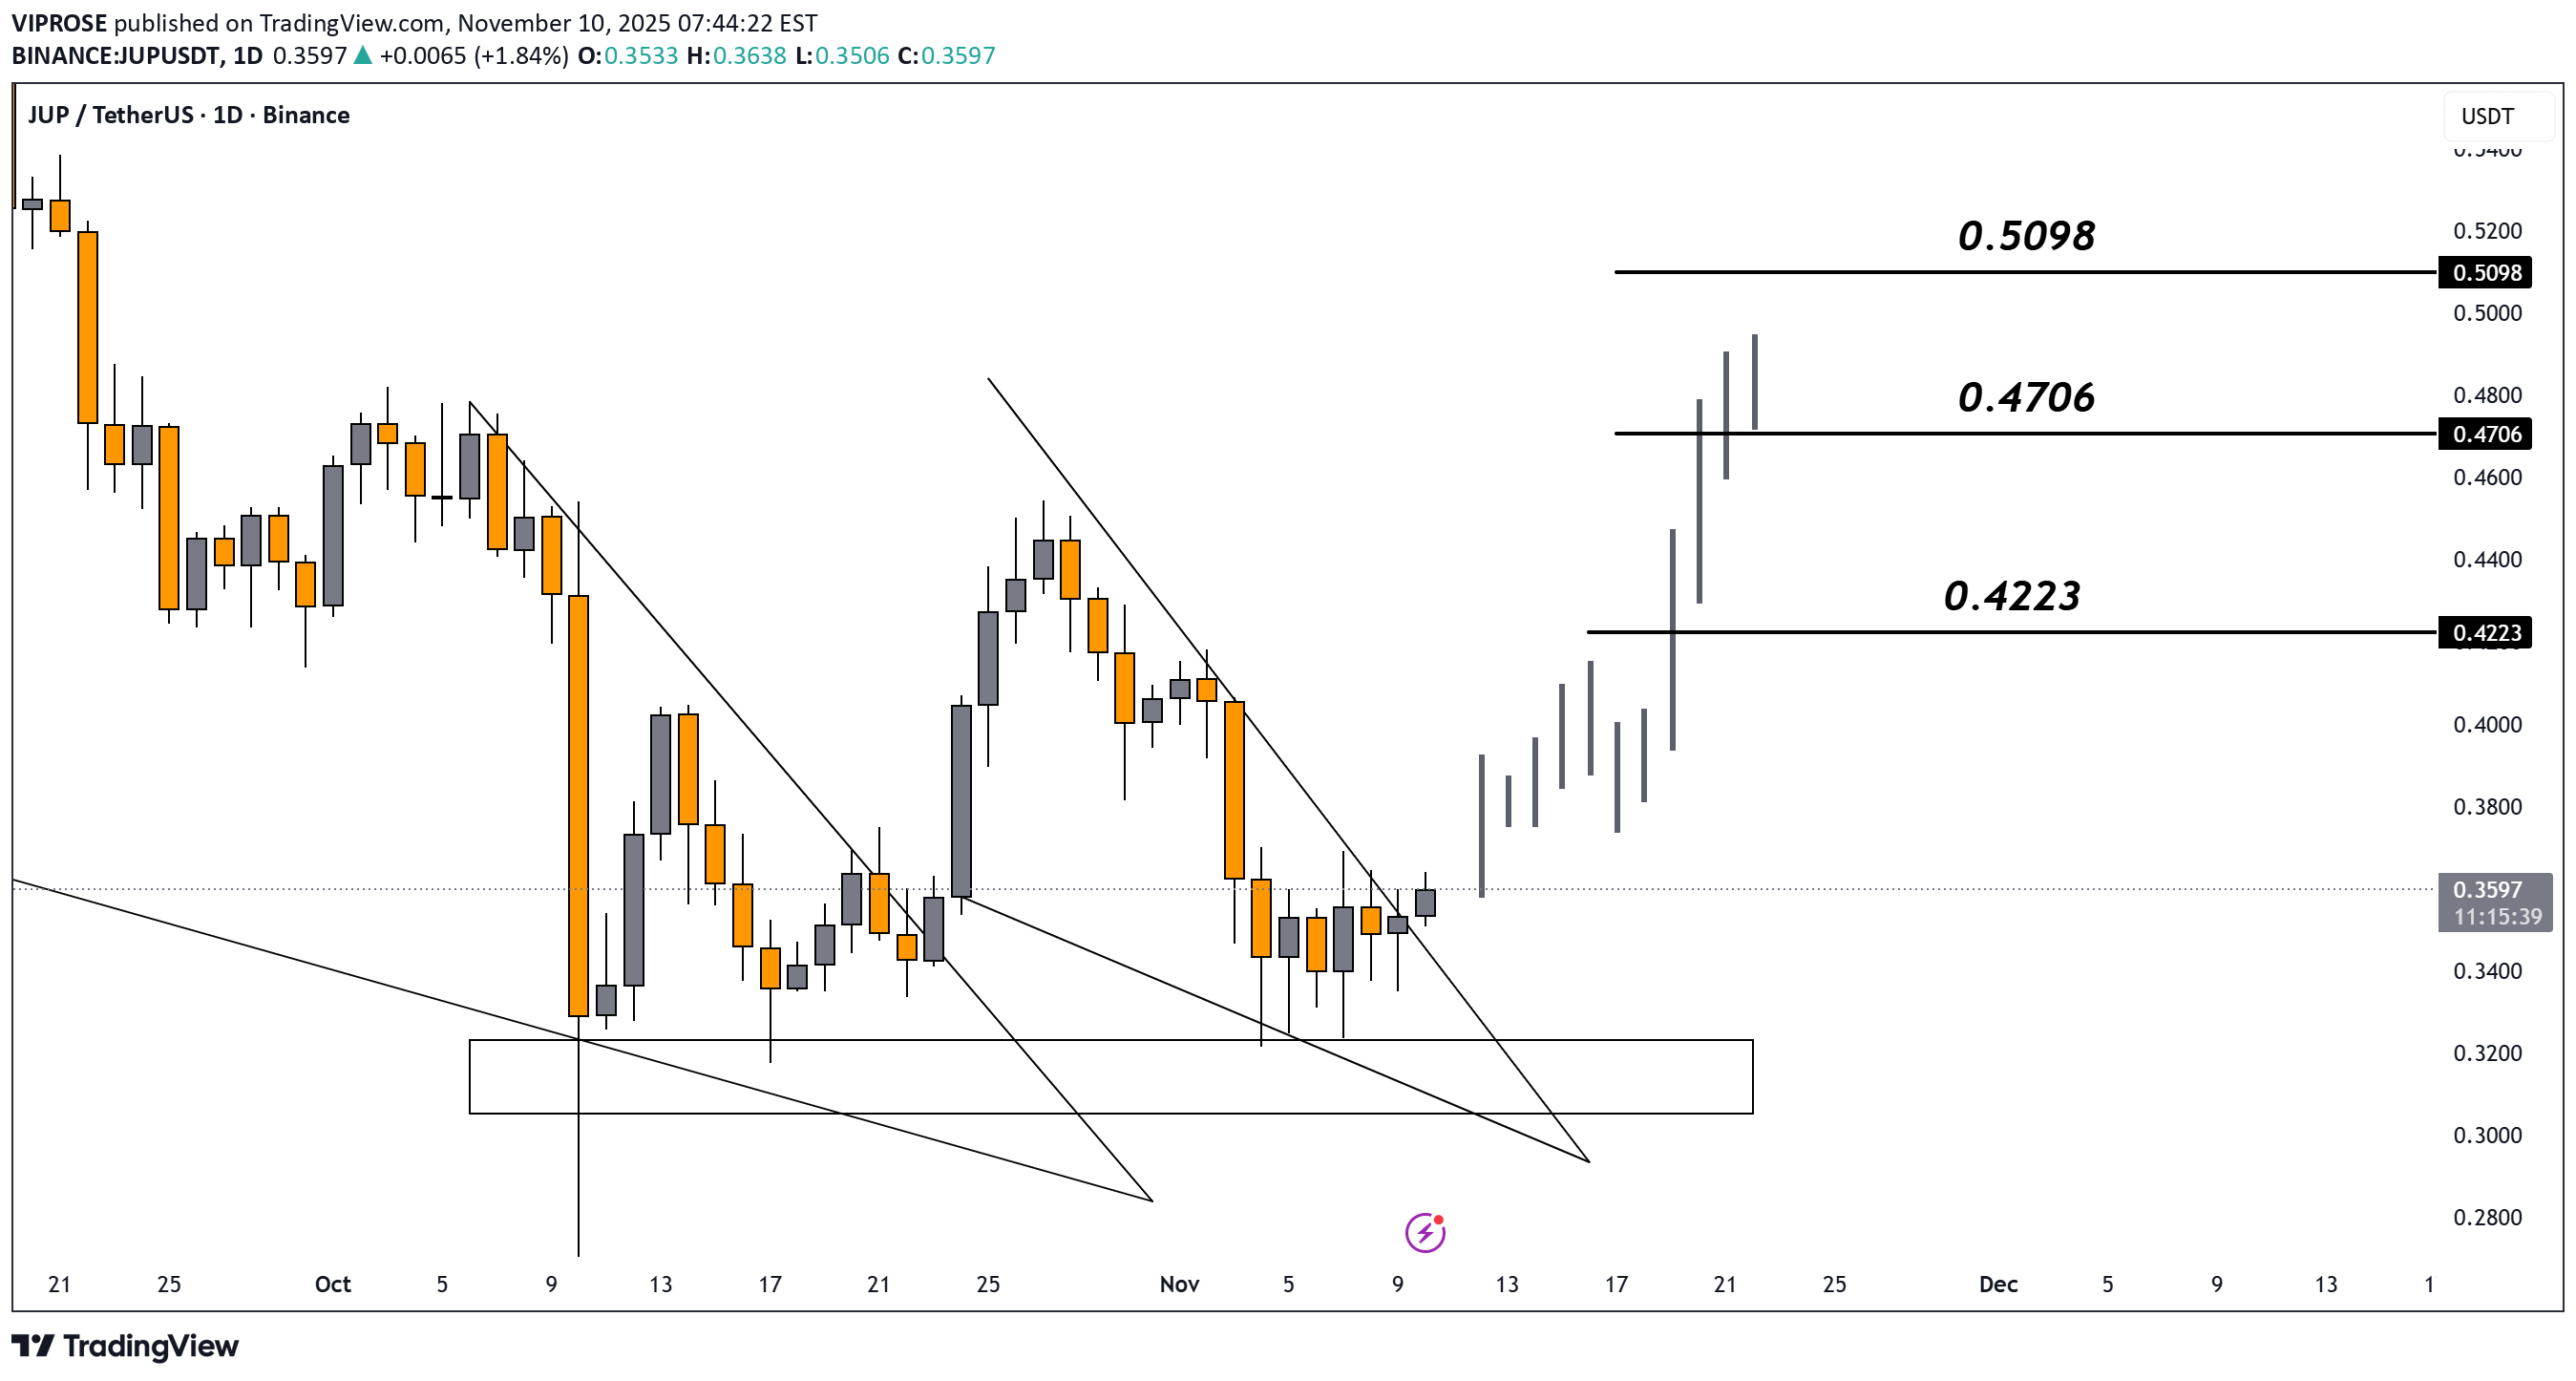
قیمت جوپیتر (JUP) به ۰.۴۸ دلار رسید: آیا این آخرین مانع قبل از صعود به اوجهای جدید است؟
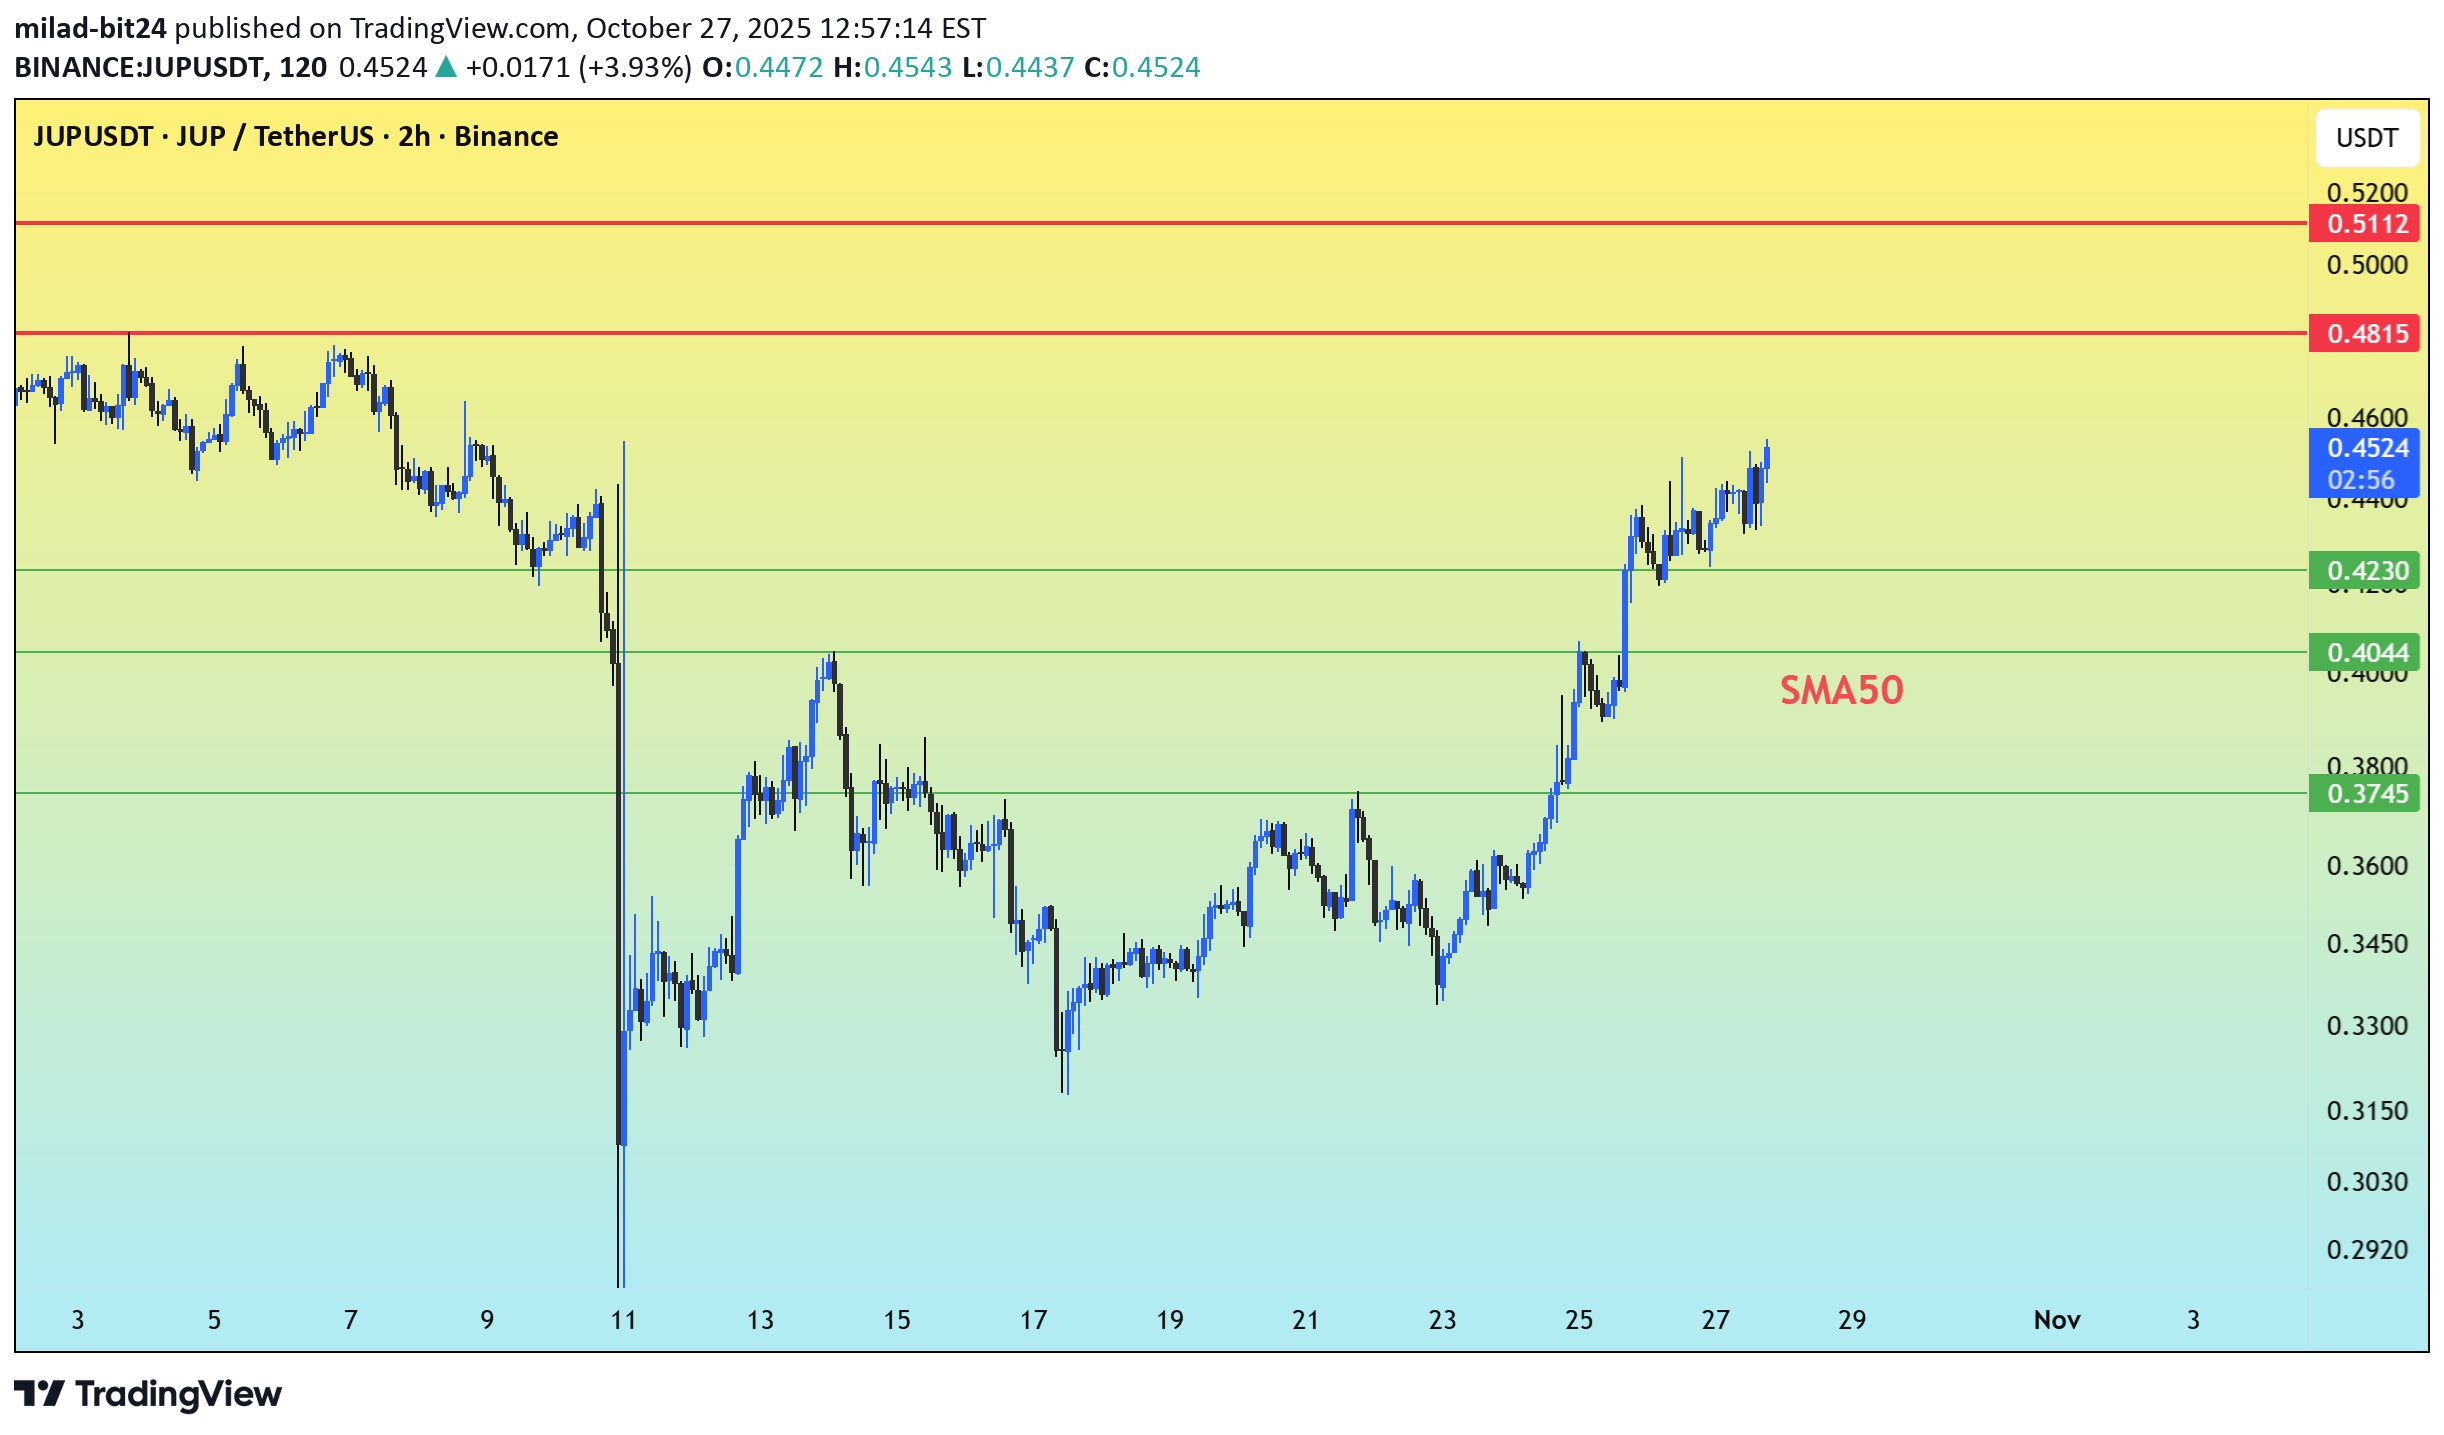
The asset, after a sharp sell-off on October 11th, has since shown a strong recovery with a rounded bottom and upward trend. It is trading well above its SMA50, indicating strong short-term bullish momentum. Support Levels: 1. Immediate Support: $0.4230 - Crucial for sustaining the recovery phase. 2. Major Support: $0.4044 - Acts as support if immediate level fails; falling below signals loss of momentum. 3. Key Mid-Range Support:*$0.3745 - Critical to avoid reversal into consolidation zone. Resistance Levels: 1. Primary Resistance: $0.4815 - Important hurdle; breaking this confirms recovery. 2. Next Major Target: $0.5112 to $0.5200 - Key resistance area following a break above $0.4815. Bullish Scenario: Holding $0.4230 supports likely breakout above $0.4815, targeting $0.51-$0.52. Bearish Scenario: Breakdown below $0.4230, especially with high volume, may test support at $0.4044 and prompt a correction. Key Action: Look for breakout above $0.4815 to confirm next upward move.

Bithereum_io
تحلیل جنجالی جپ (JUP): آیا مثلث نزولی میشکند؟ اهداف شگفتانگیز پیش رو!
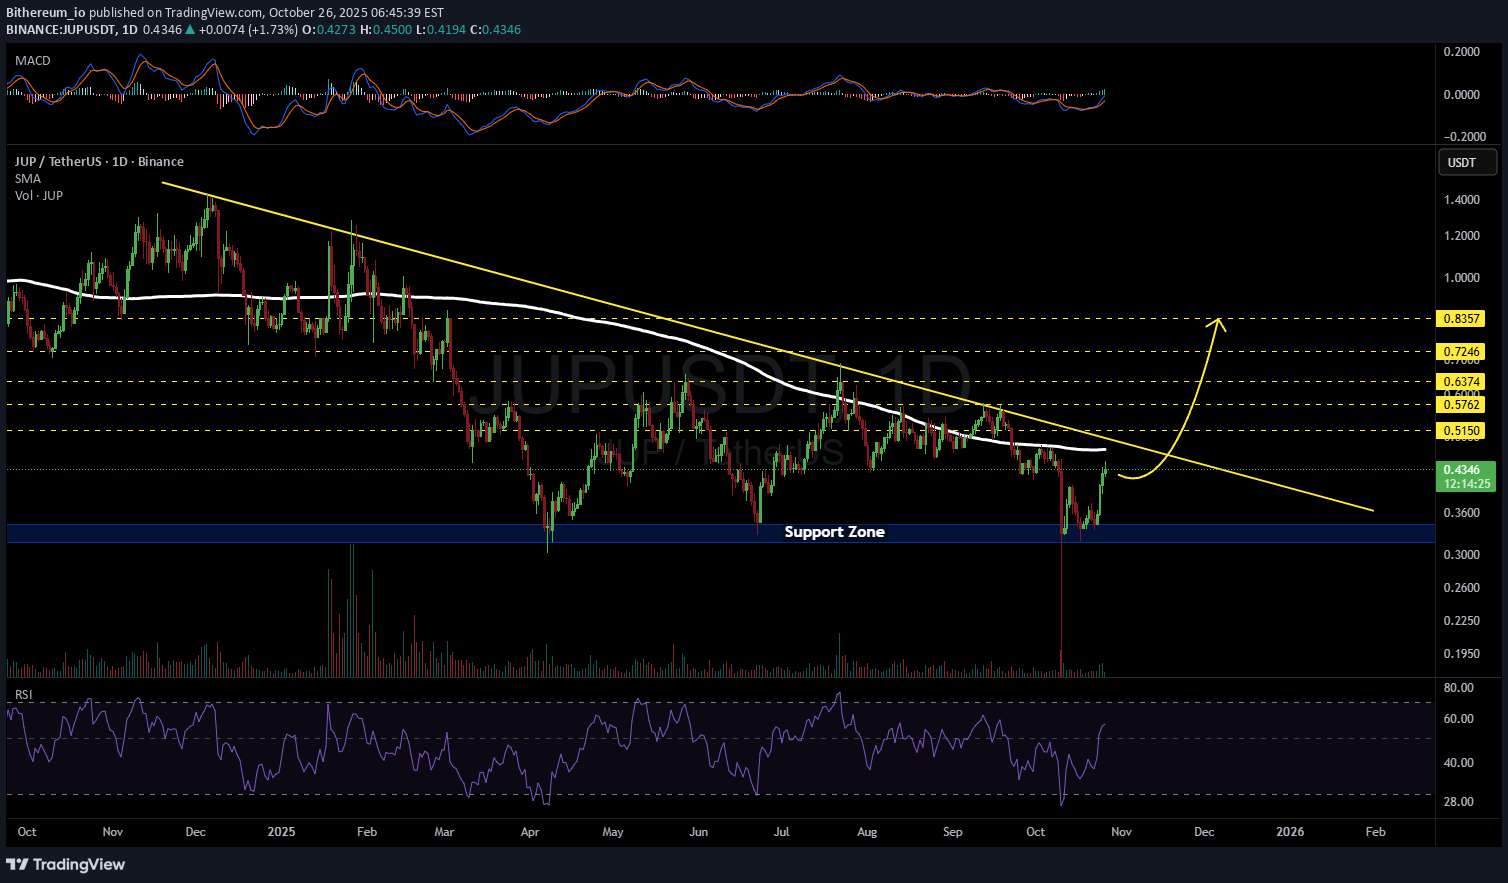
#JUP is moving inside a descending triangle on the daily chart. In case of a breakout above the triangle resistance and the daily SMA200, the potential targets are: 🎯 $0.5150 🎯 $0.5762 🎯 $0.6374 🎯 $0.7246 🎯 $0.8357 ⚠️ Always remember to use a tight stop-loss and maintain proper risk management.

Alpha-GoldFX
سیگنال انفجار صعودی JUPUSDT: آیا سقوط متوقف شده و جهش ۹۰ درصدی در راه است؟
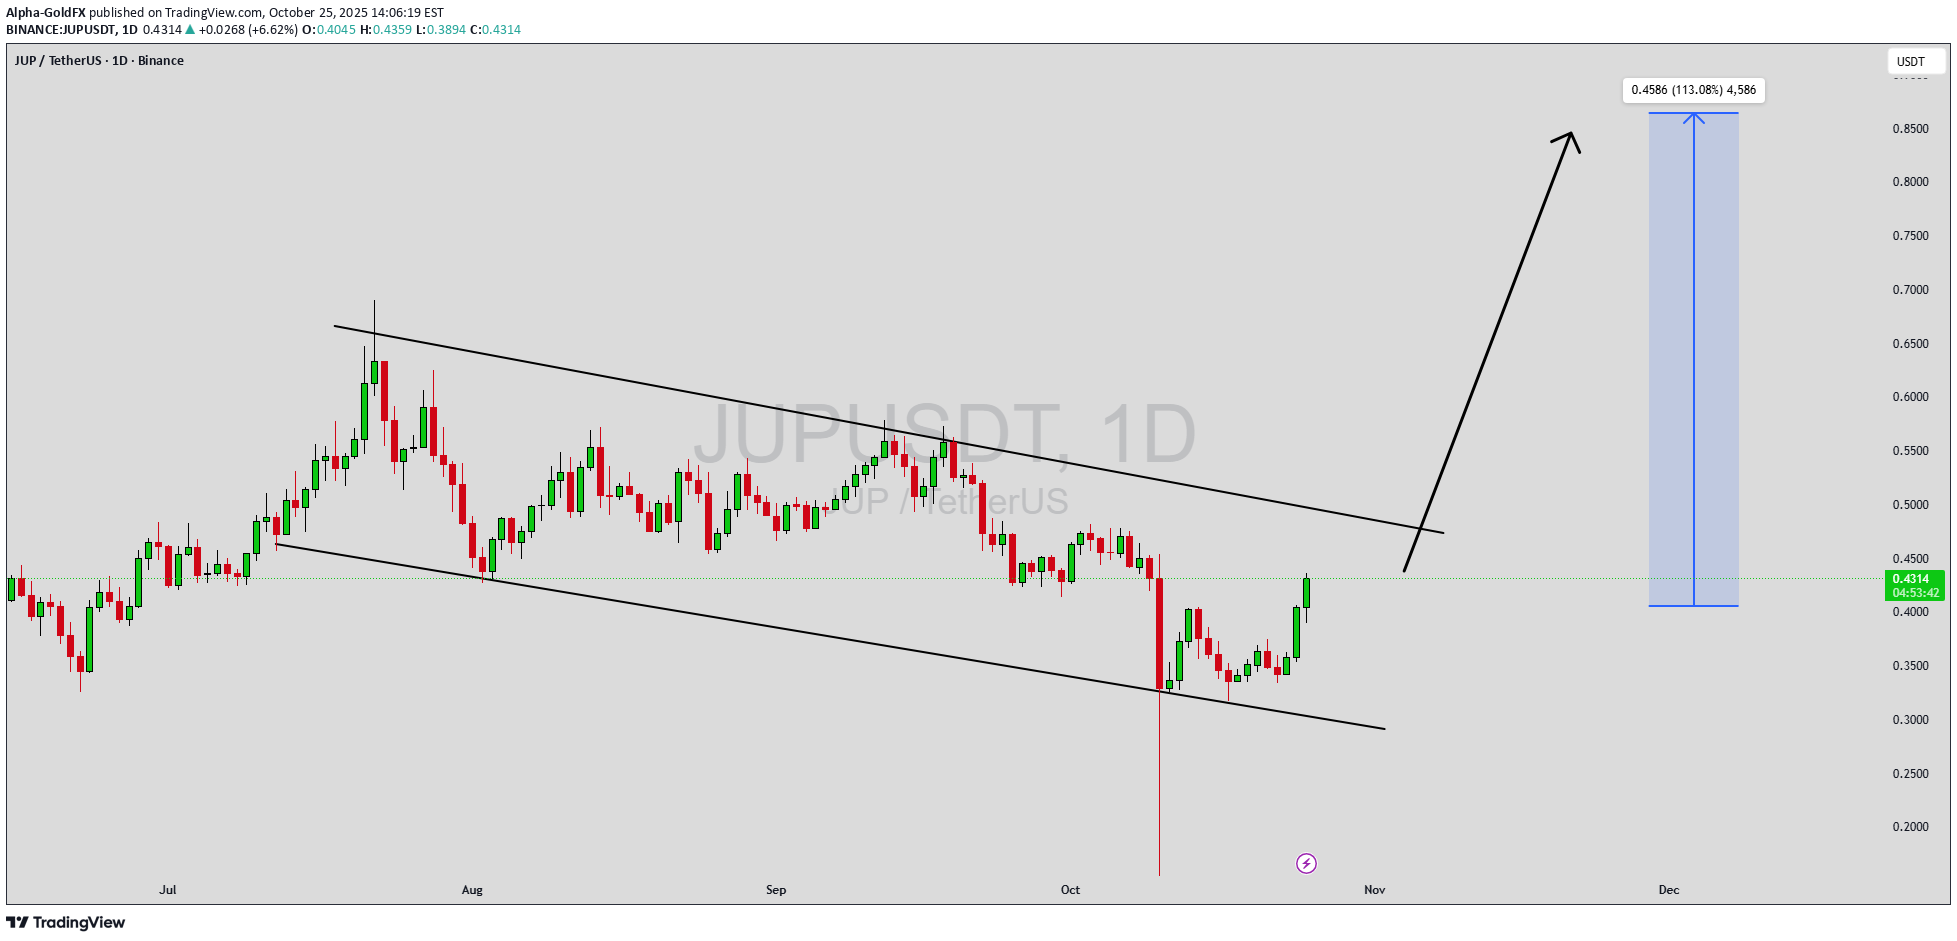
JUPUSDT is showing a falling wedge pattern, a strong technical indicator that often signals the end of a downtrend and the beginning of a bullish reversal. The price action within the wedge shows narrowing lows, suggesting that selling pressure is diminishing while buyers are gradually gaining strength. Once the breakout occurs above the wedge resistance, it could mark the start of a sharp upward movement. The technical setup looks favorable, with a clear potential for a significant bullish breakout in the coming sessions. The trading volume remains steady and positive, reflecting growing accumulation from traders anticipating an upward move. As investor sentiment shifts toward optimism, JUPUSDT could experience increased demand, potentially triggering the expected 90% to 100%+ gain. Volume confirmation at the point of breakout will be a key factor to watch, as strong volume often validates the strength of a breakout and the sustainability of the rally that follows. Market participants are increasingly paying attention to JUPUSDT due to its combination of solid technical structure and renewed buying interest. The falling wedge pattern aligns with broader bullish market momentum, hinting that this could be one of the coins to watch for a strong mid-term rally. As long as support levels hold and momentum builds, JUPUSDT could soon transition into a full bullish phase, rewarding those positioned early. ✅ Show your support by hitting the like button and ✅ Leaving a comment below! (What is You opinion about this Coin) Your feedback and engagement keep me inspired to share more insightful market analysis with you!

CryptoNuclear
جـوپ (JUP) در نقطه انفجار: صعود بزرگ یا سقوط آزاد؟
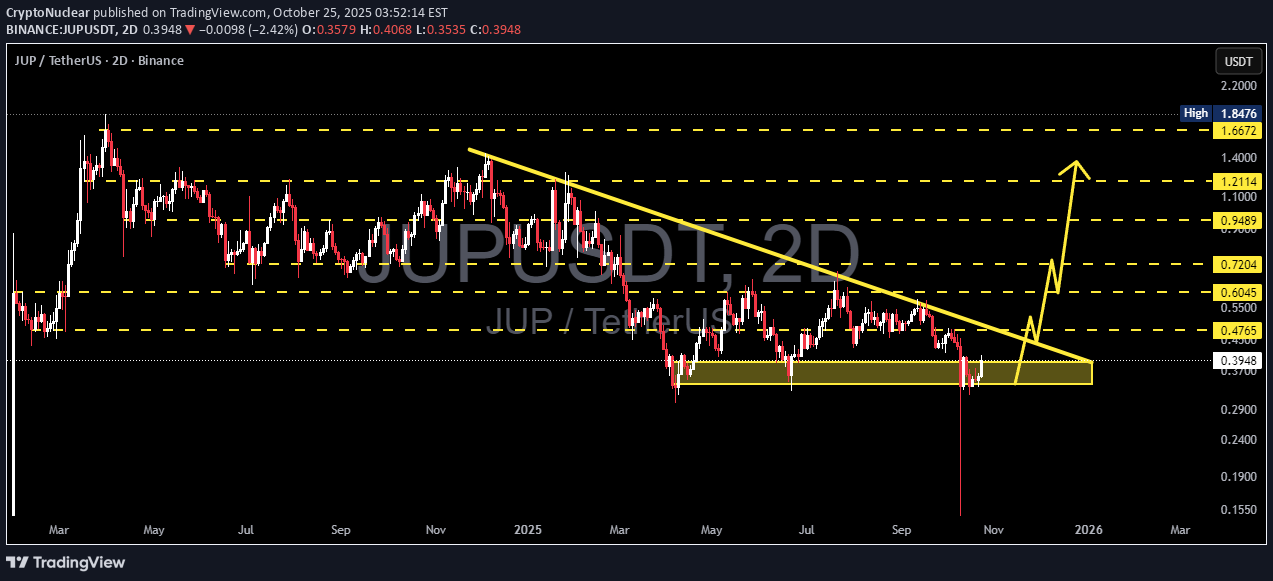
JUP is now standing at a critical crossroads, where the next few candles could decide its larger trend. After months of being trapped inside a descending triangle, price is tightening within a compression zone that’s reaching its breaking point — a massive move is loading. The yellow support zone between 0.33–0.40 USDT has acted as a strong defensive wall for buyers, repeatedly absorbing sell pressure — even forming a deep liquidation wick, suggesting aggressive demand from buyers at lower levels. However, the descending trendline (series of lower highs) continues to cap every rally attempt. The battle between persistent sellers and patient buyers is nearing maximum pressure, and whichever side breaks first will dictate the next major leg. --- 📈 Bullish Scenario If price breaks and closes above the descending trendline and 0.4765 USDT with convincing volume, it would mark a structural shift to the upside. Potential upside targets include: 0.6045 USDT → first confirmation target 0.7204 – 0.9489 USDT → momentum zone if follow-through continues 1.2114 to 1.6672 USDT → extended target zone in case of euphoria Such a breakout could signal the start of a trend reversal — especially if Bitcoin remains stable and altcoin sentiment improves. --- 📉 Bearish Scenario On the flip side, a clean breakdown below 0.33 USDT with volume would confirm continuation of the bearish structure, targeting: 0.29 – 0.30 USDT → short-term support 0.15 – 0.19 USDT → extreme liquidity zone (previous liquidation wick) A decisive breakdown may signal smart money distribution and trigger a new capitulation wave across the market. --- 🔍 Technical Structure Descending Triangle: Lower highs pressing down into flat support — a pattern of price compression that often precedes a sharp directional breakout. Long Wick Below Support: Indicates a liquidity sweep or stop-hunt, often a precursor to a sharp rebound if confirmed by bullish follow-through. Volume & 2D Candle Close: Key elements to validate either breakout or breakdown — without volume, moves risk being fakeouts. --- 💡 Conclusion JUP is in a high-stakes battleground between bulls and bears — and volatility is brewing. A breakout above 0.4765 USDT could ignite a strong bullish reversal, while a breakdown below 0.33 USDT could trigger a deeper continuation wave. For disciplined traders, this isn’t the time to guess — it’s the time to wait for confirmation. The next breakout will decide who wins this compression war. --- #JUPUSDT #JUP #CryptoBreakout #TechnicalAnalysis #TradingView #DescendingTriangle #AltcoinSetup #SupportResistance #CryptoMarket #TrendReversal #ChartPattern #LiquidityTrap

philrego
بهترین زمان برای خرید بلندمدت ارز دیجیتال: با اهرم سنگین پول پارو کنید!
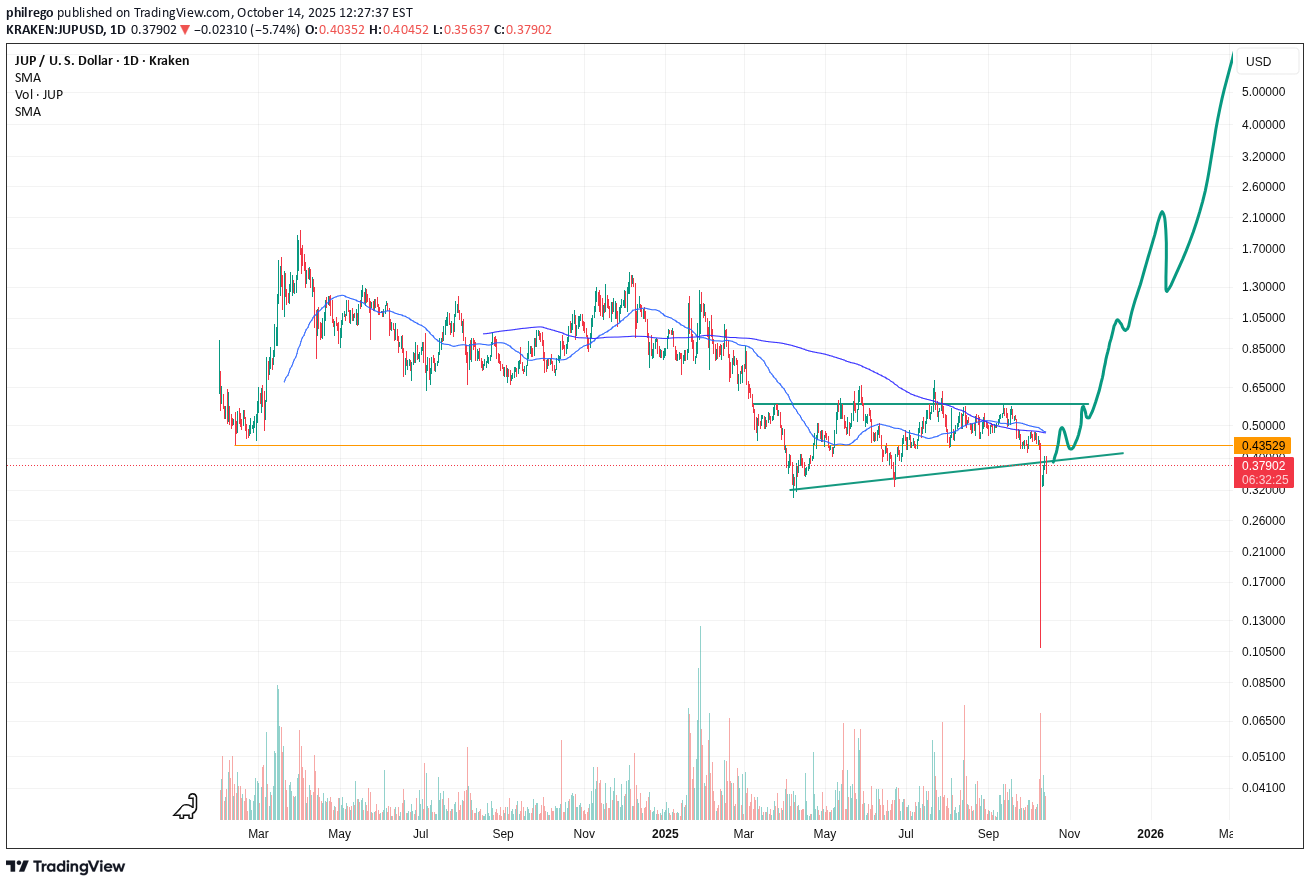
LONG JUP now! I don't mean buy, LONG it. Use 5x-10x leverage. Literally every LONG has gotten stopped out. Funding is very NEGATIVE. You will get PAID to LONG. This is the perfect time to take out a long. Alt sentiment is terrible. BTC dominance is dangling on a cliff. The biggest rallies come after the biggest dips (like ETH in April). I haven't used leverage for a year, but this is such a perfect opportunity that I can't pass it up. Hold for the long term, target is $8. Trim at horizontal resistance and re-add a supports, or just sell everything in December.
philrego
خرید JUP در کف قیمت: فرصت انفجاری سولانا با پتانسیل رشد تا ۸ دلار!

This is the best app on Solana. Price has been decimated, sentiment has been wrecked. Fundementals have only gotton better. Medium cap alts have yet to pump. I wish I had money to buy more JUP here. This is very low risk/medium reward play. I still think there's a reasonable change it dips to $0.38 first, but it's not worth waiting when it's $0.45 now. If you want save 25% of what you can allocate and bid $0.38 and use the rest to buy now. Short term target $1.50 Medium/Long term: $8 Step up.I was clearly wrong but im still holding.
Disclaimer
Any content and materials included in Sahmeto's website and official communication channels are a compilation of personal opinions and analyses and are not binding. They do not constitute any recommendation for buying, selling, entering or exiting the stock market and cryptocurrency market. Also, all news and analyses included in the website and channels are merely republished information from official and unofficial domestic and foreign sources, and it is obvious that users of the said content are responsible for following up and ensuring the authenticity and accuracy of the materials. Therefore, while disclaiming responsibility, it is declared that the responsibility for any decision-making, action, and potential profit and loss in the capital market and cryptocurrency market lies with the trader.