
EyeDoctor
@t_EyeDoctor

What symbols does the trader recommend buying?
Purchase History
پیام های تریدر
Filter
EyeDoctor
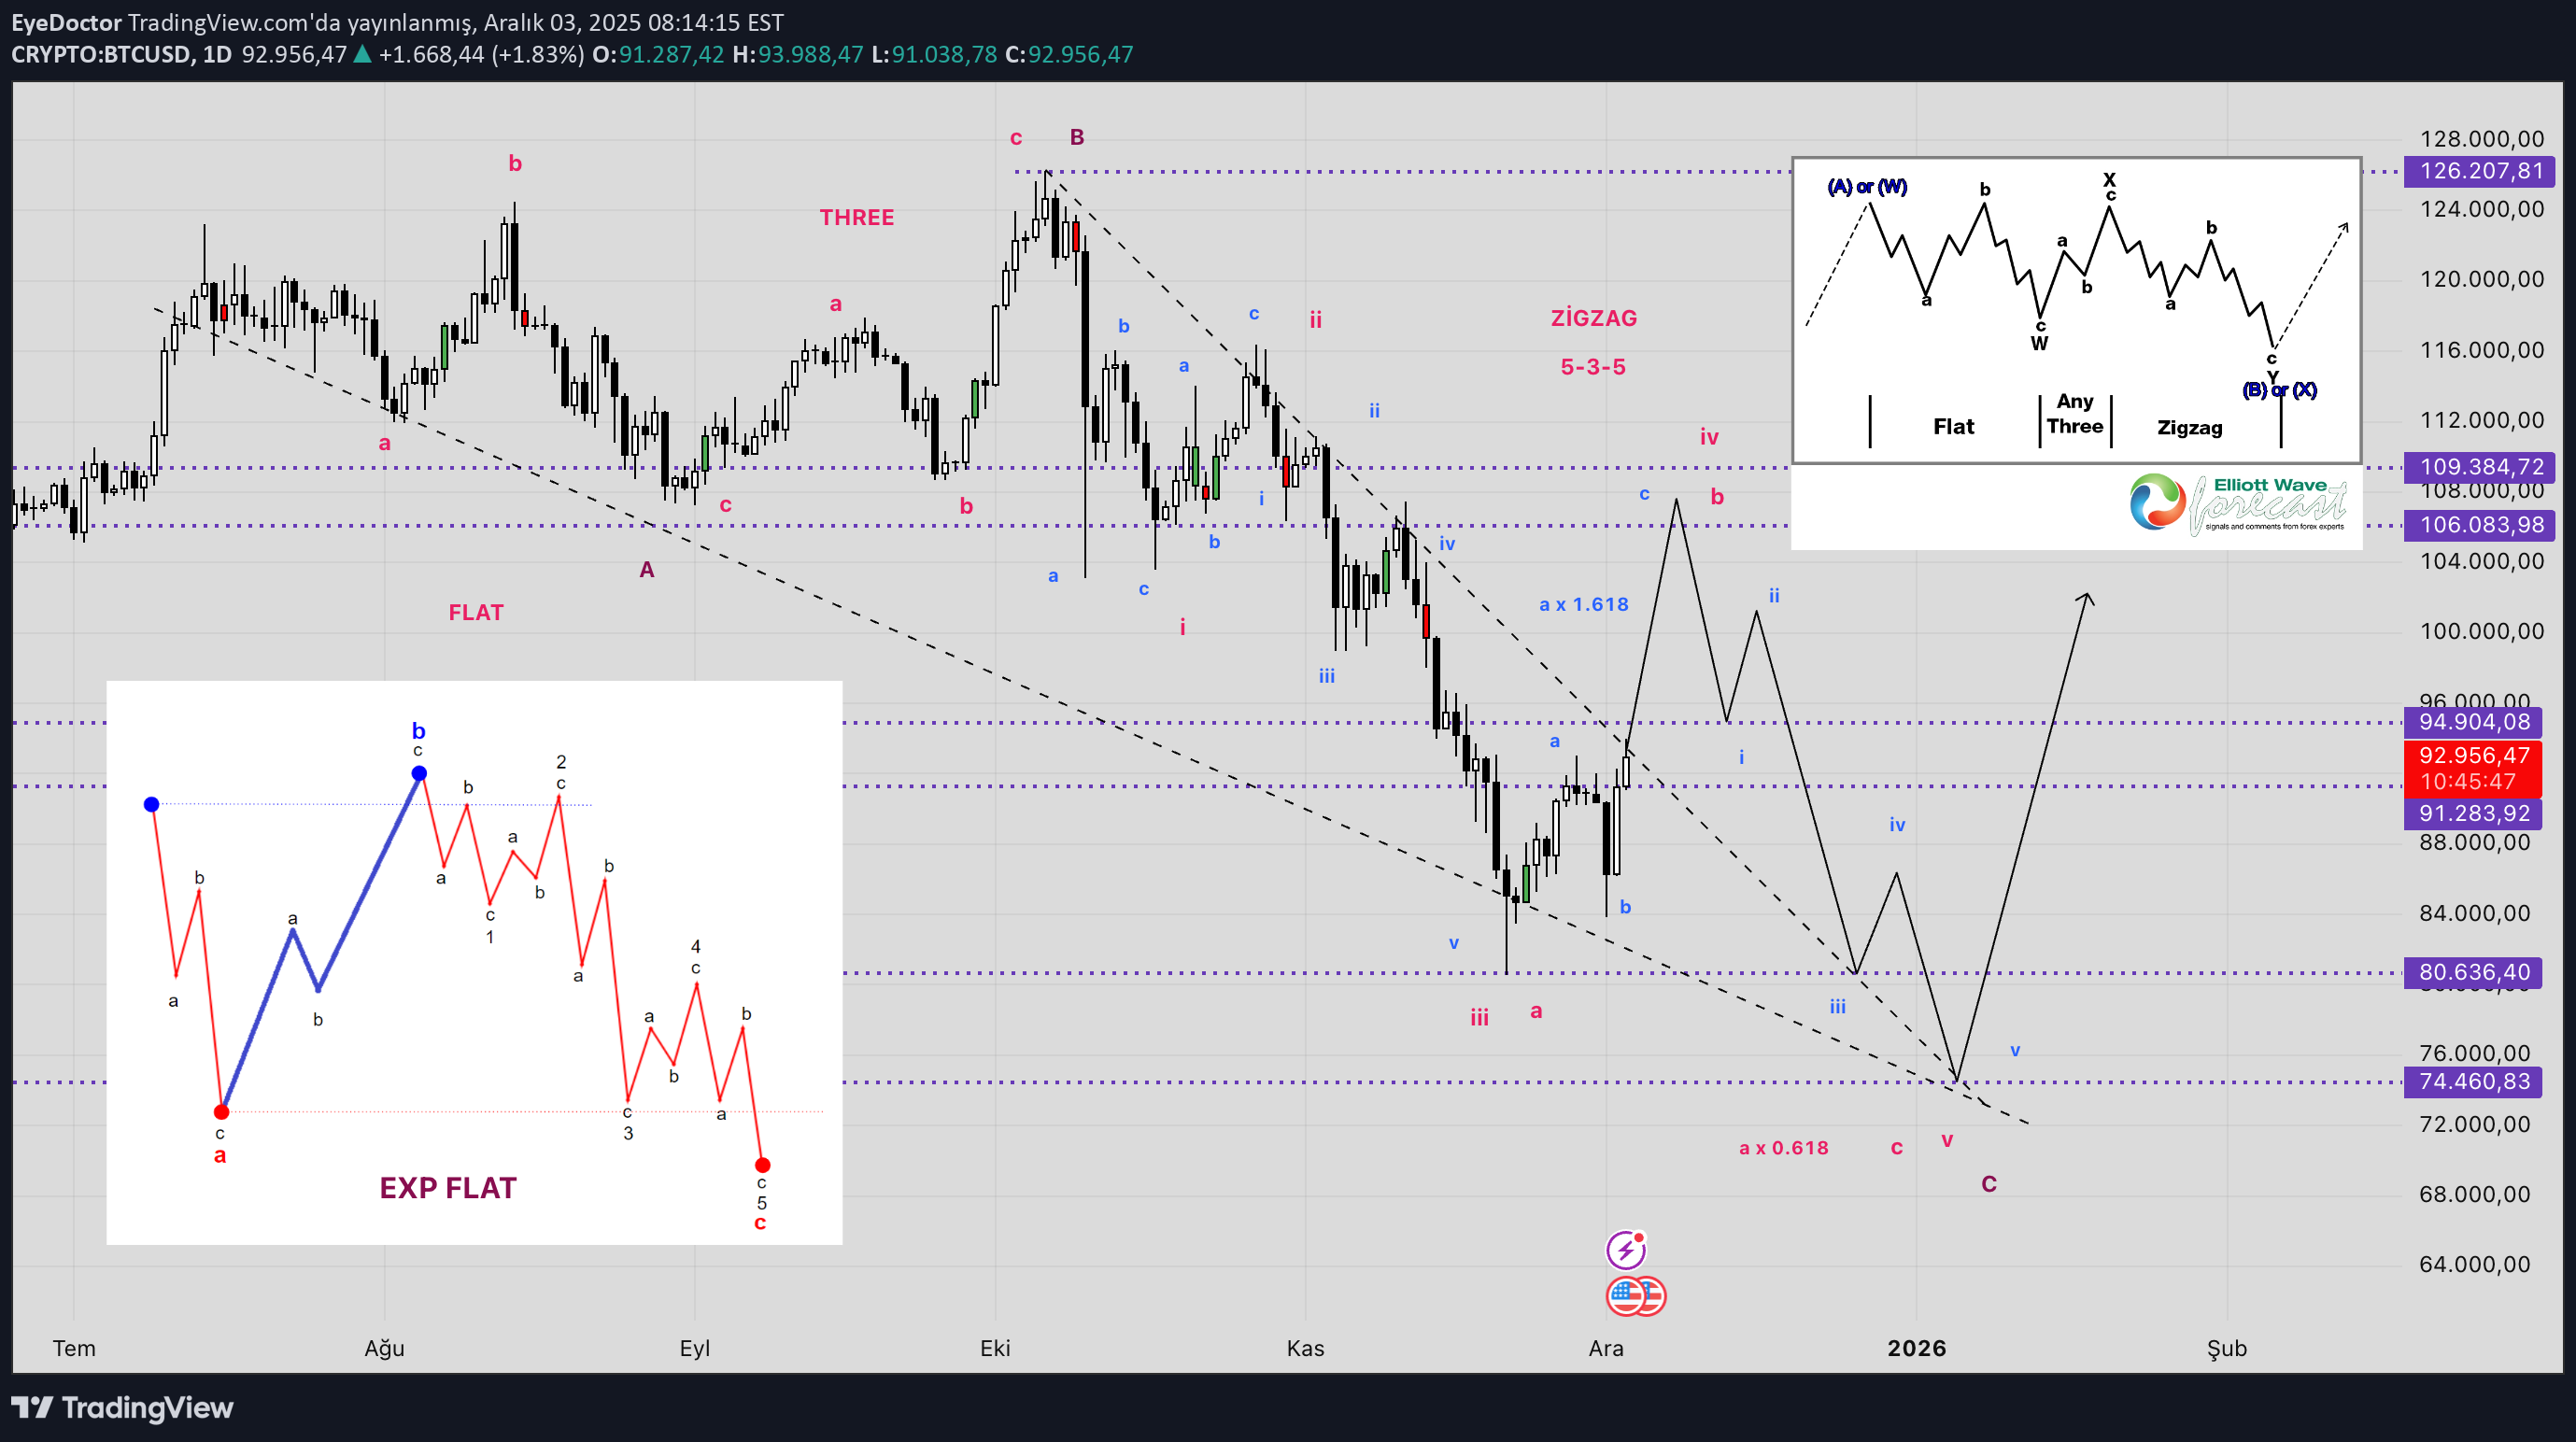
بیت کوین گیر افتاده! راز پشت نوسان 85 تا 90 هزار دلاری و پایان مهلت بزرگ 26 دسامبر
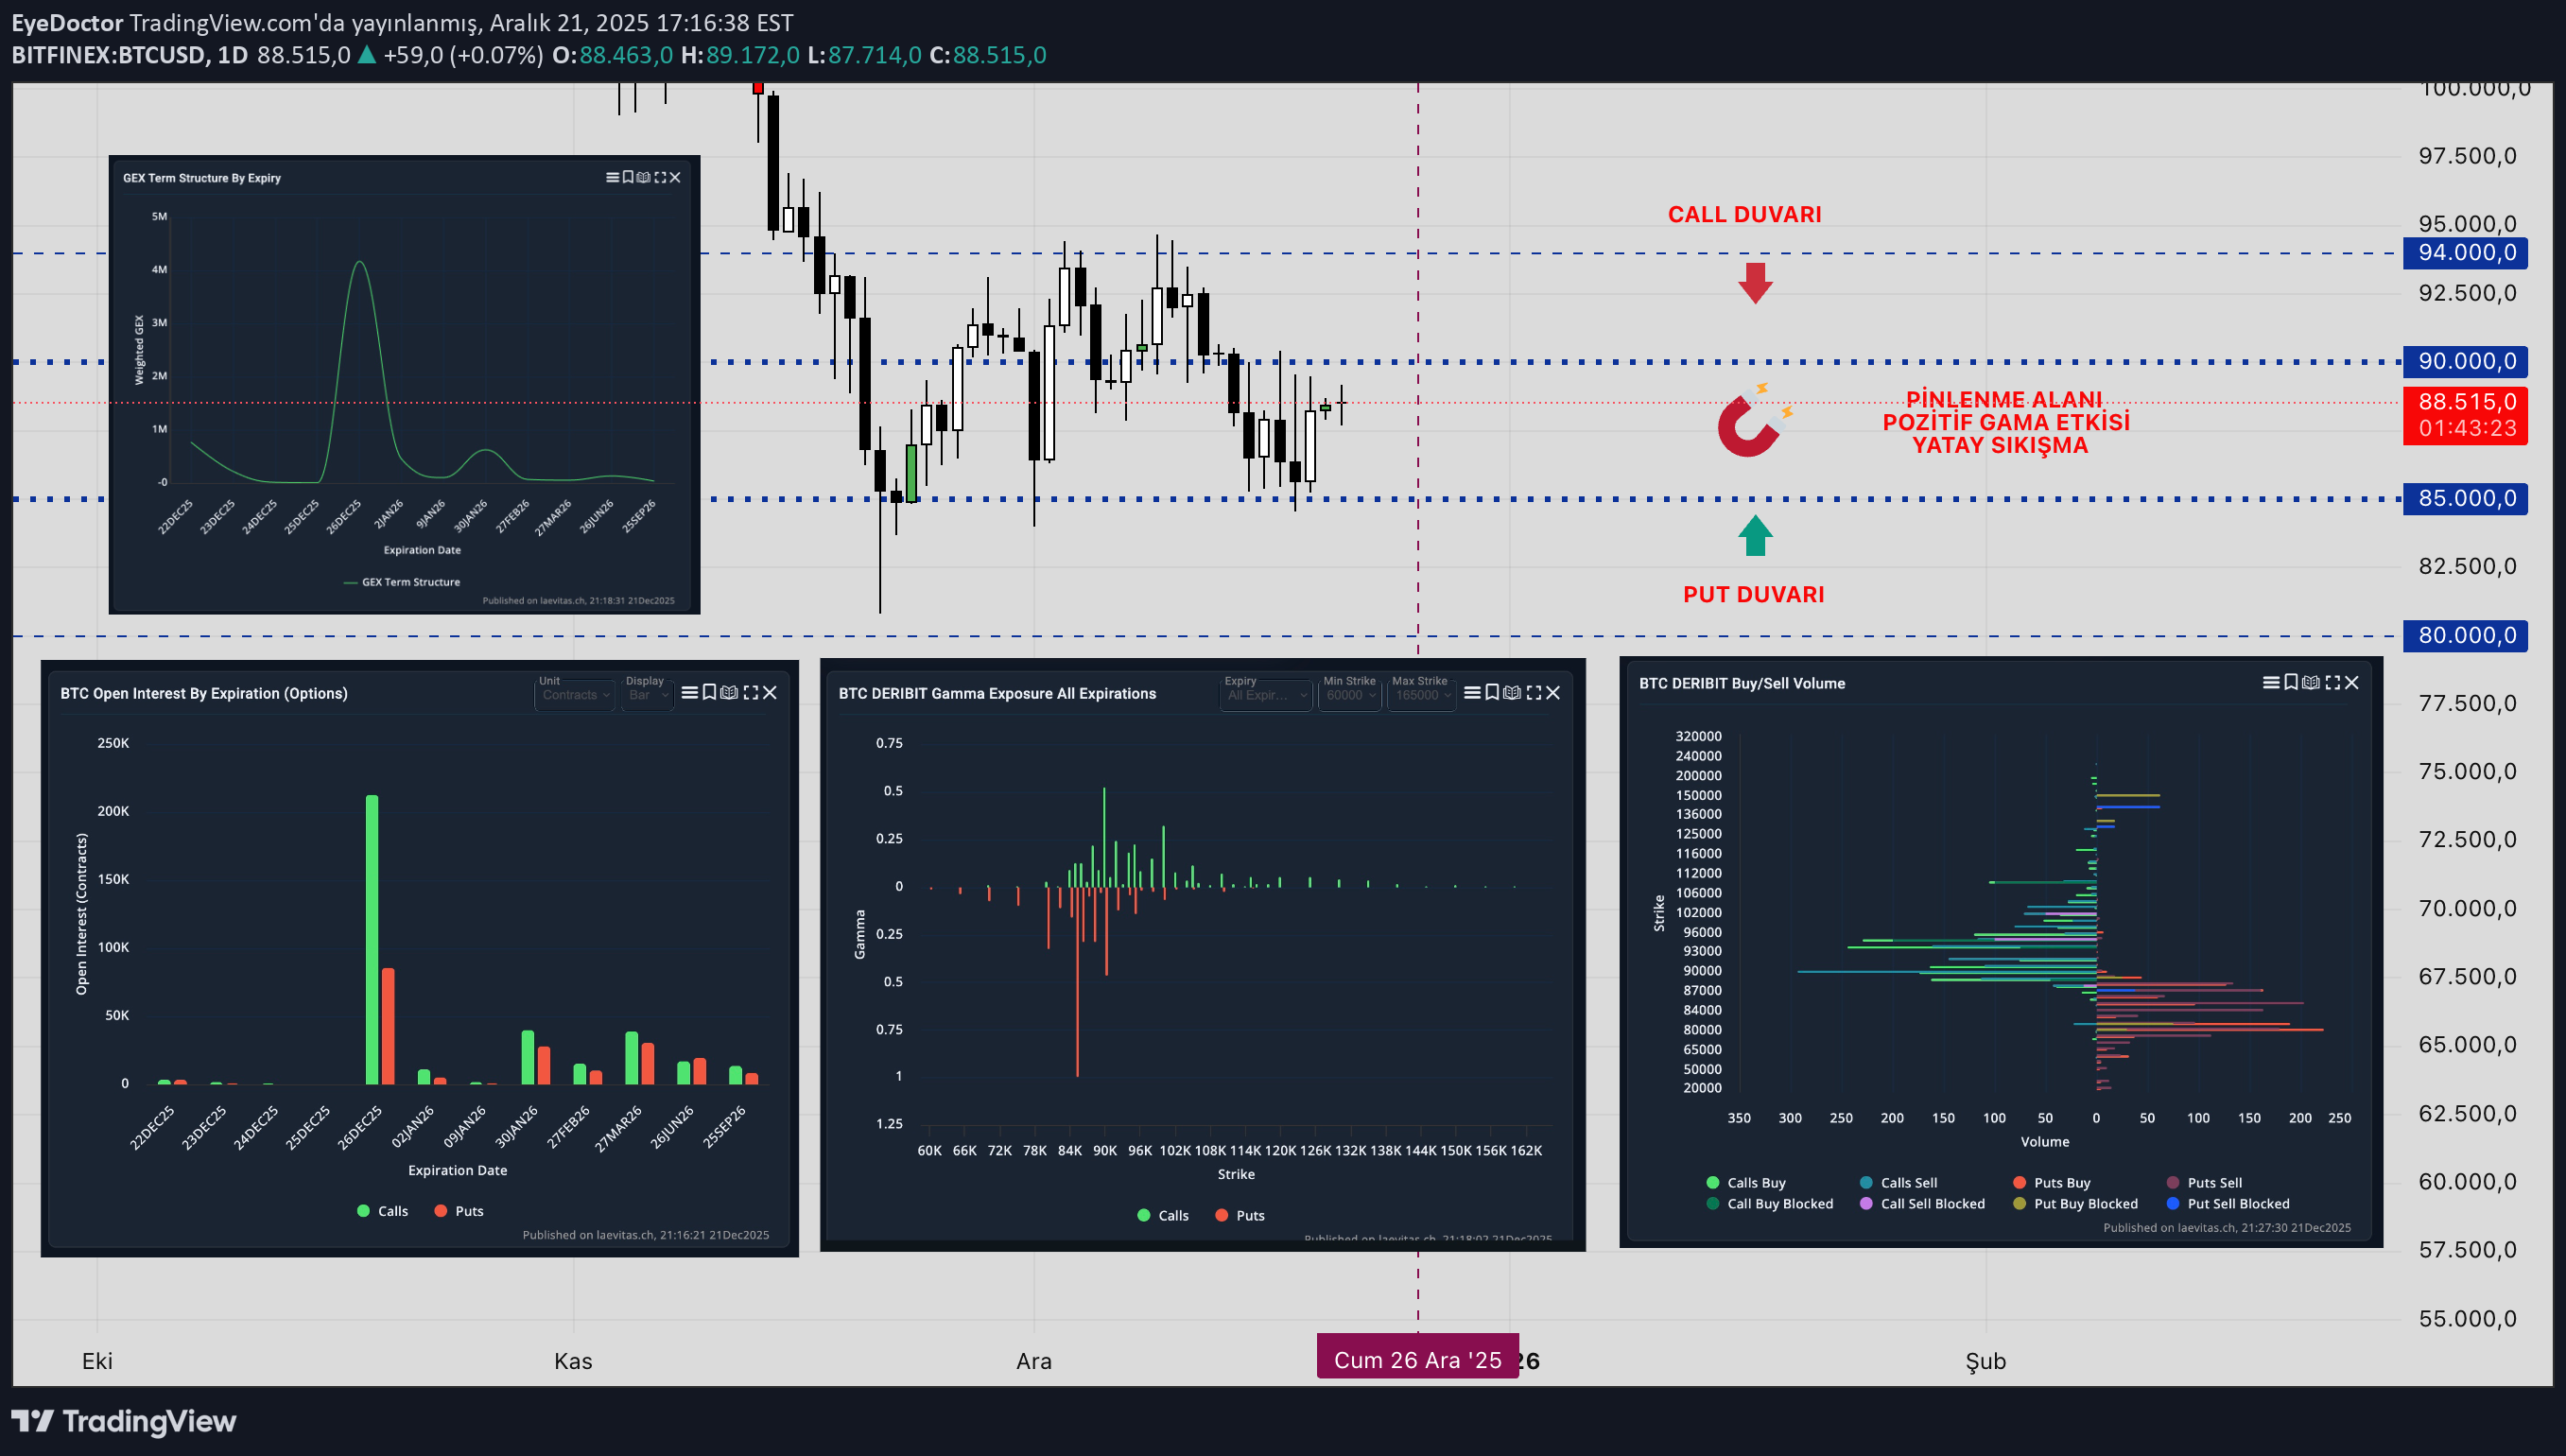
Indecision prevails in the market and it is stuck in the 85-90k range. The reason is the big players in the options market Expiry date for million dollar contracts with high gamma effect on December 26 Call at 90k taken for hedge purposes; There is a PUT wall at 85k. The high positive gamma effect in this band causes a hedge in the opposite direction whenever the price moves out of the band. Market Makers (Option sellers) stabilize the price in this region. (Delta hedging) The goal is for options to expire worthless at maturity. The price becomes more stable as it gets closer to the expiration date. The real direction becomes clear after this date when the gamma effect disappears.
EyeDoctor
EyeDoctor
BTC
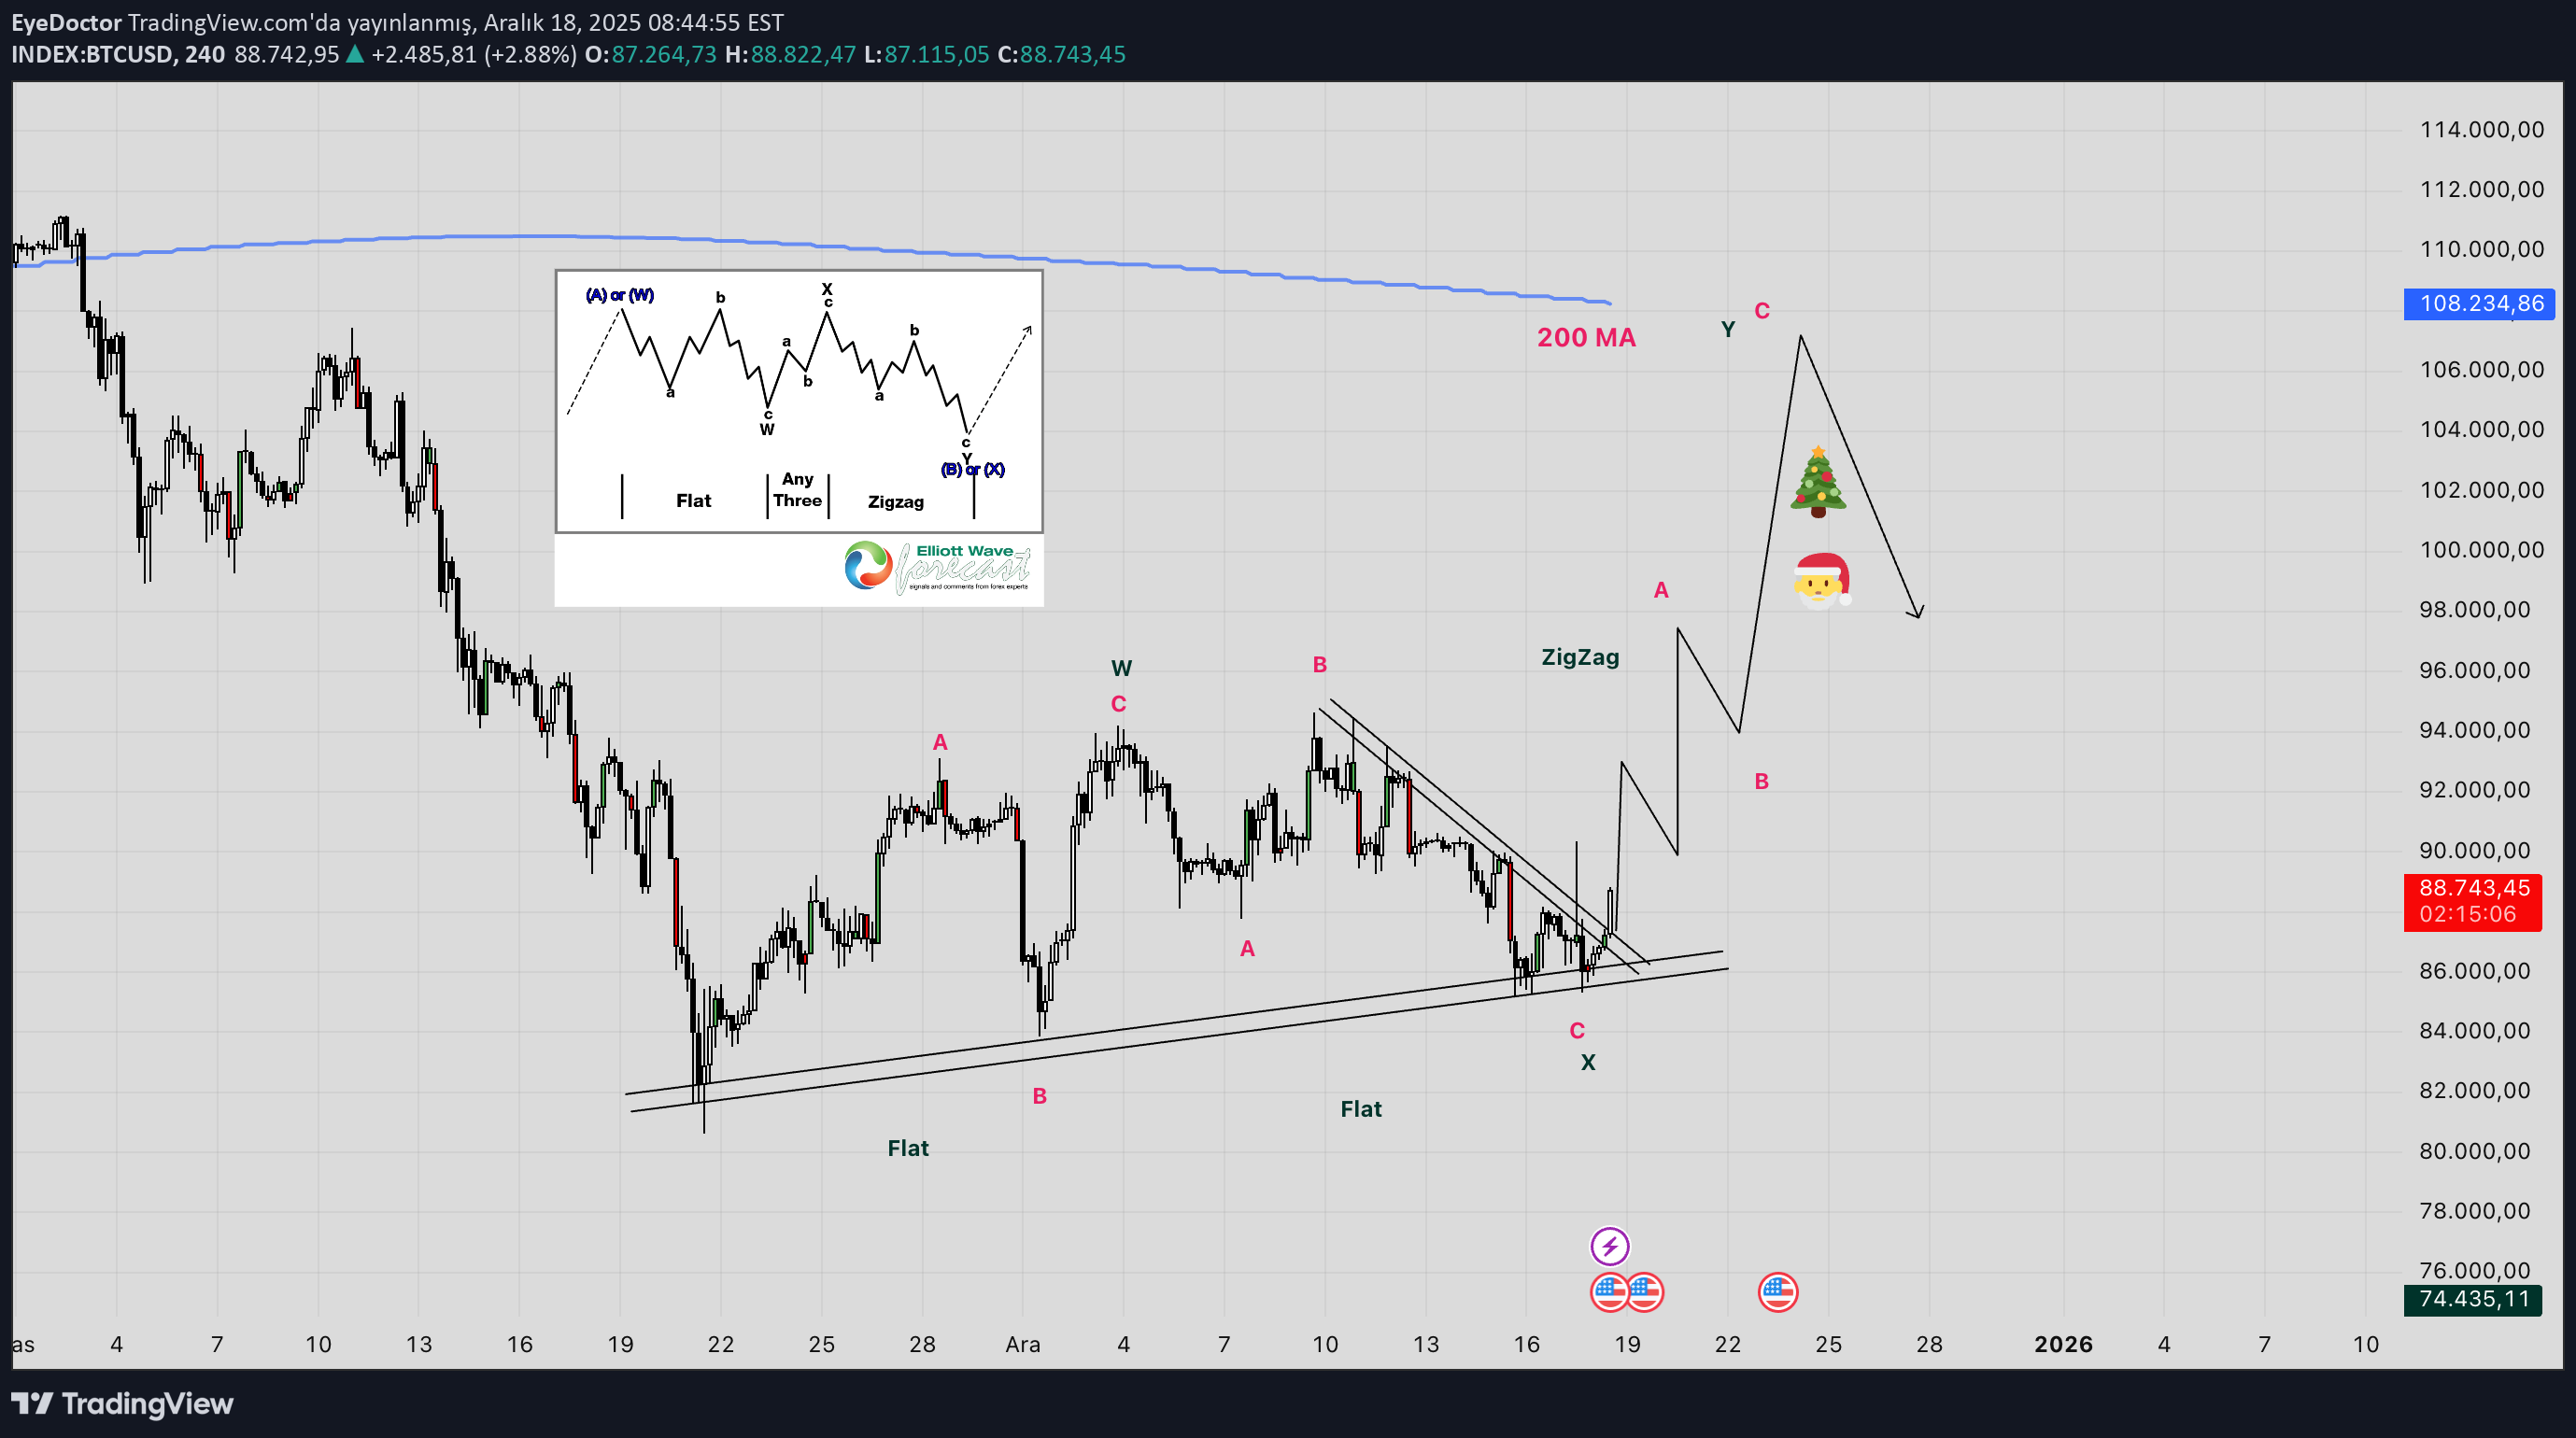
,,,,, ,,,,, Elliot DoubleThree Flat-Flat-ZigZag Santa Trap ,,,,, ,,,,, There is nothing new except what has been forgotten.
EyeDoctor
BTC
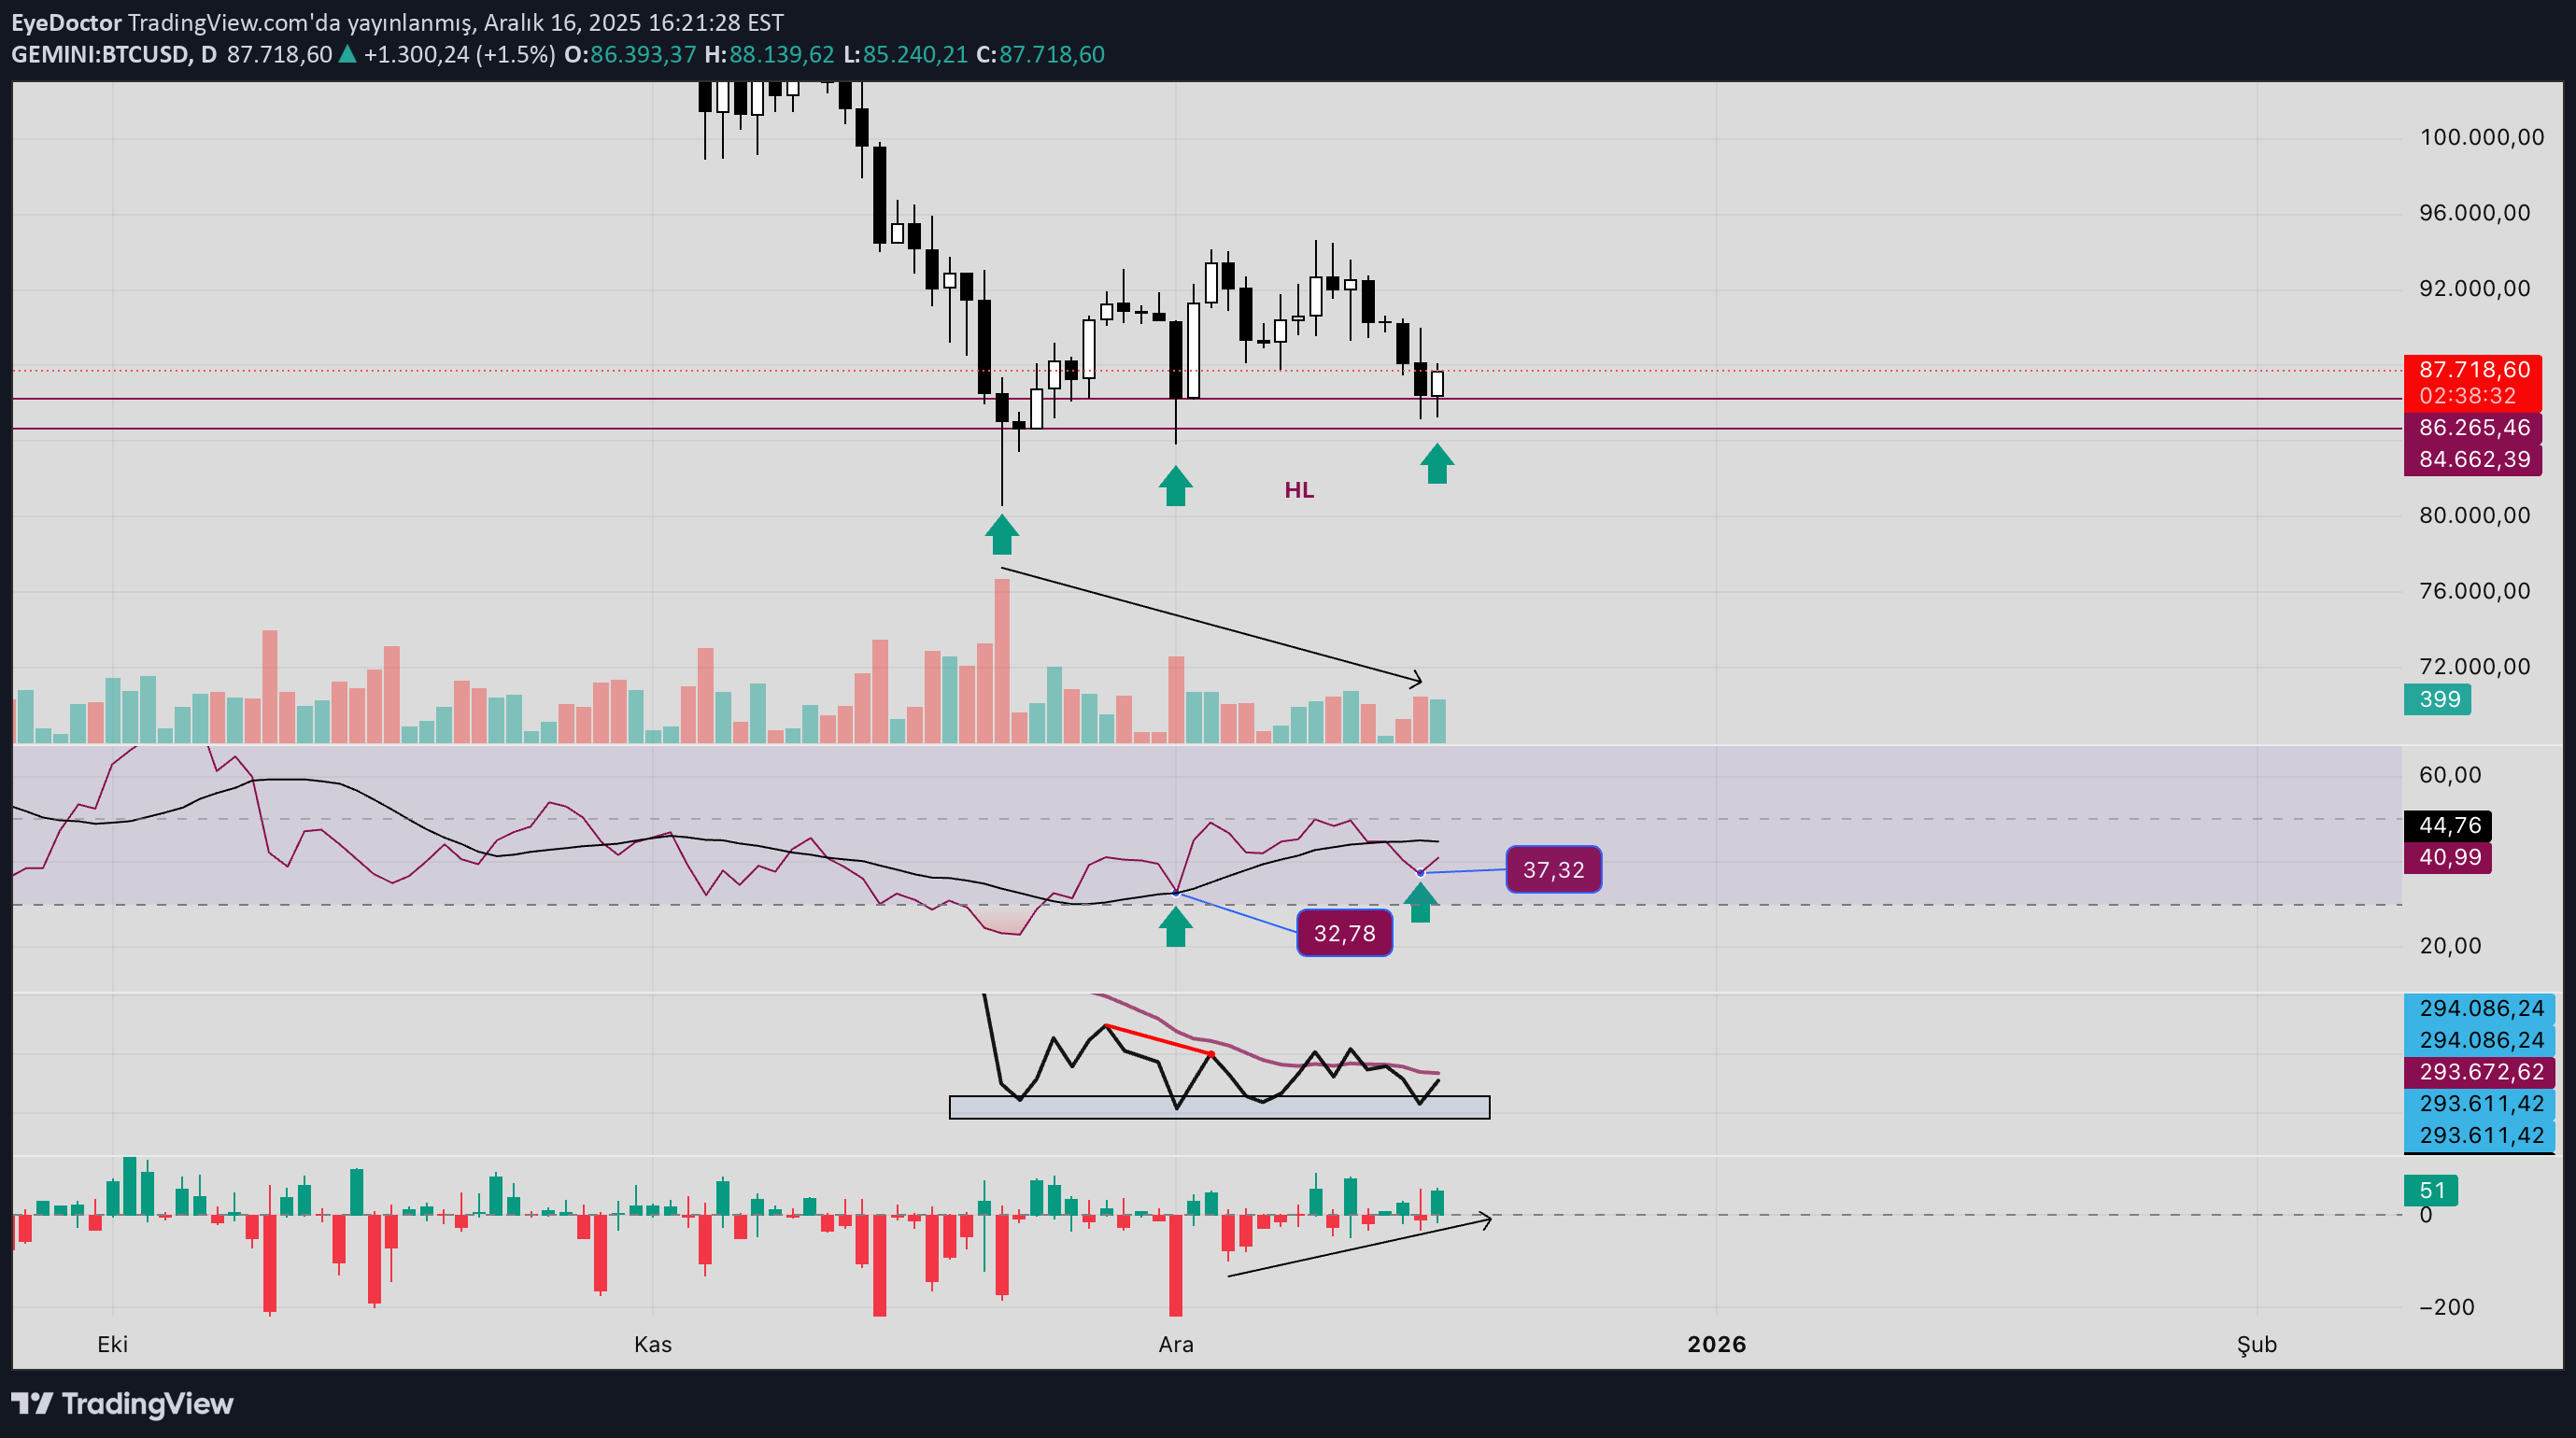
Price HL+ RSI HL+ in the range of 30-40 Sales volume is decreasing + OBV (Balance Trading Volume) horizontal + CVD (Cumulative Volume Delta) decrease/upward slope in sales + Consolidation over time + (rapid recovery=bear trap?) LOCAL BOTTOM?
EyeDoctor
EyeDoctor
رمزگشایی نمودار لگاریتمی اتریوم (ETH): راز پایان قطری تکرار شونده چیست؟
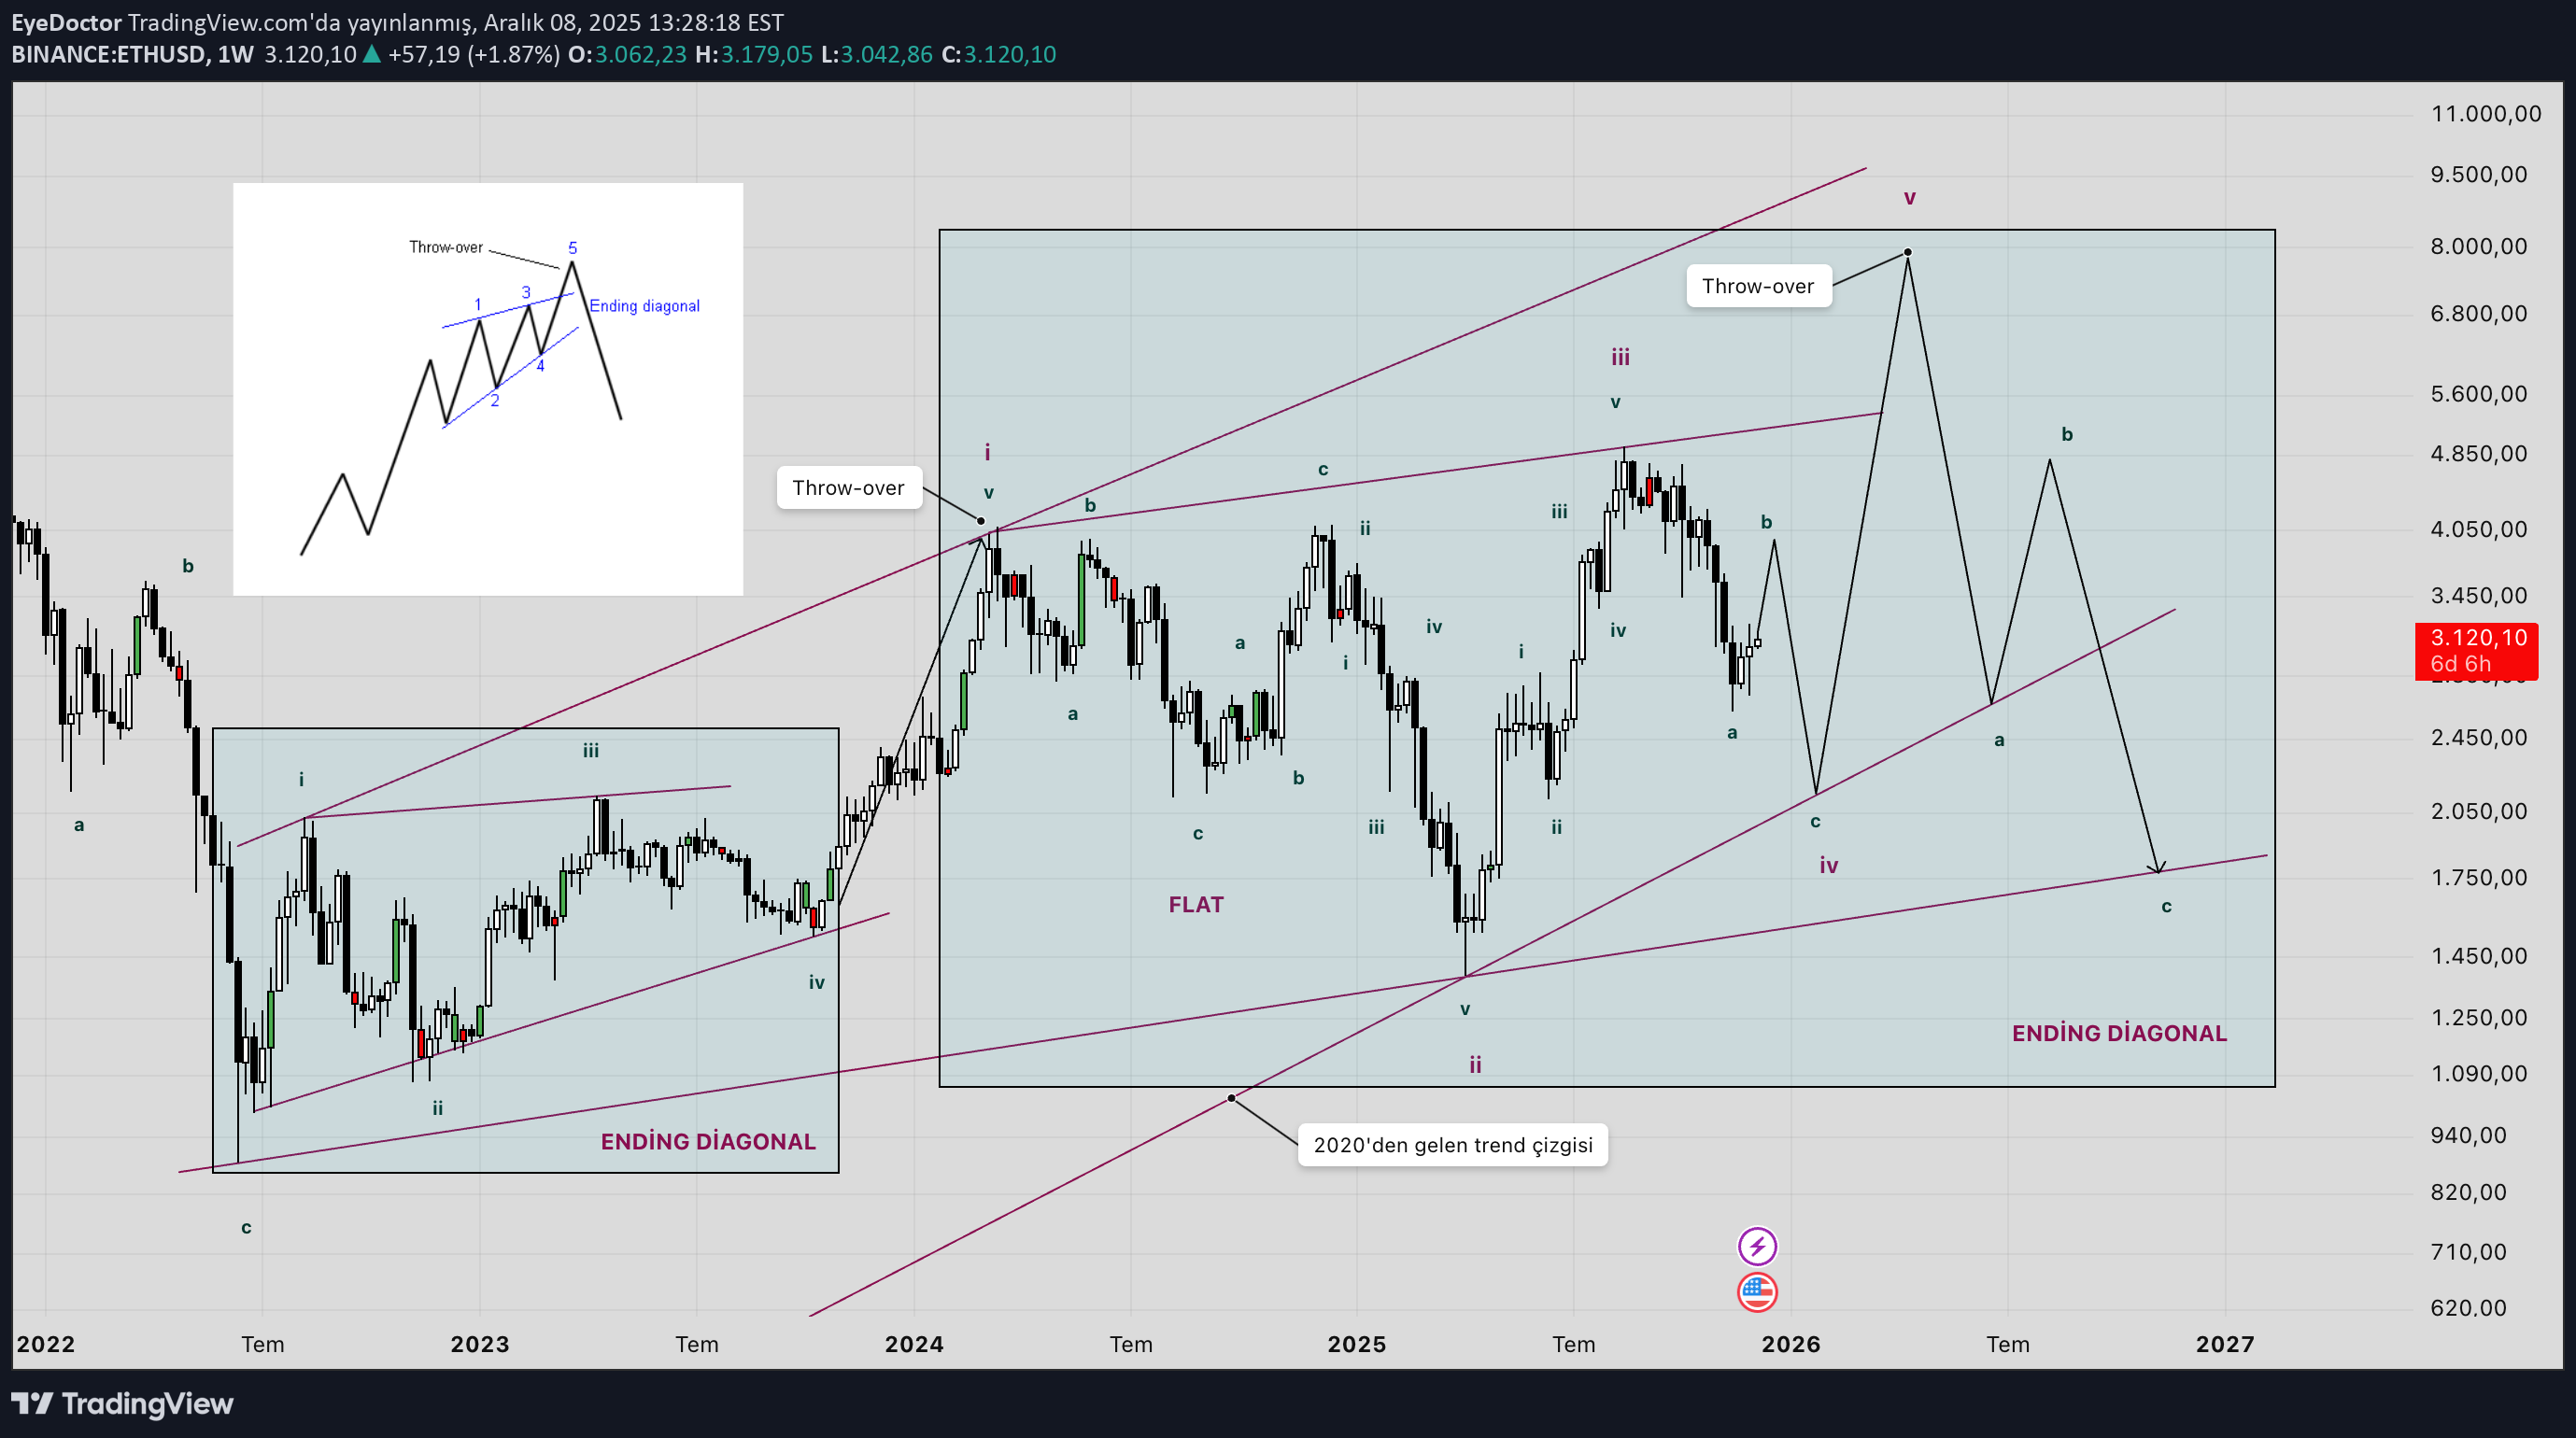
,,,,, ,,,,, logarithmic chart repeating fractal End Diagonal ,,,,, ,,,,,
EyeDoctor
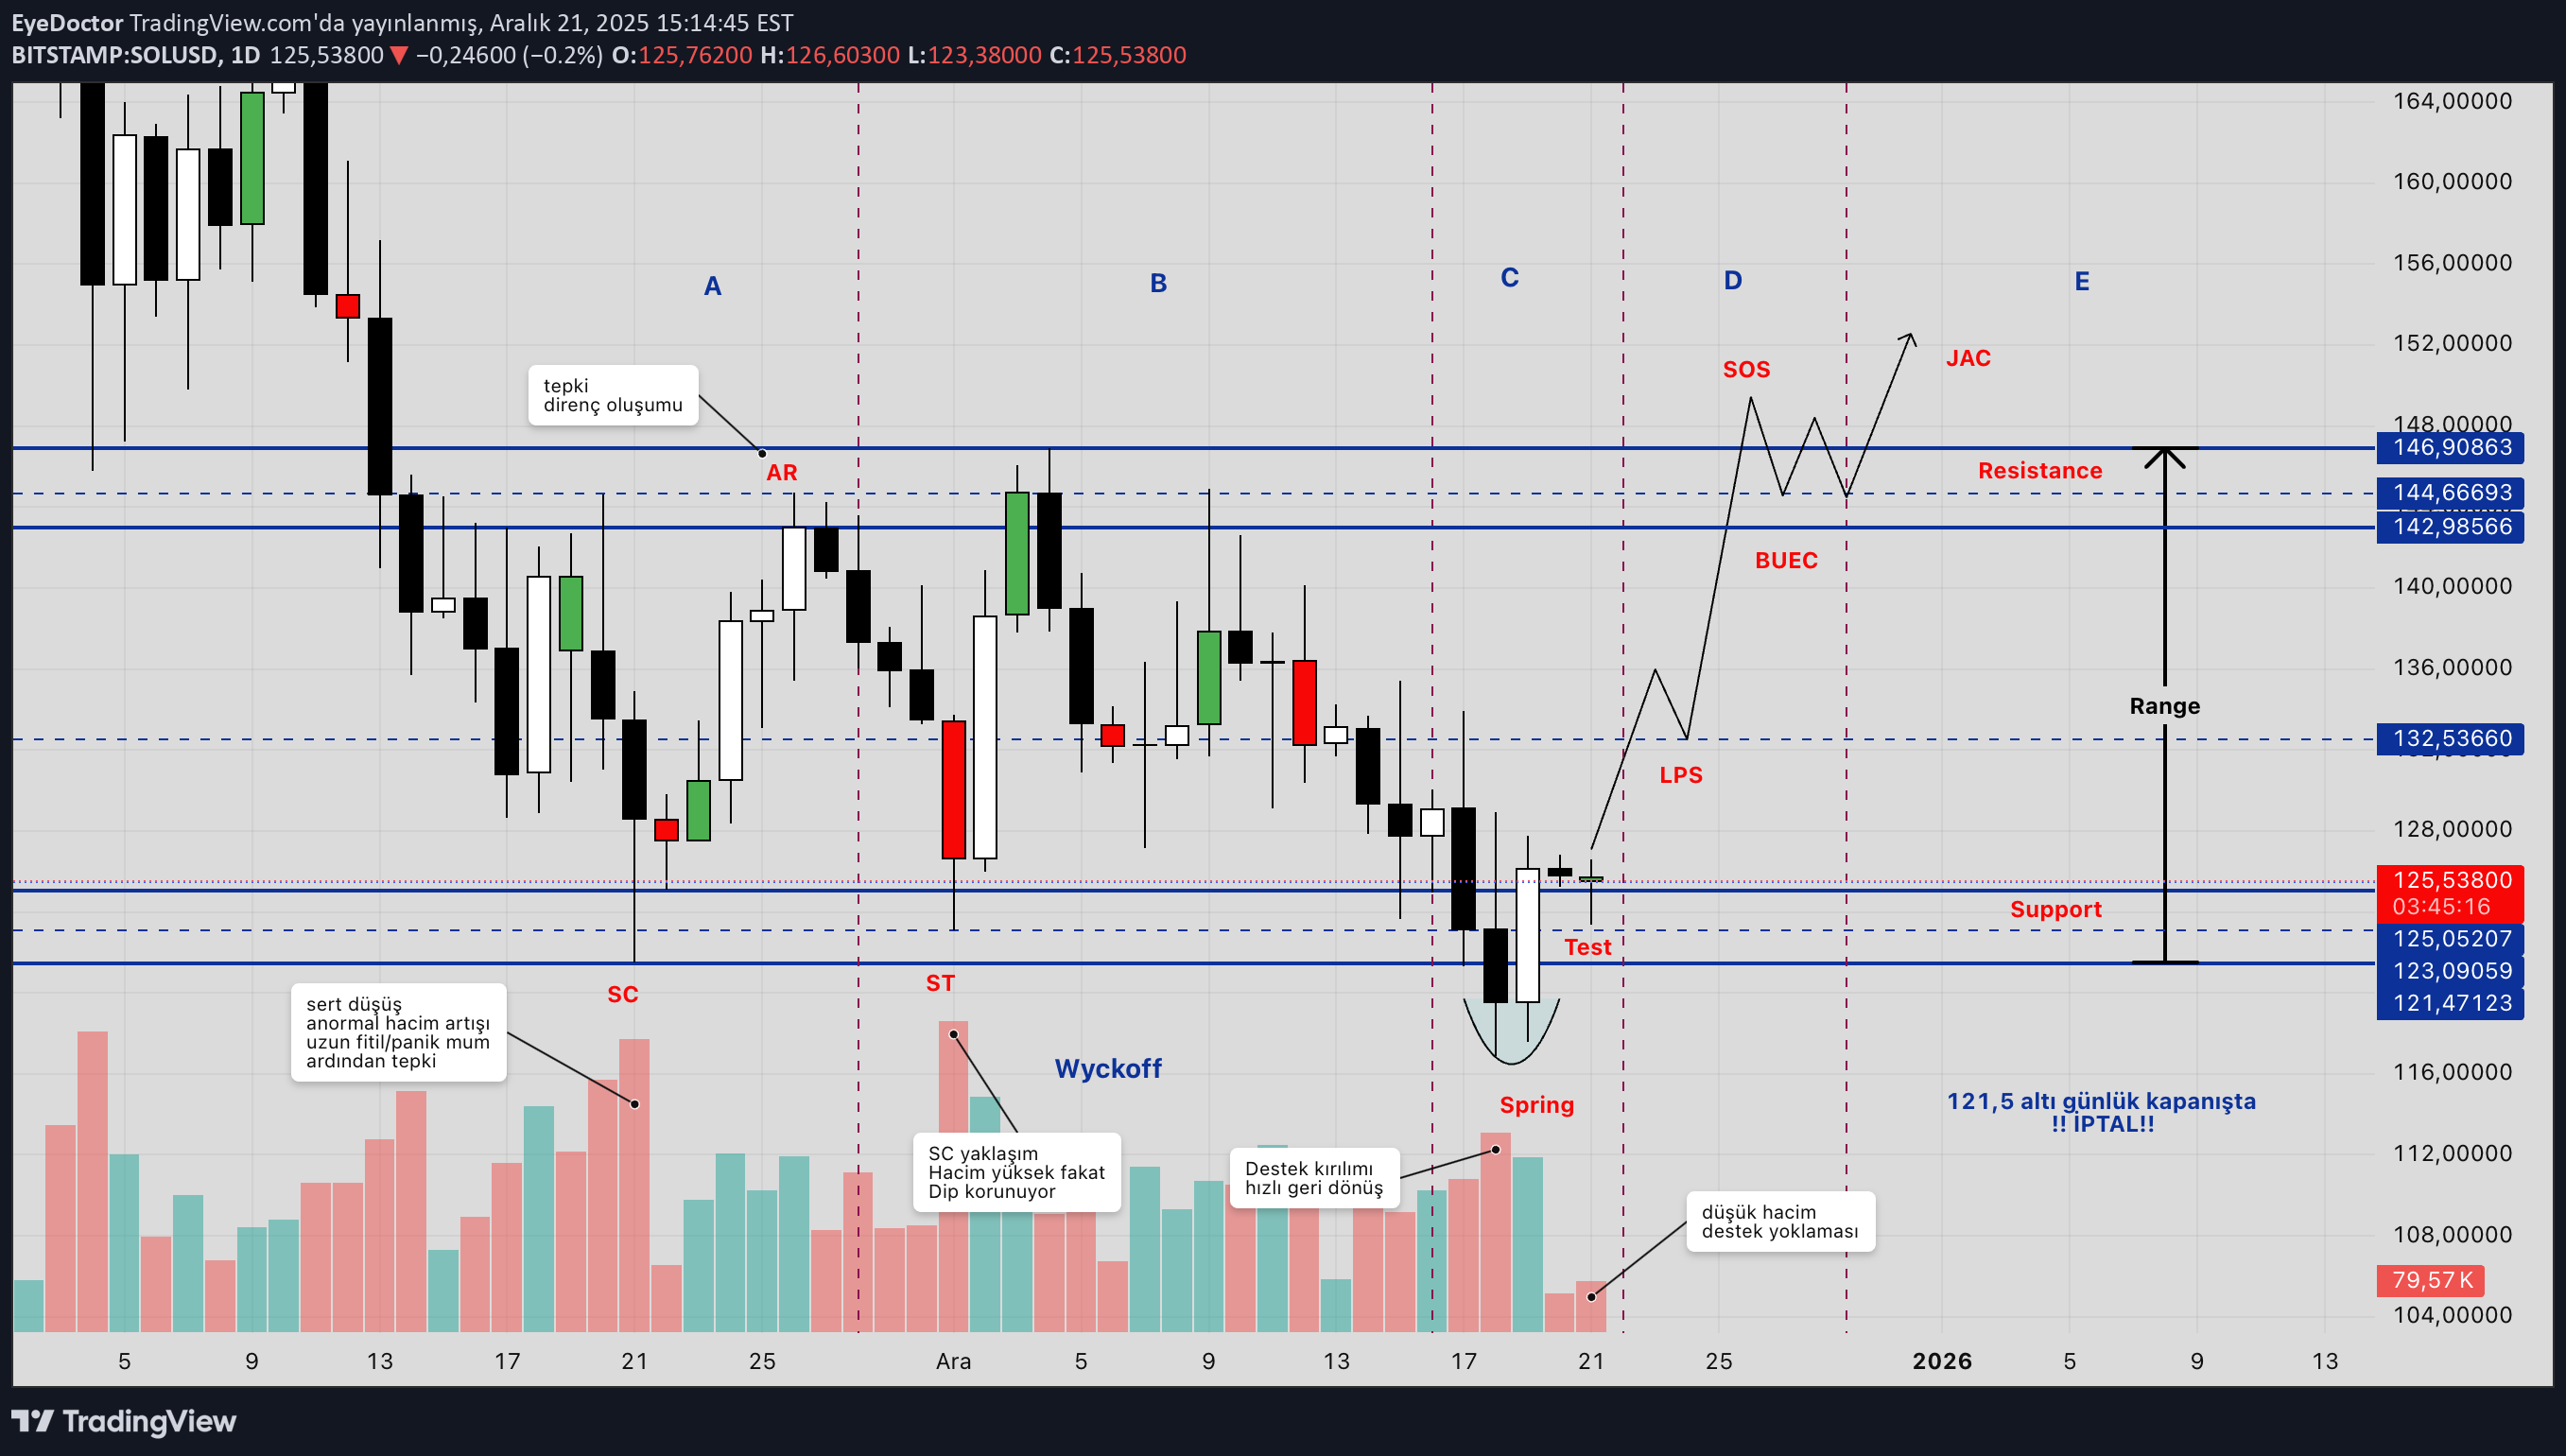
بیت کوین در مسیر موج چهارم توزیع وایکوف: روزهای سرنوشتساز 2024 و 2025!
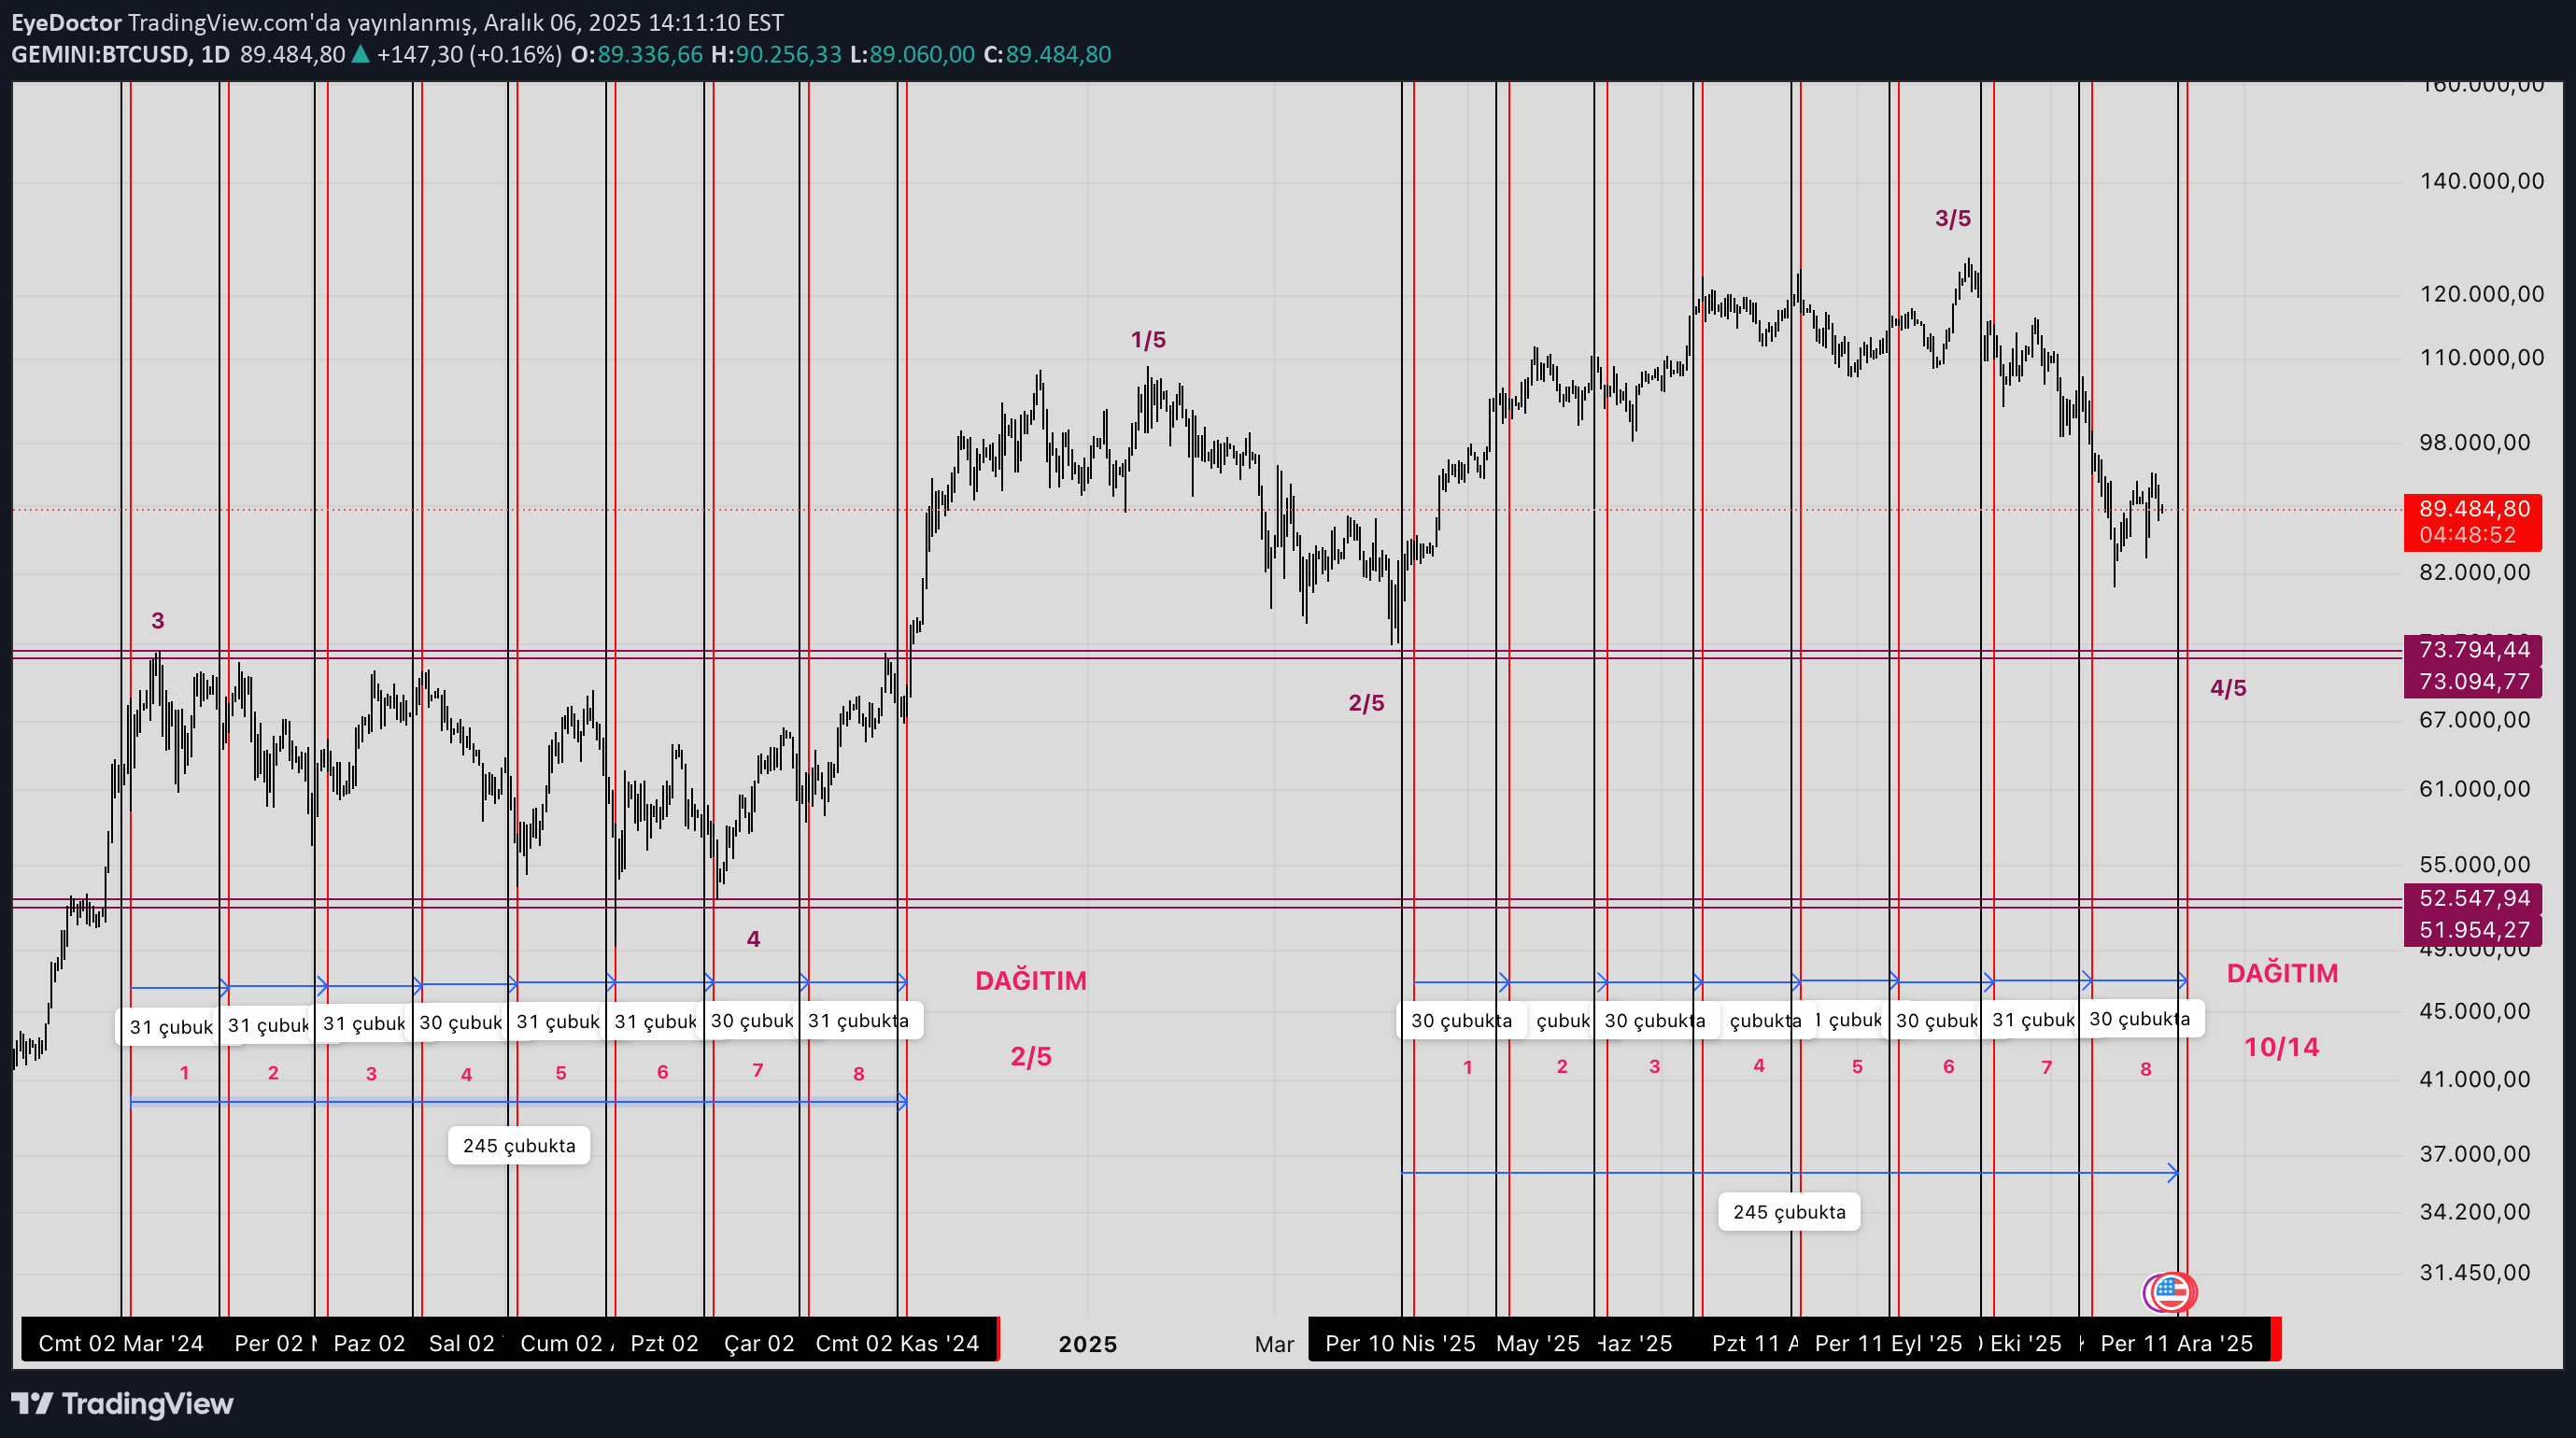
4th Wave Wyckoff Distribution diagram Total 245 days in 2024 Pivot days of the month are days 2 and 5 Same scenario in 2025 10th and 14th days of the month Total 245 days Distribution end expectation mid December 10 December FED? Last wave crest of the phase?
EyeDoctor
تحلیل موج الیوت بیت کوین (BTC): راز فرکتال سهگانه در تایمفریم 4 ساعته!
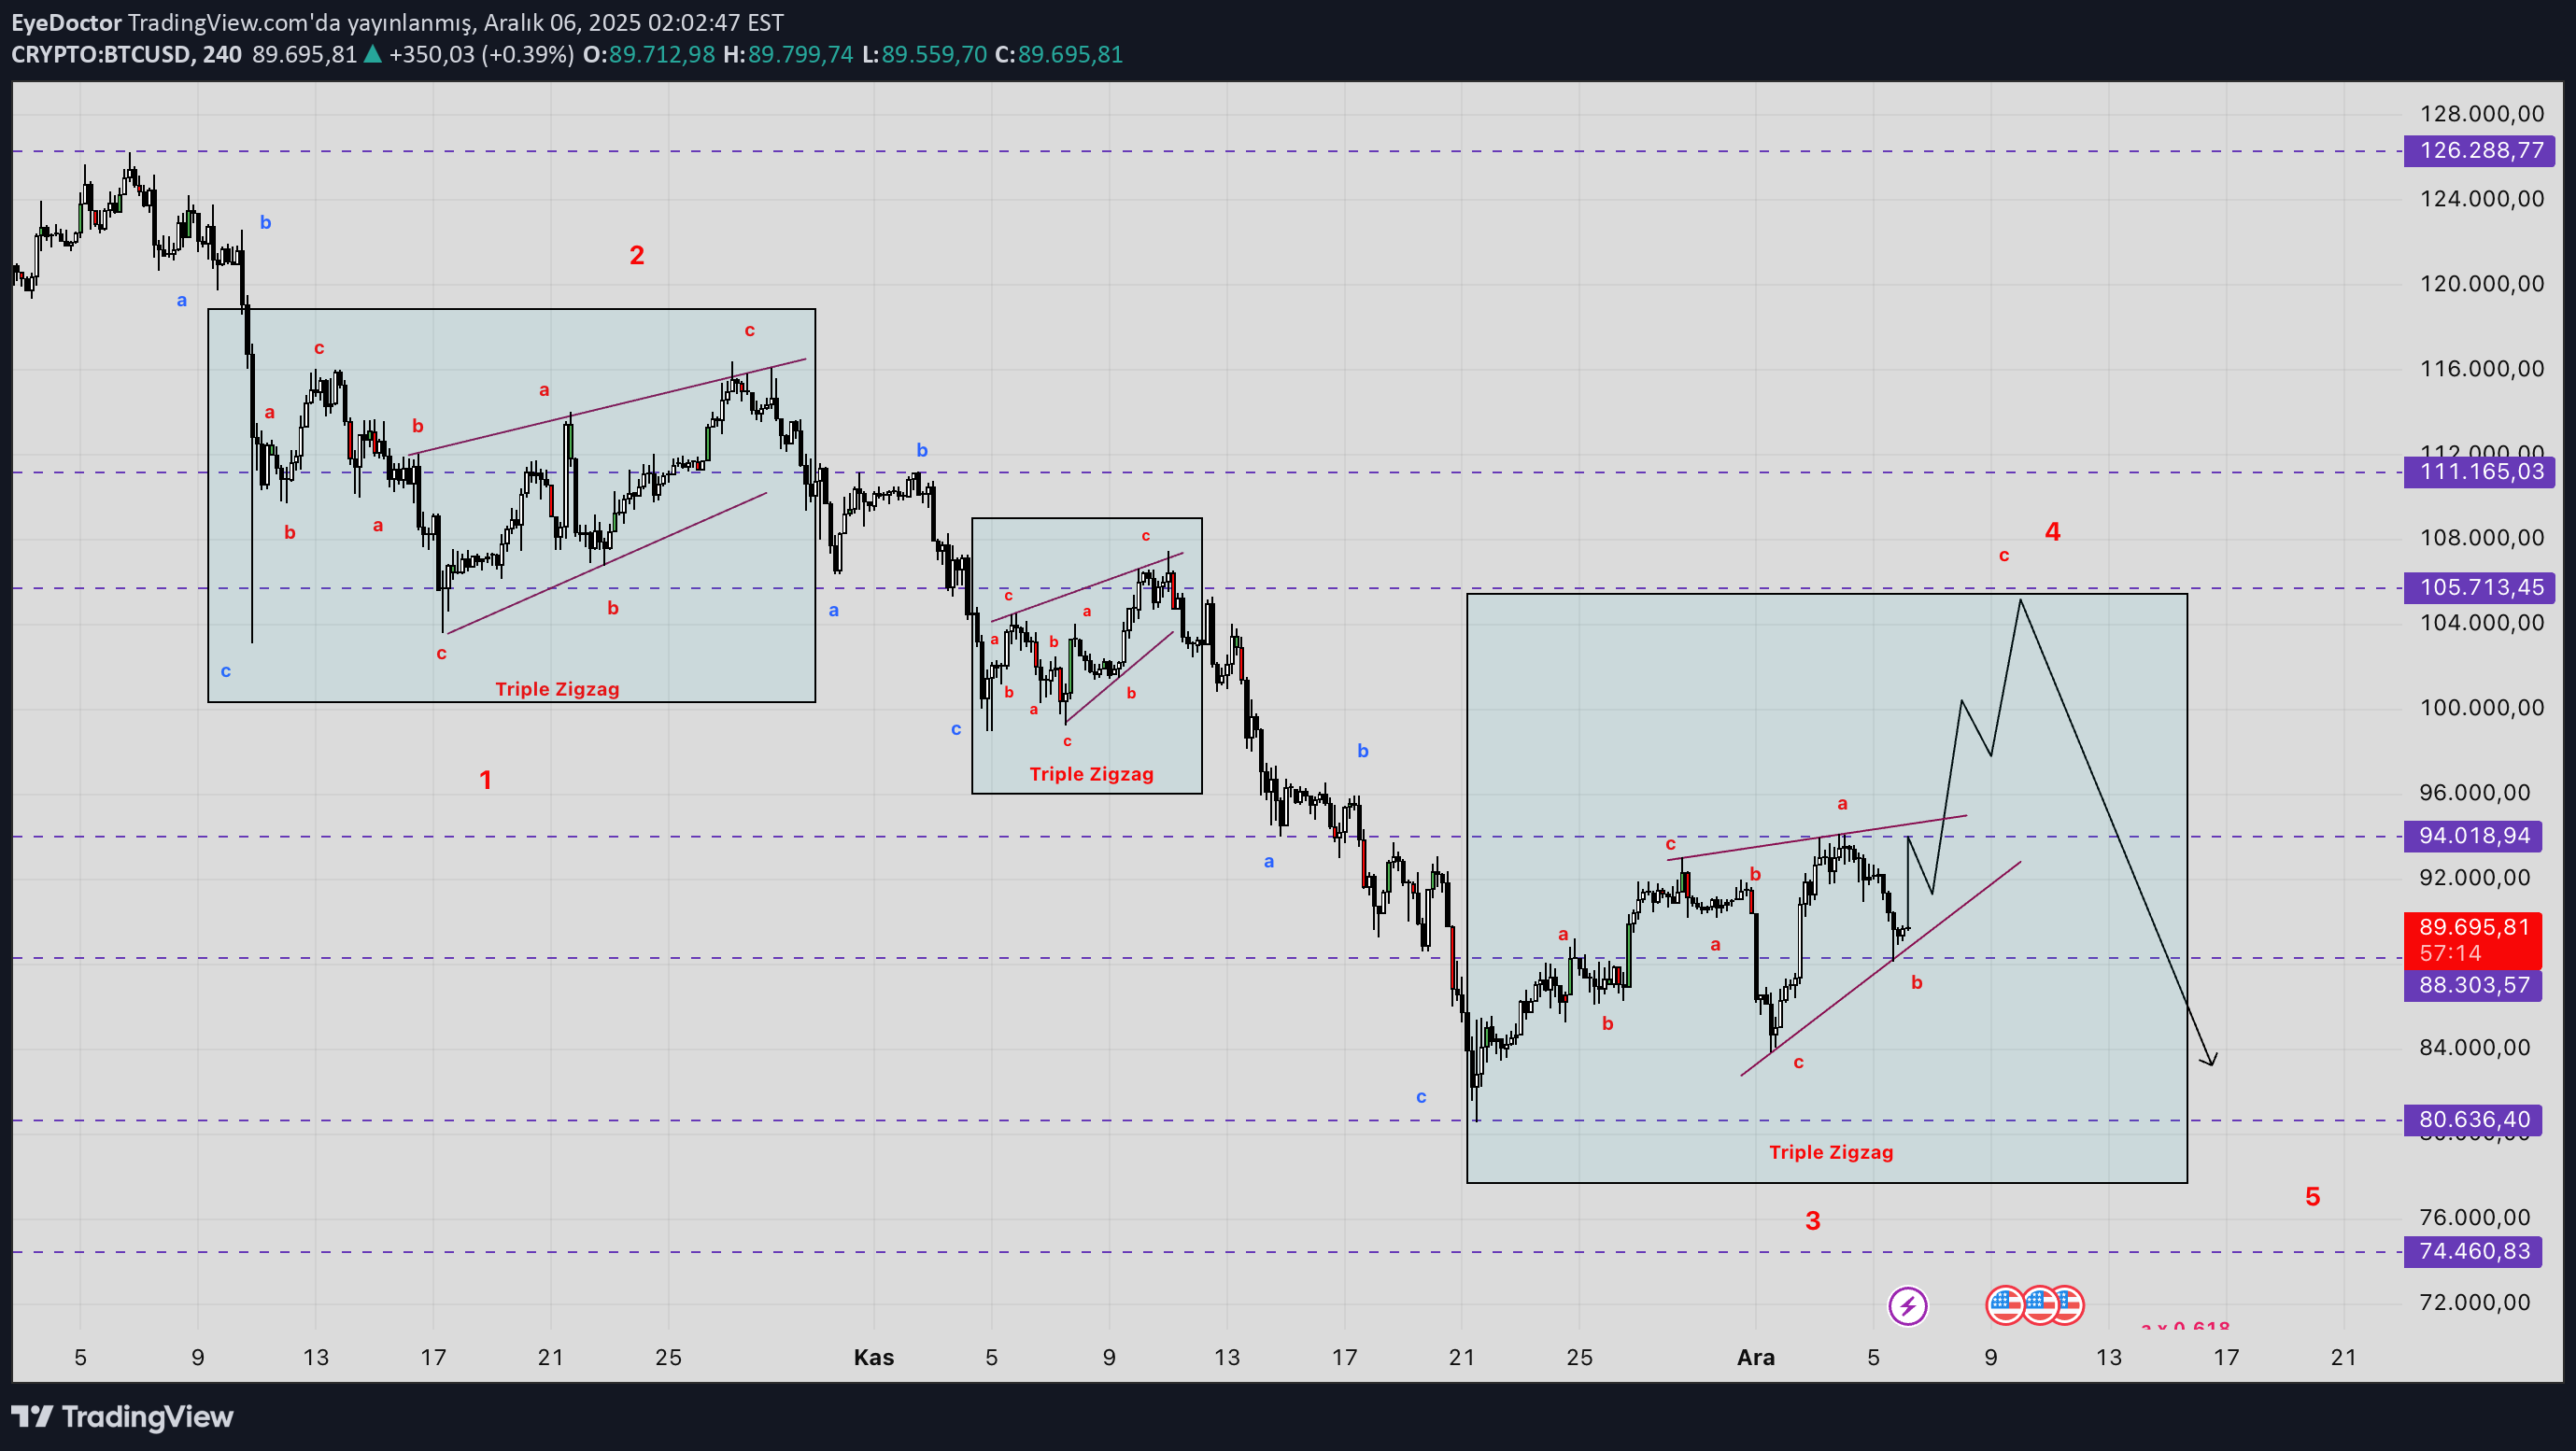
,,,,, Elliot wave Analysis 4H recurring fractal Triple Three ,,,,,
EyeDoctor
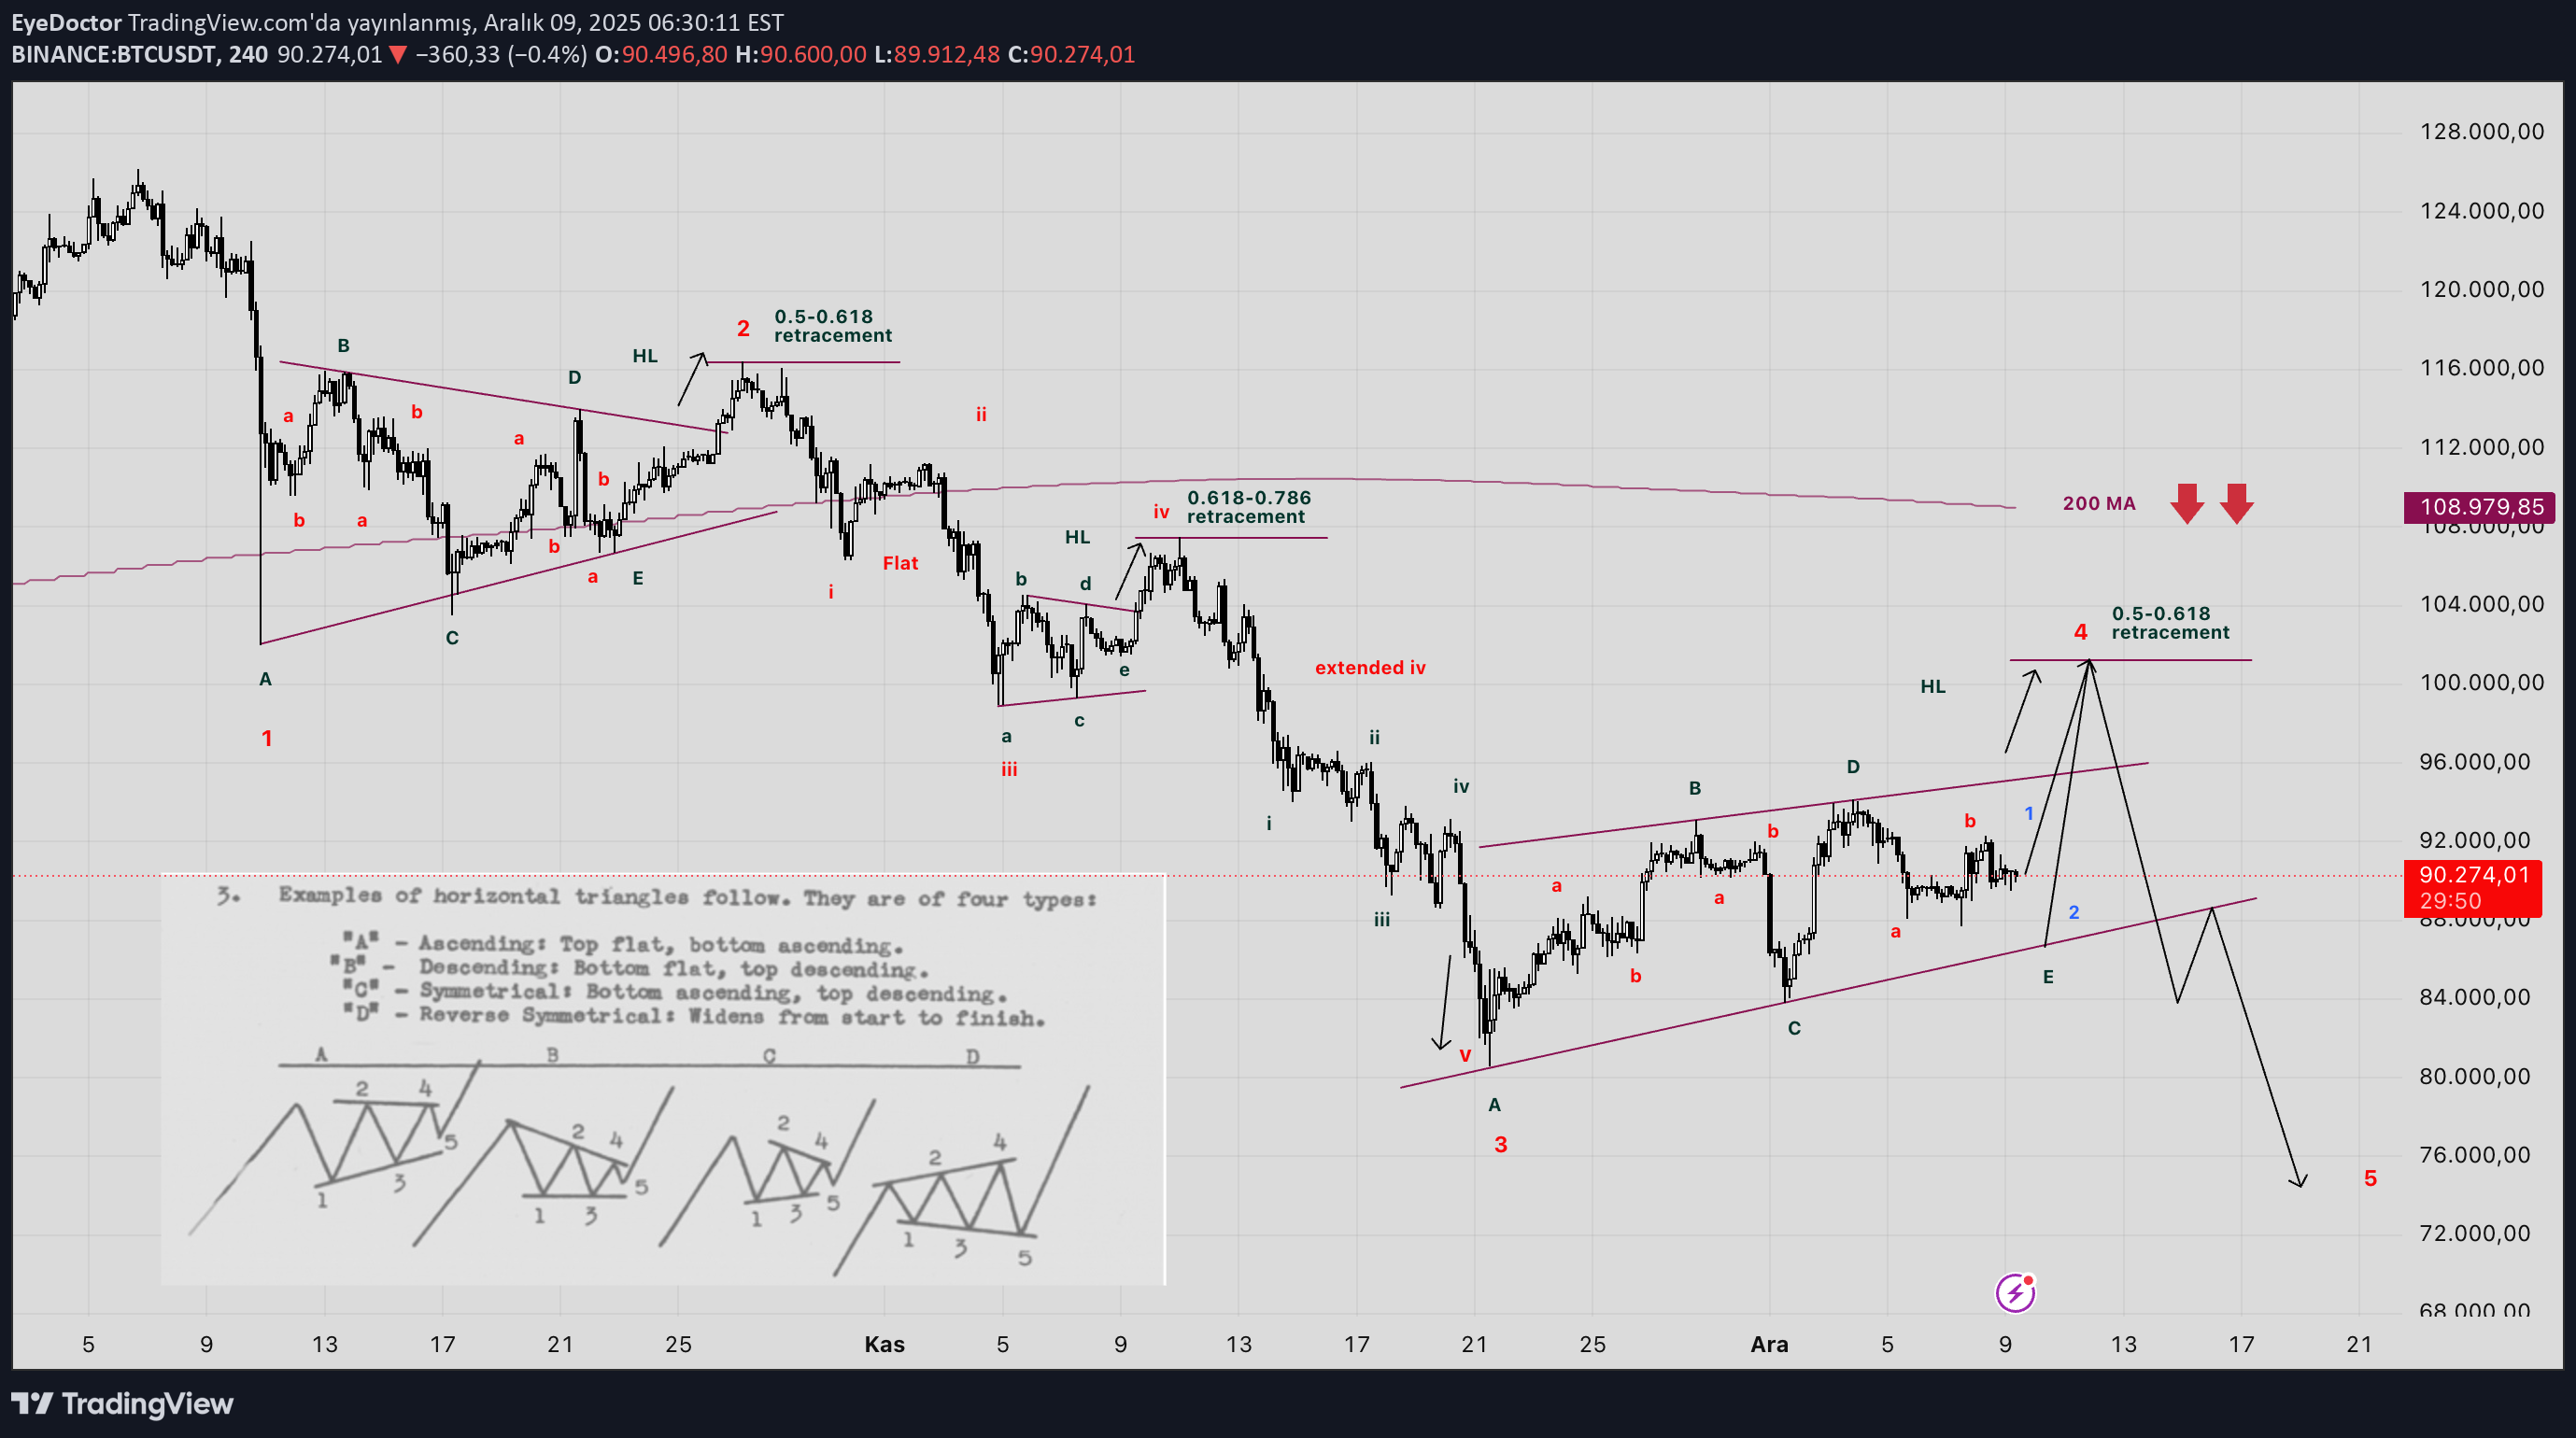
تحلیل موج الیوت: راز سطوح فیبوناچی در نوسانات بازار
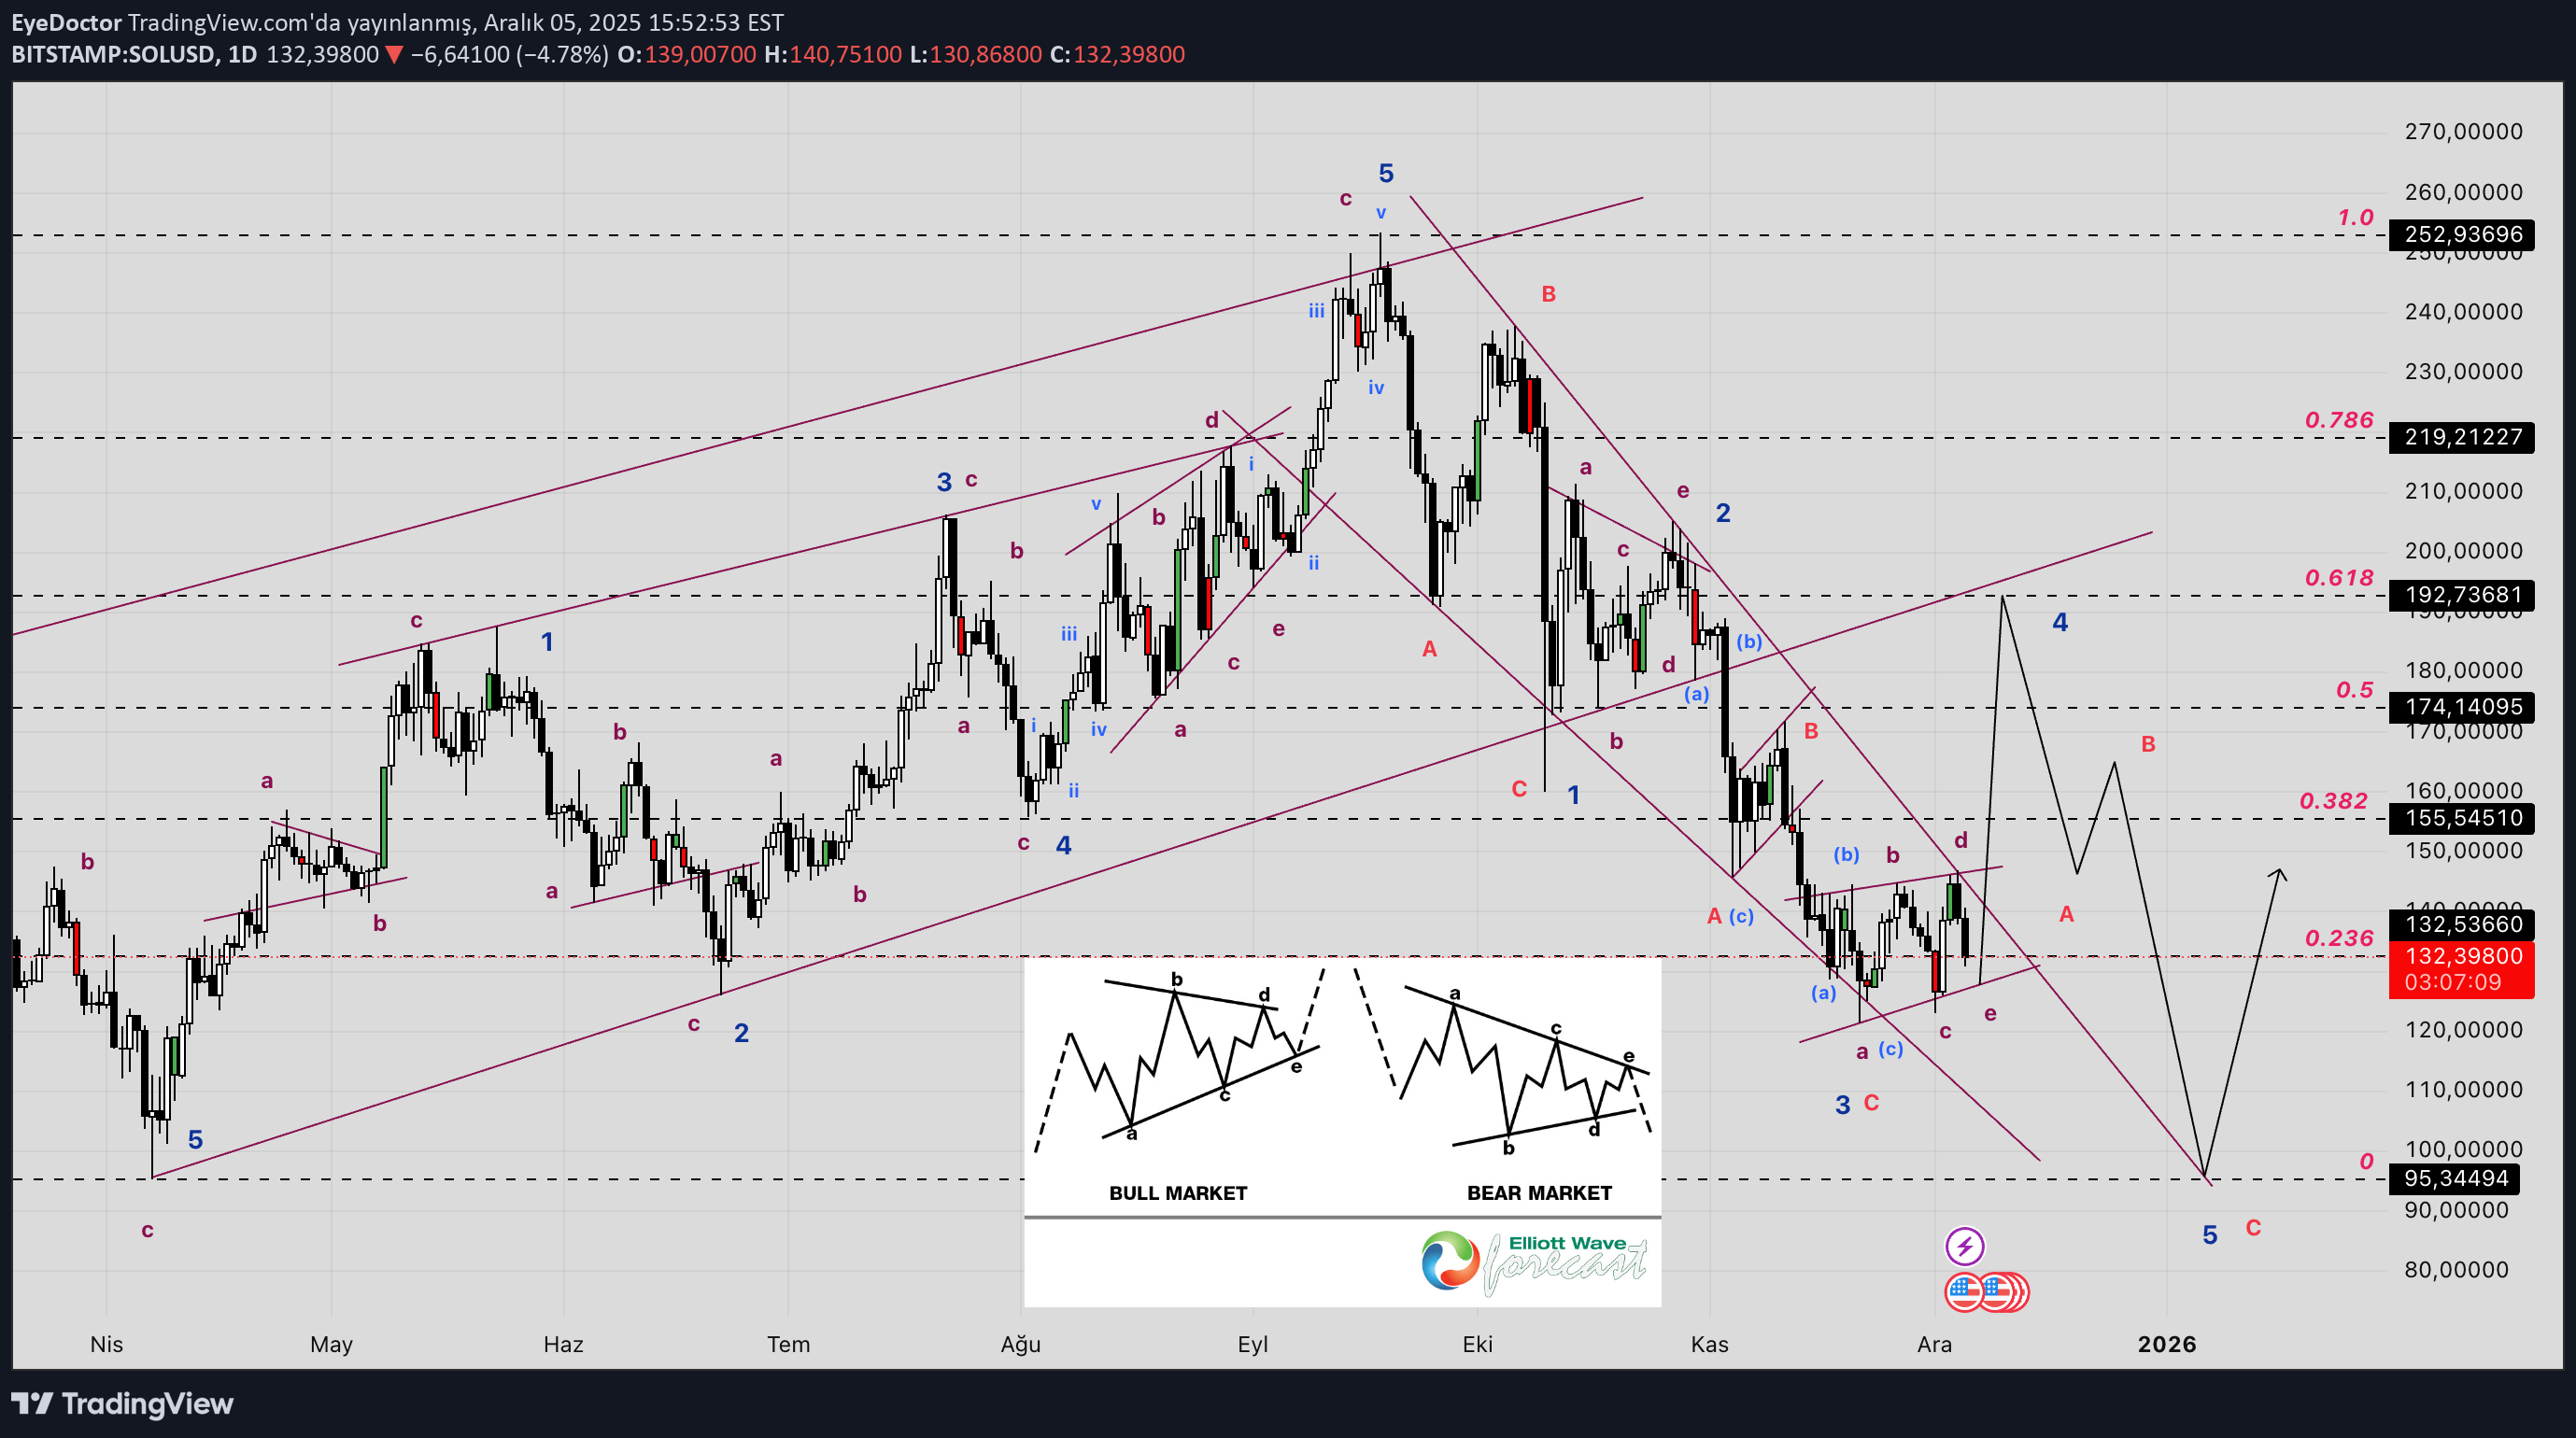
,,,,, ,,,,, Elliot wave Analysis Fibonacci Levels ,,,,, ,,,,,
EyeDoctor
رمز ارز بیت کوین: راز ساختارهای پیچیده الیوت قبل از صعود نهایی!
Elliot's theorem Complex correction structure Double three Expanded flat Before the main trend starts One last Final Flash needed!!
Disclaimer
Any content and materials included in Sahmeto's website and official communication channels are a compilation of personal opinions and analyses and are not binding. They do not constitute any recommendation for buying, selling, entering or exiting the stock market and cryptocurrency market. Also, all news and analyses included in the website and channels are merely republished information from official and unofficial domestic and foreign sources, and it is obvious that users of the said content are responsible for following up and ensuring the authenticity and accuracy of the materials. Therefore, while disclaiming responsibility, it is declared that the responsibility for any decision-making, action, and potential profit and loss in the capital market and cryptocurrency market lies with the trader.