
VIPROSE
@t_VIPROSE

What symbols does the trader recommend buying?
Purchase History
پیام های تریدر
Filter
VIPROSE

VIPROSE
VIPROSE
VIPROSE
VIPROSE
VIPROSE
XRP Weekly Setup – Breakout After Triple Bottom?
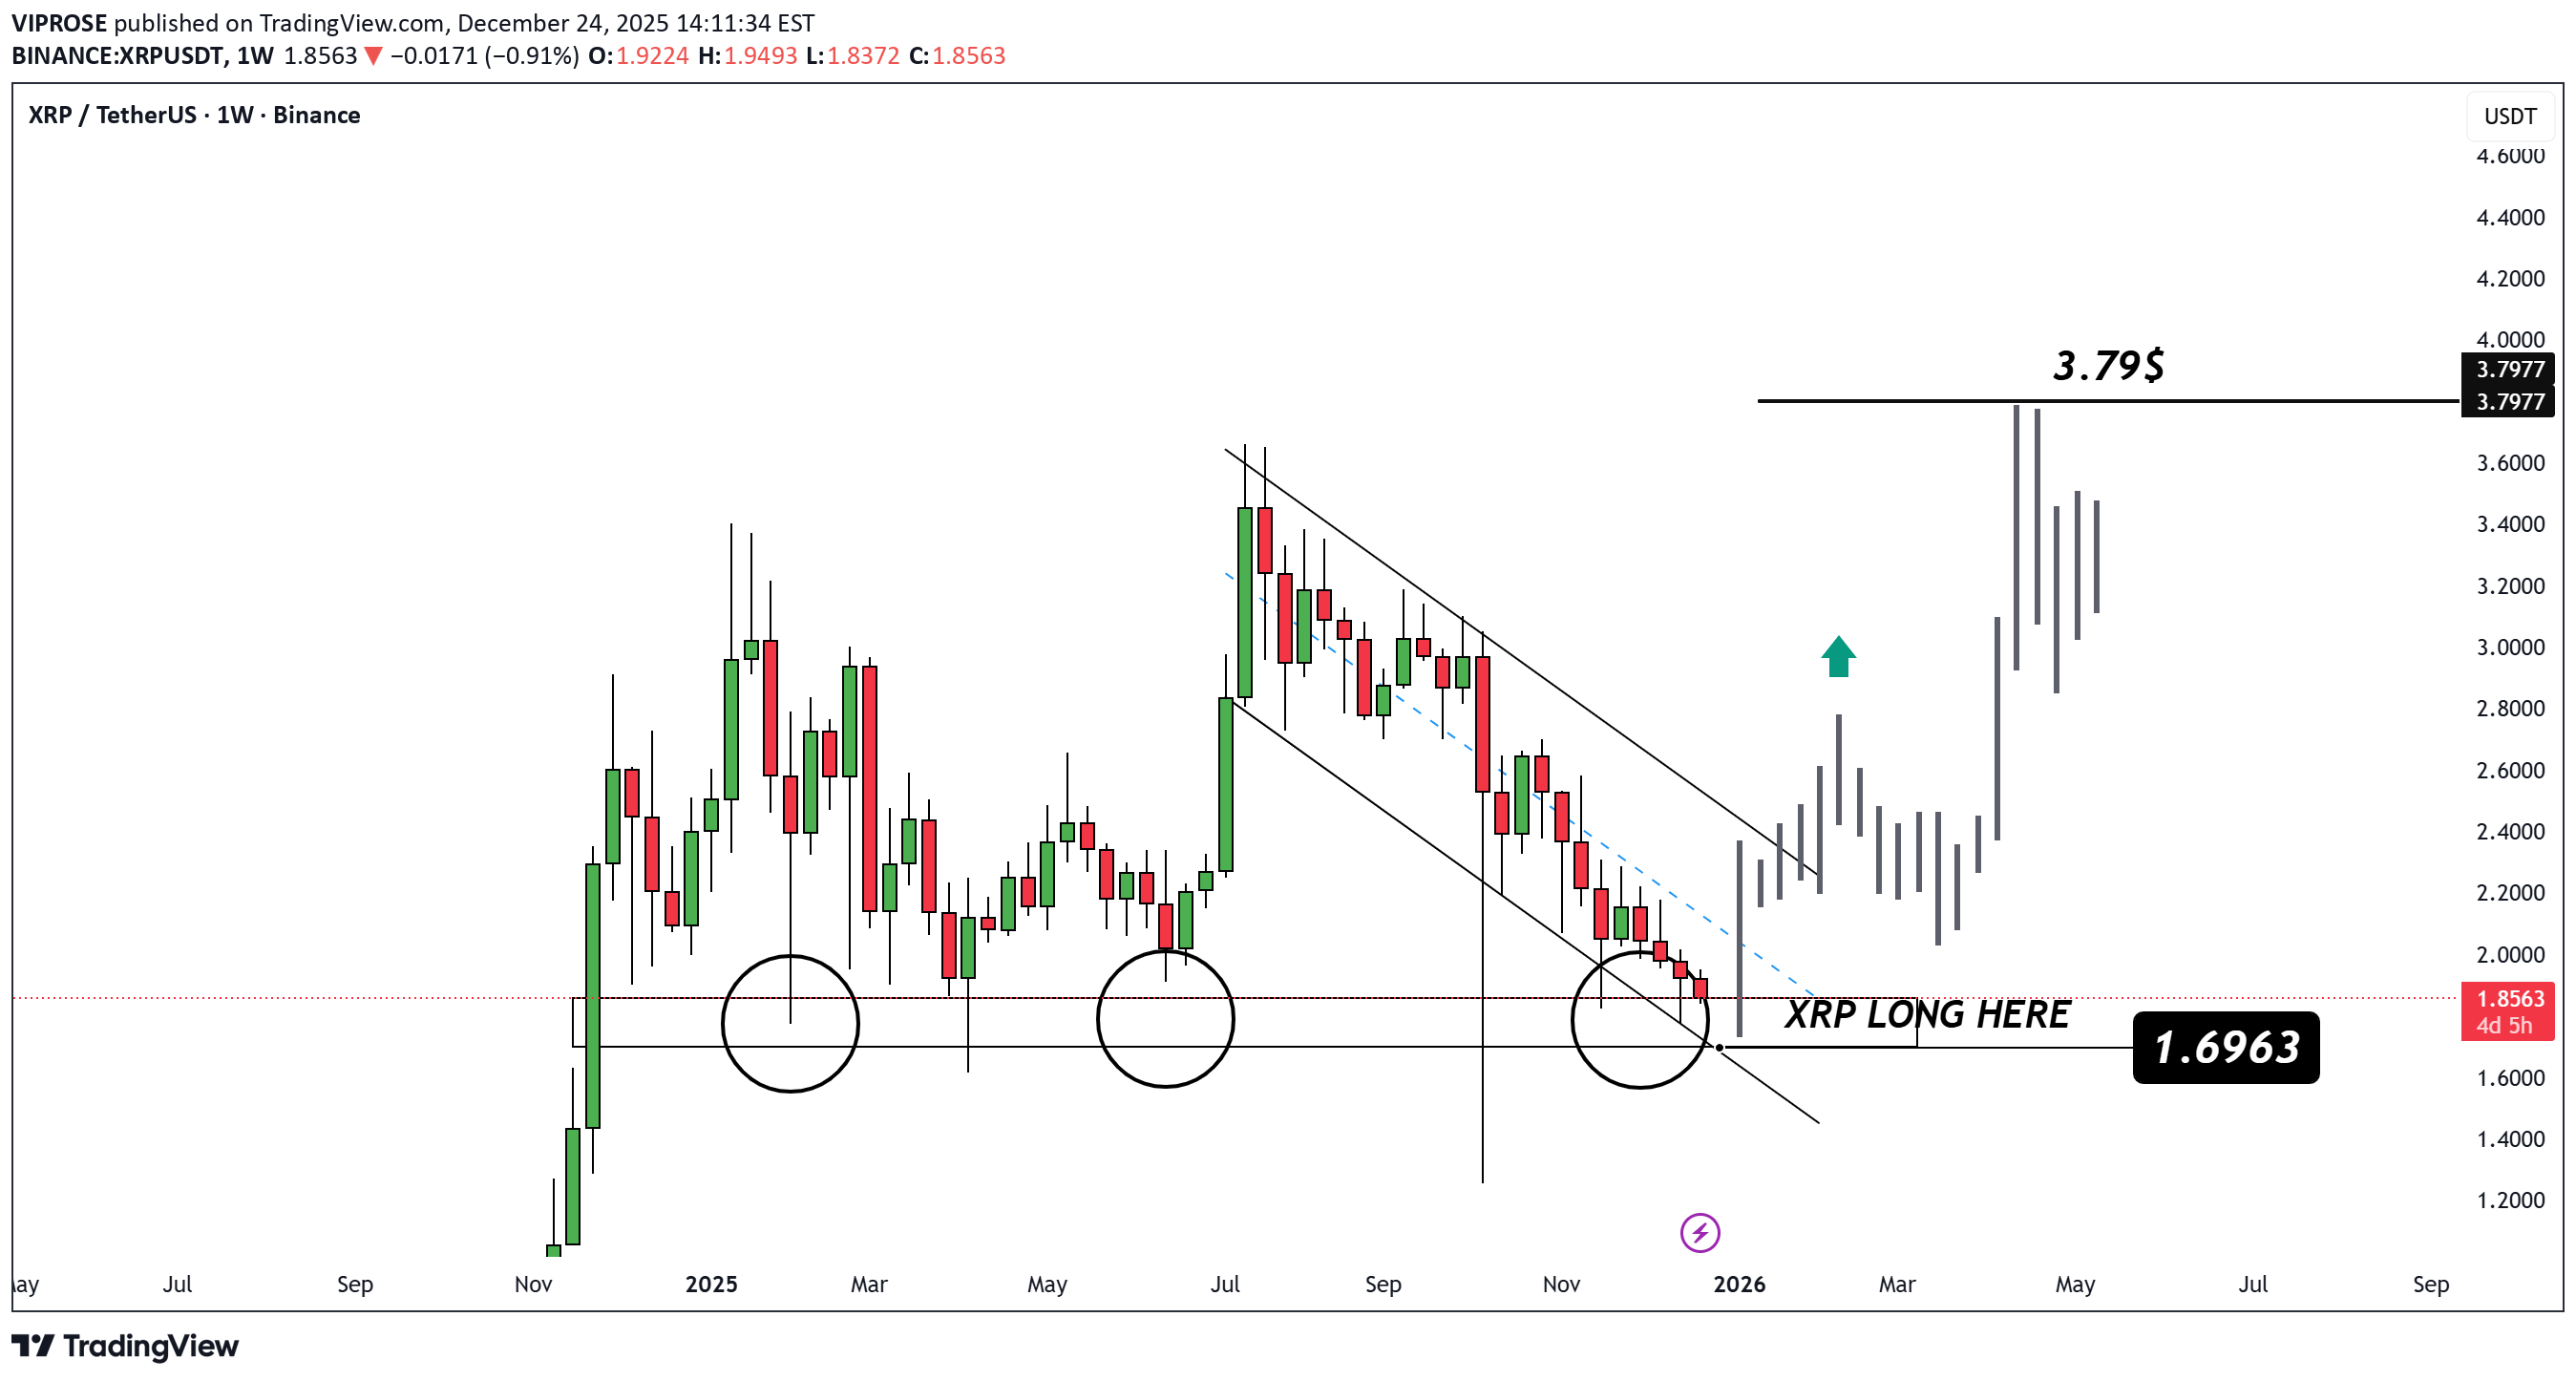
#XRP is rebounding from strong support at $1.6963, forming a triple bottom pattern. A breakout from the downtrend channel signals a possible bullish reversal. 🟢 Entry Zone: $1.69 🎯 Target: $3.79
VIPROSE
BTC Weekly Outlook – Targeting 141K in 2026?
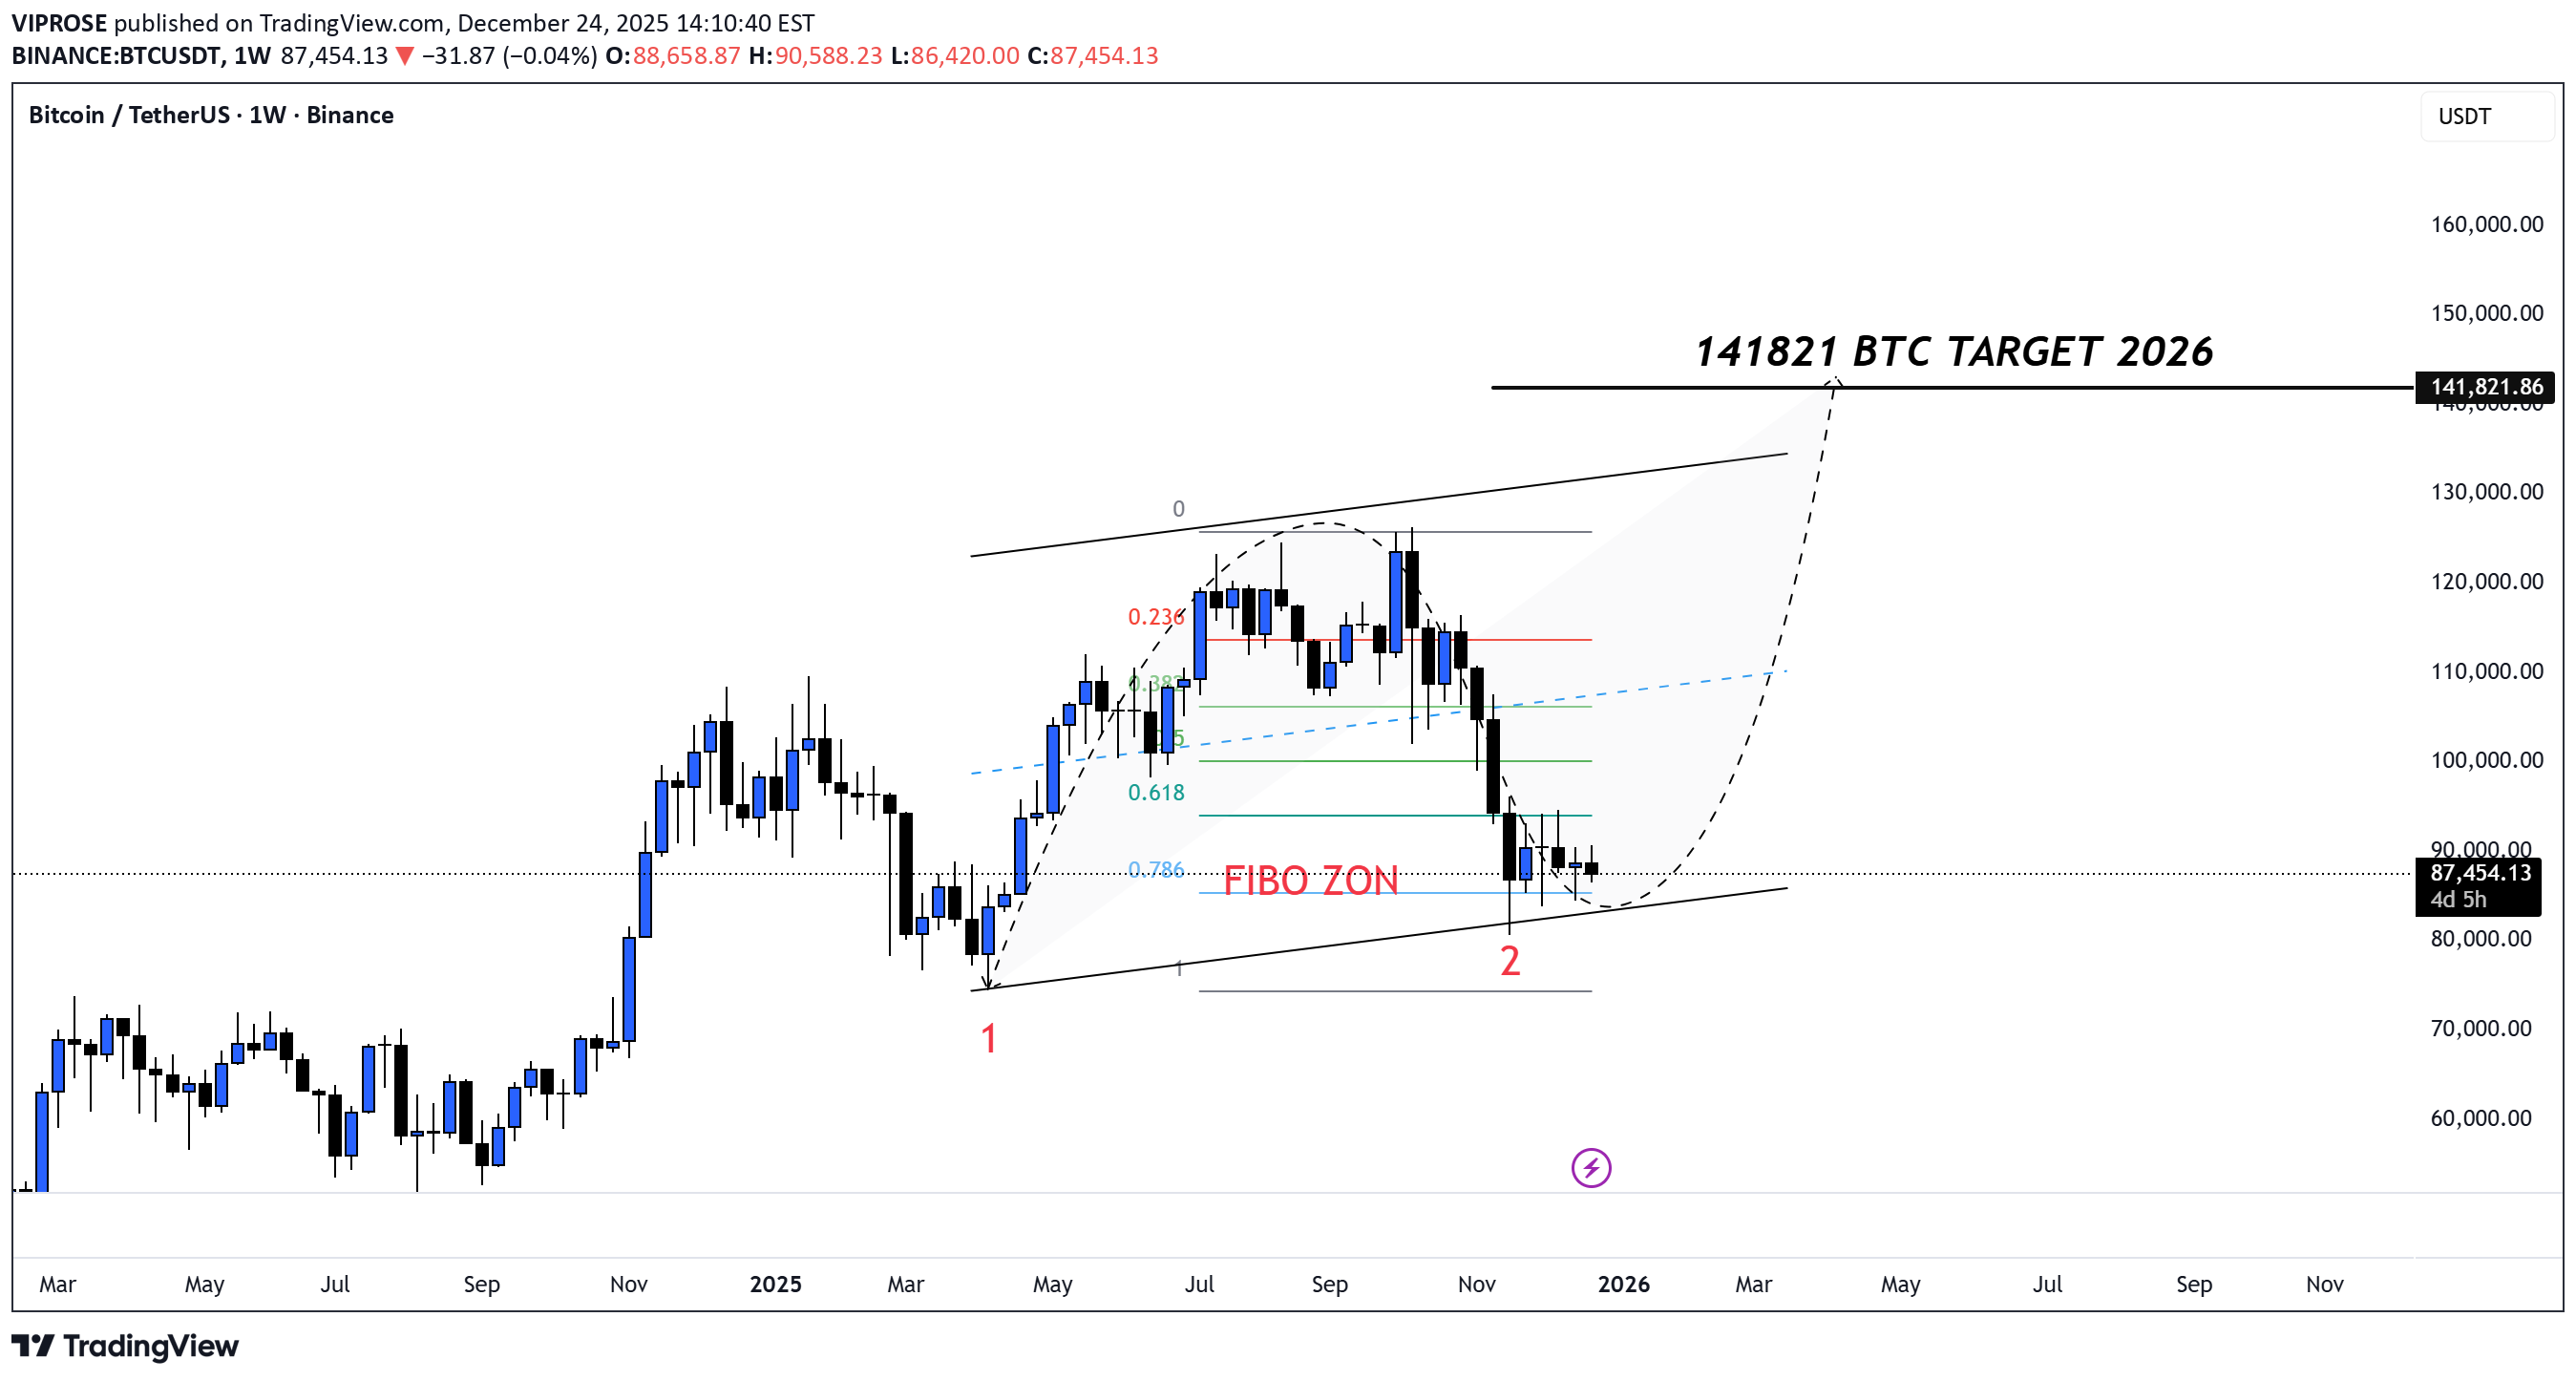
Bitcoin is currently consolidating around $87,466, testing the Fibonacci support zone (0.618–0.786) within a wide ascending channel. 🔁 If the price holds above this key level, a new impulsive wave may launch, targeting: 🎯 2026 Target: $141,821 ⚠️ All eyes on the FIBO ZONE – key turning point!
VIPROSE
محدوده طلایی بیت کوین برای ریزش بزرگ: آیا اصلاح قیمتی در راه است؟
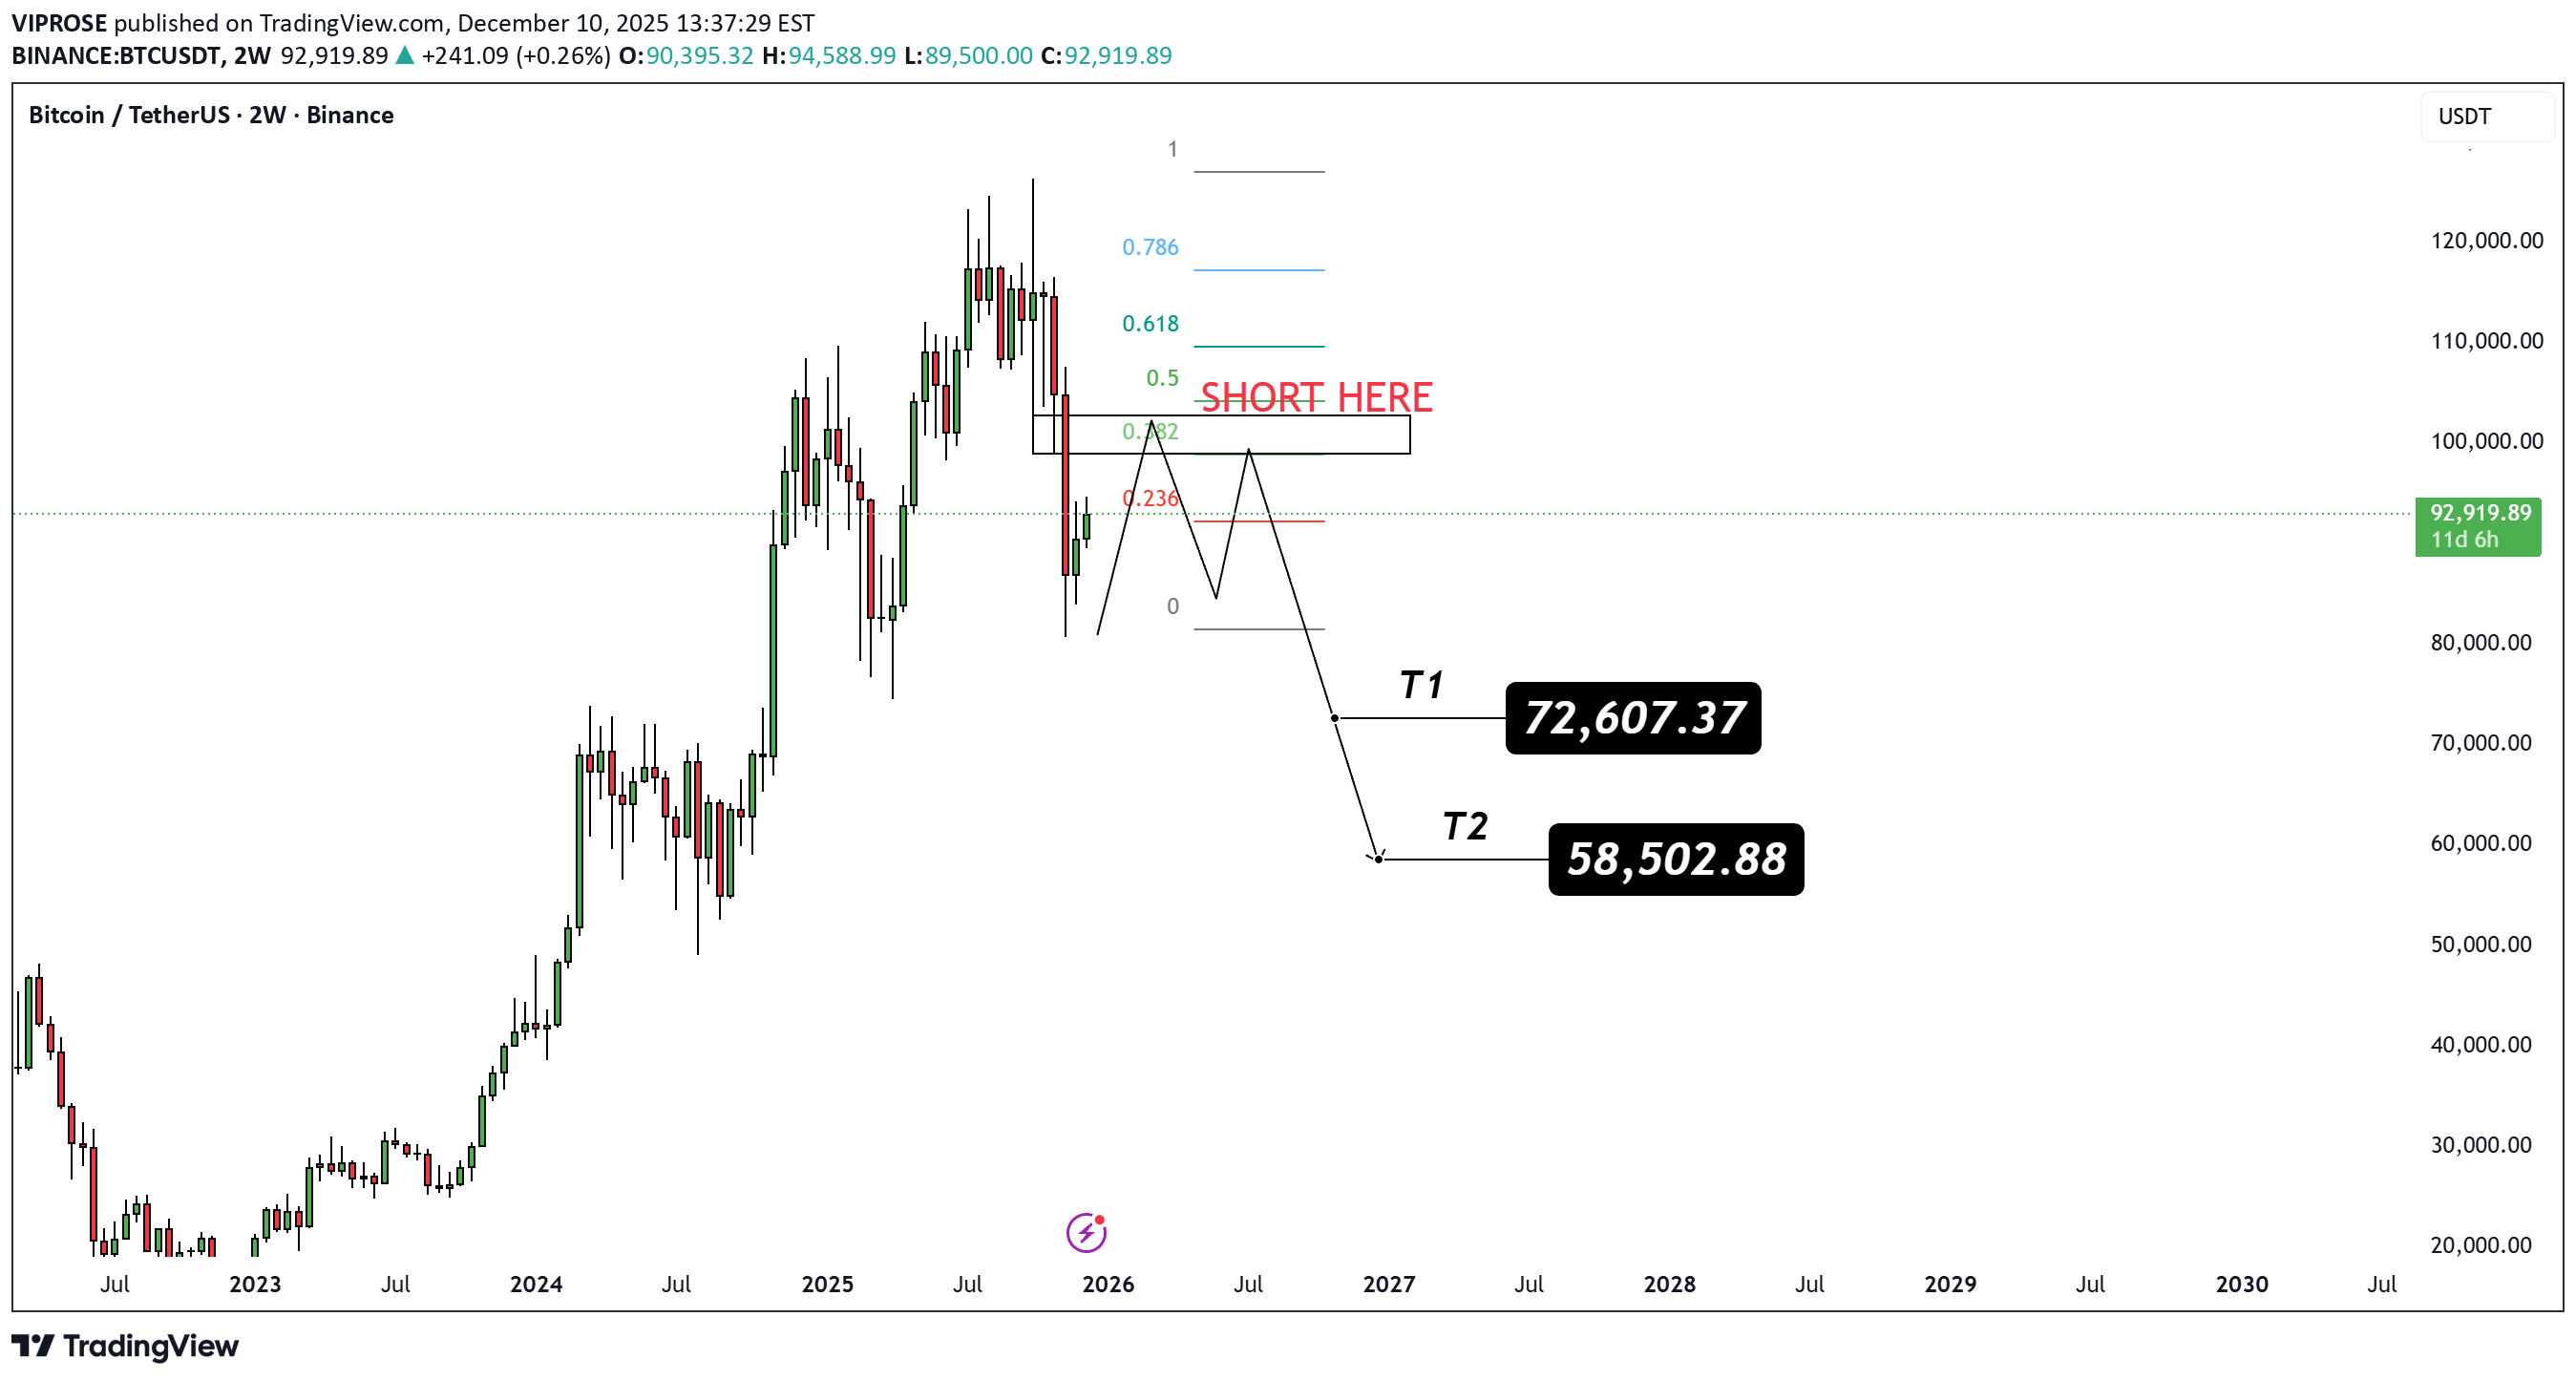
Bitcoin is approaching a strong Fibonacci confluence short zone between the 0.382–0.5 retracement, a level that previously acted as heavy resistance. A fakeout + rejection from this area can trigger a mid-cycle correction. 📌 Short Zone: $0.382 → $0.5 fib area (marked on chart) 🎯 Targets: T1 → $72,607.37 T2 → $58,502.88
VIPROSE
آماده ریزش سنگین لونا: فرصت شورتگیری با اهداف بزرگ!
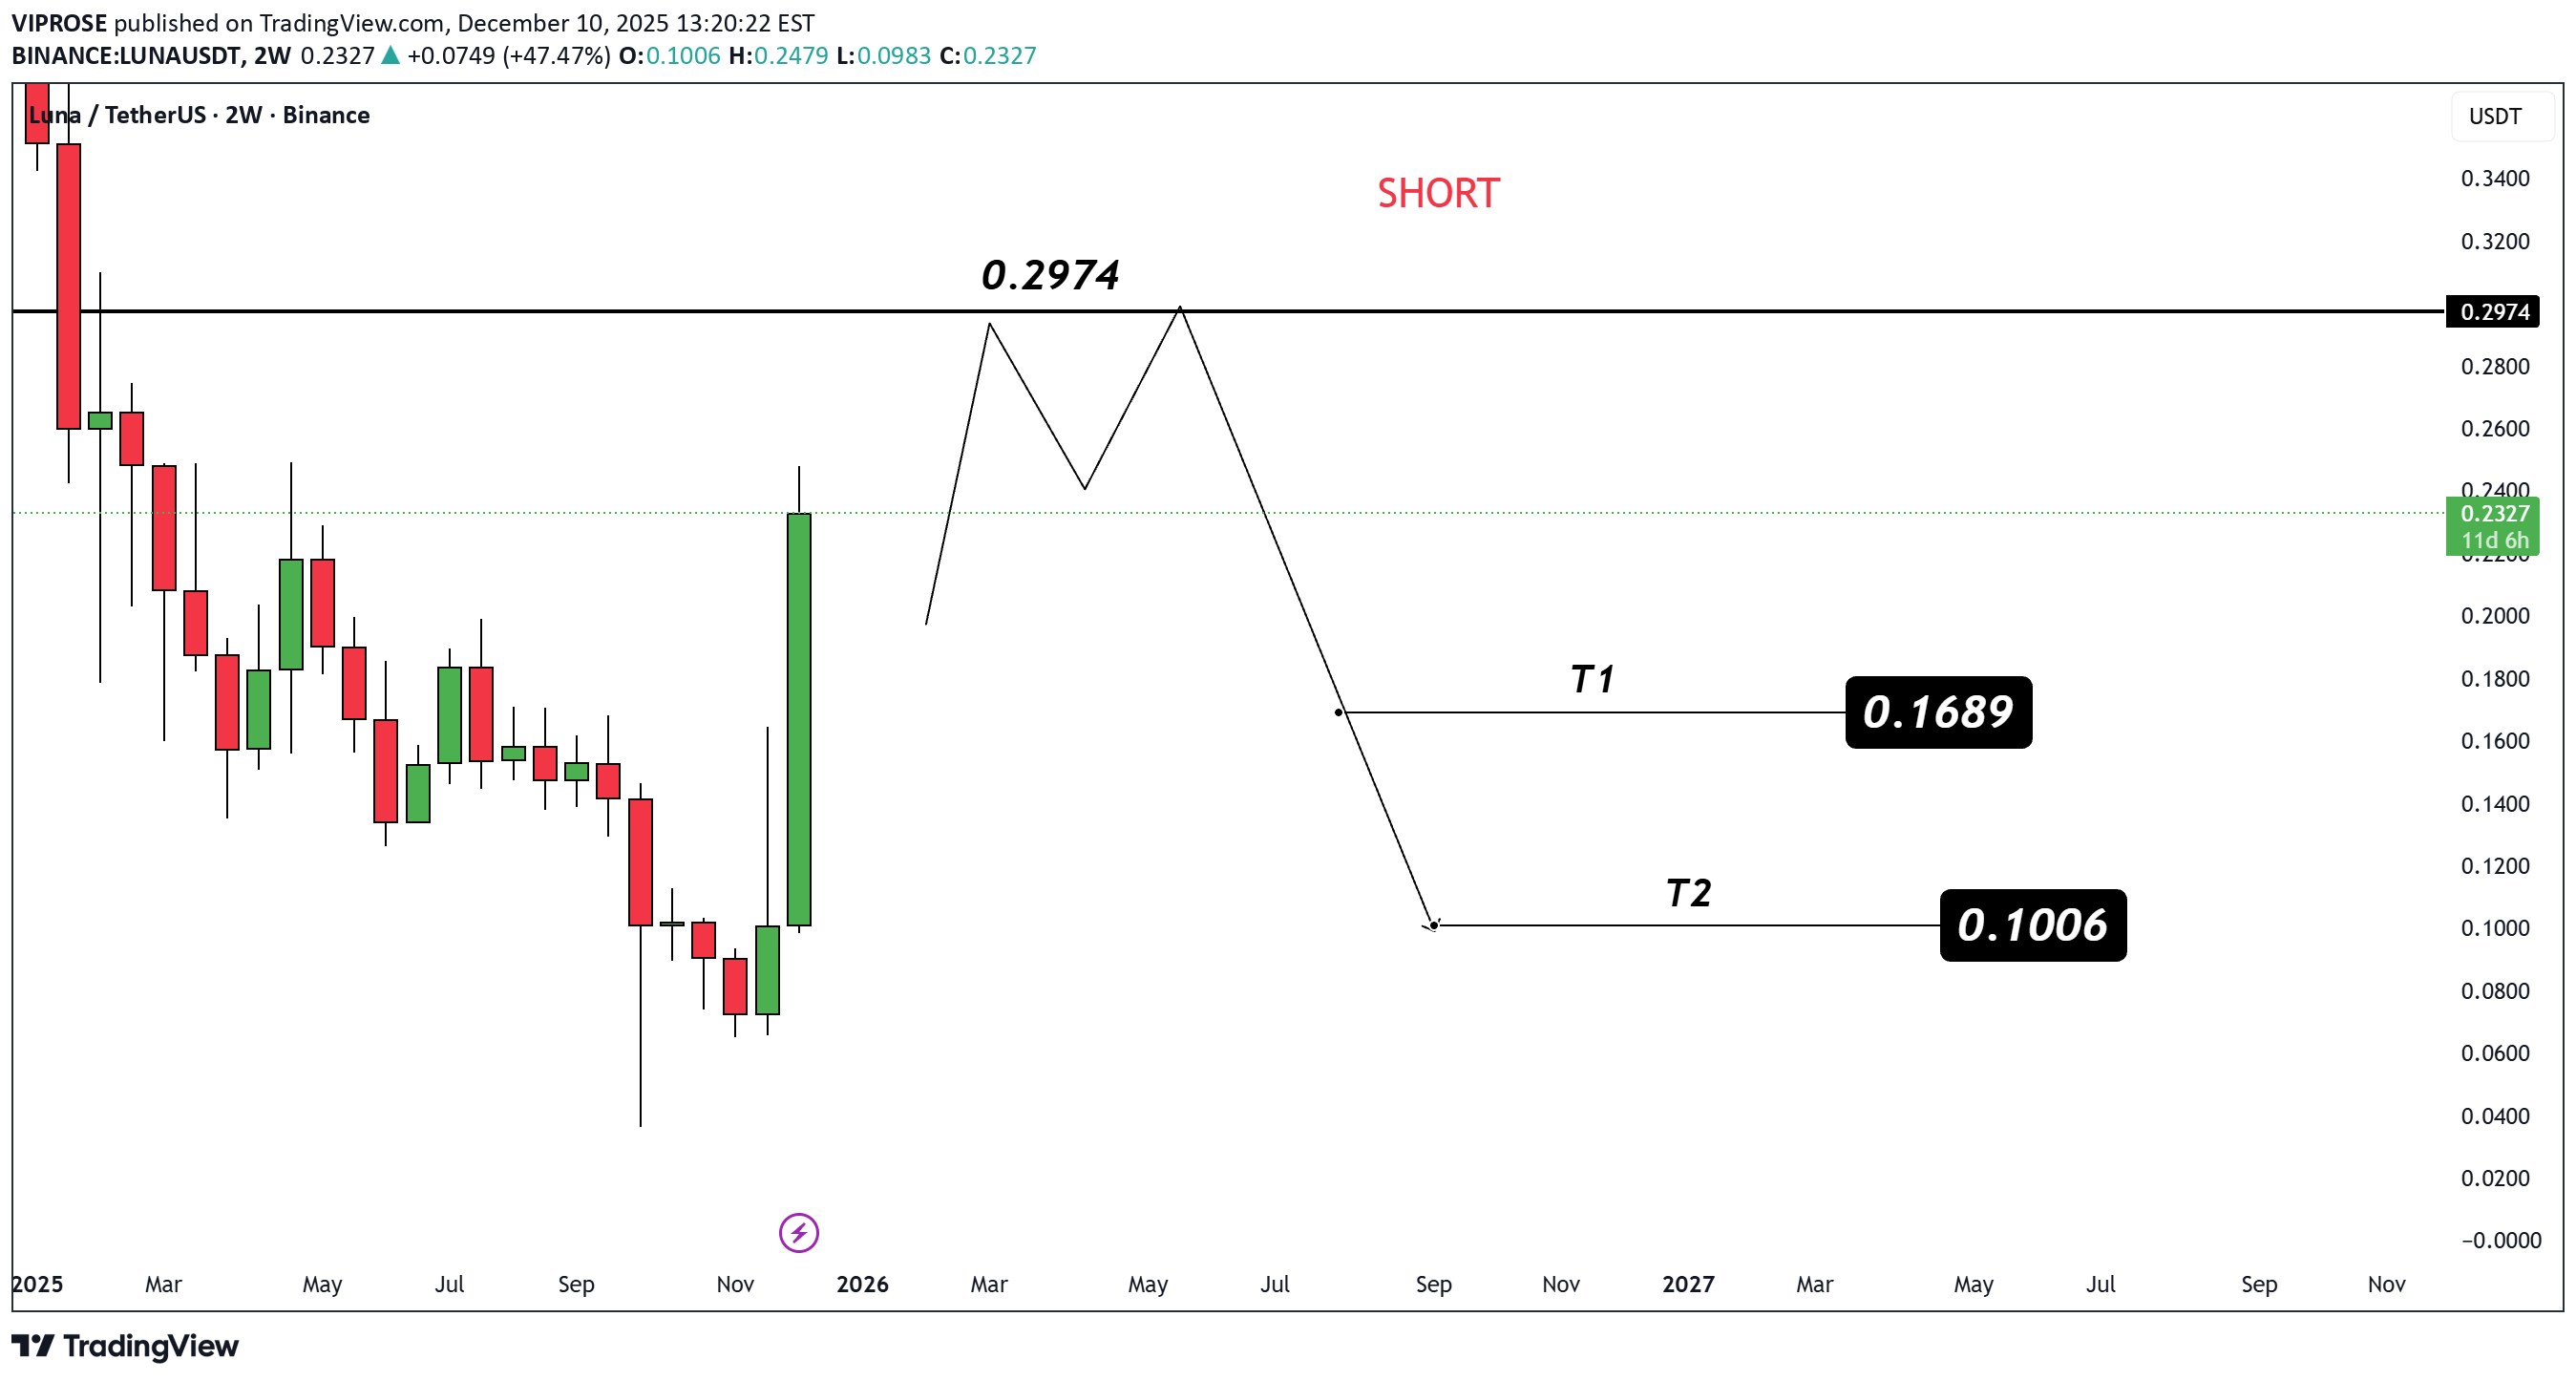
LUNA is approaching a major resistance at $0.2974, a level that has historically rejected price with strong selling pressure. A liquidity grab + rejection from this zone could trigger a multi-week correction. 🎯 Short Targets: T1 → $0.1689 T2 → $0.1006 Structure shows a clear lower-high formation before a potential breakdown — high-probability short zone ahead🚨
VIPROSE
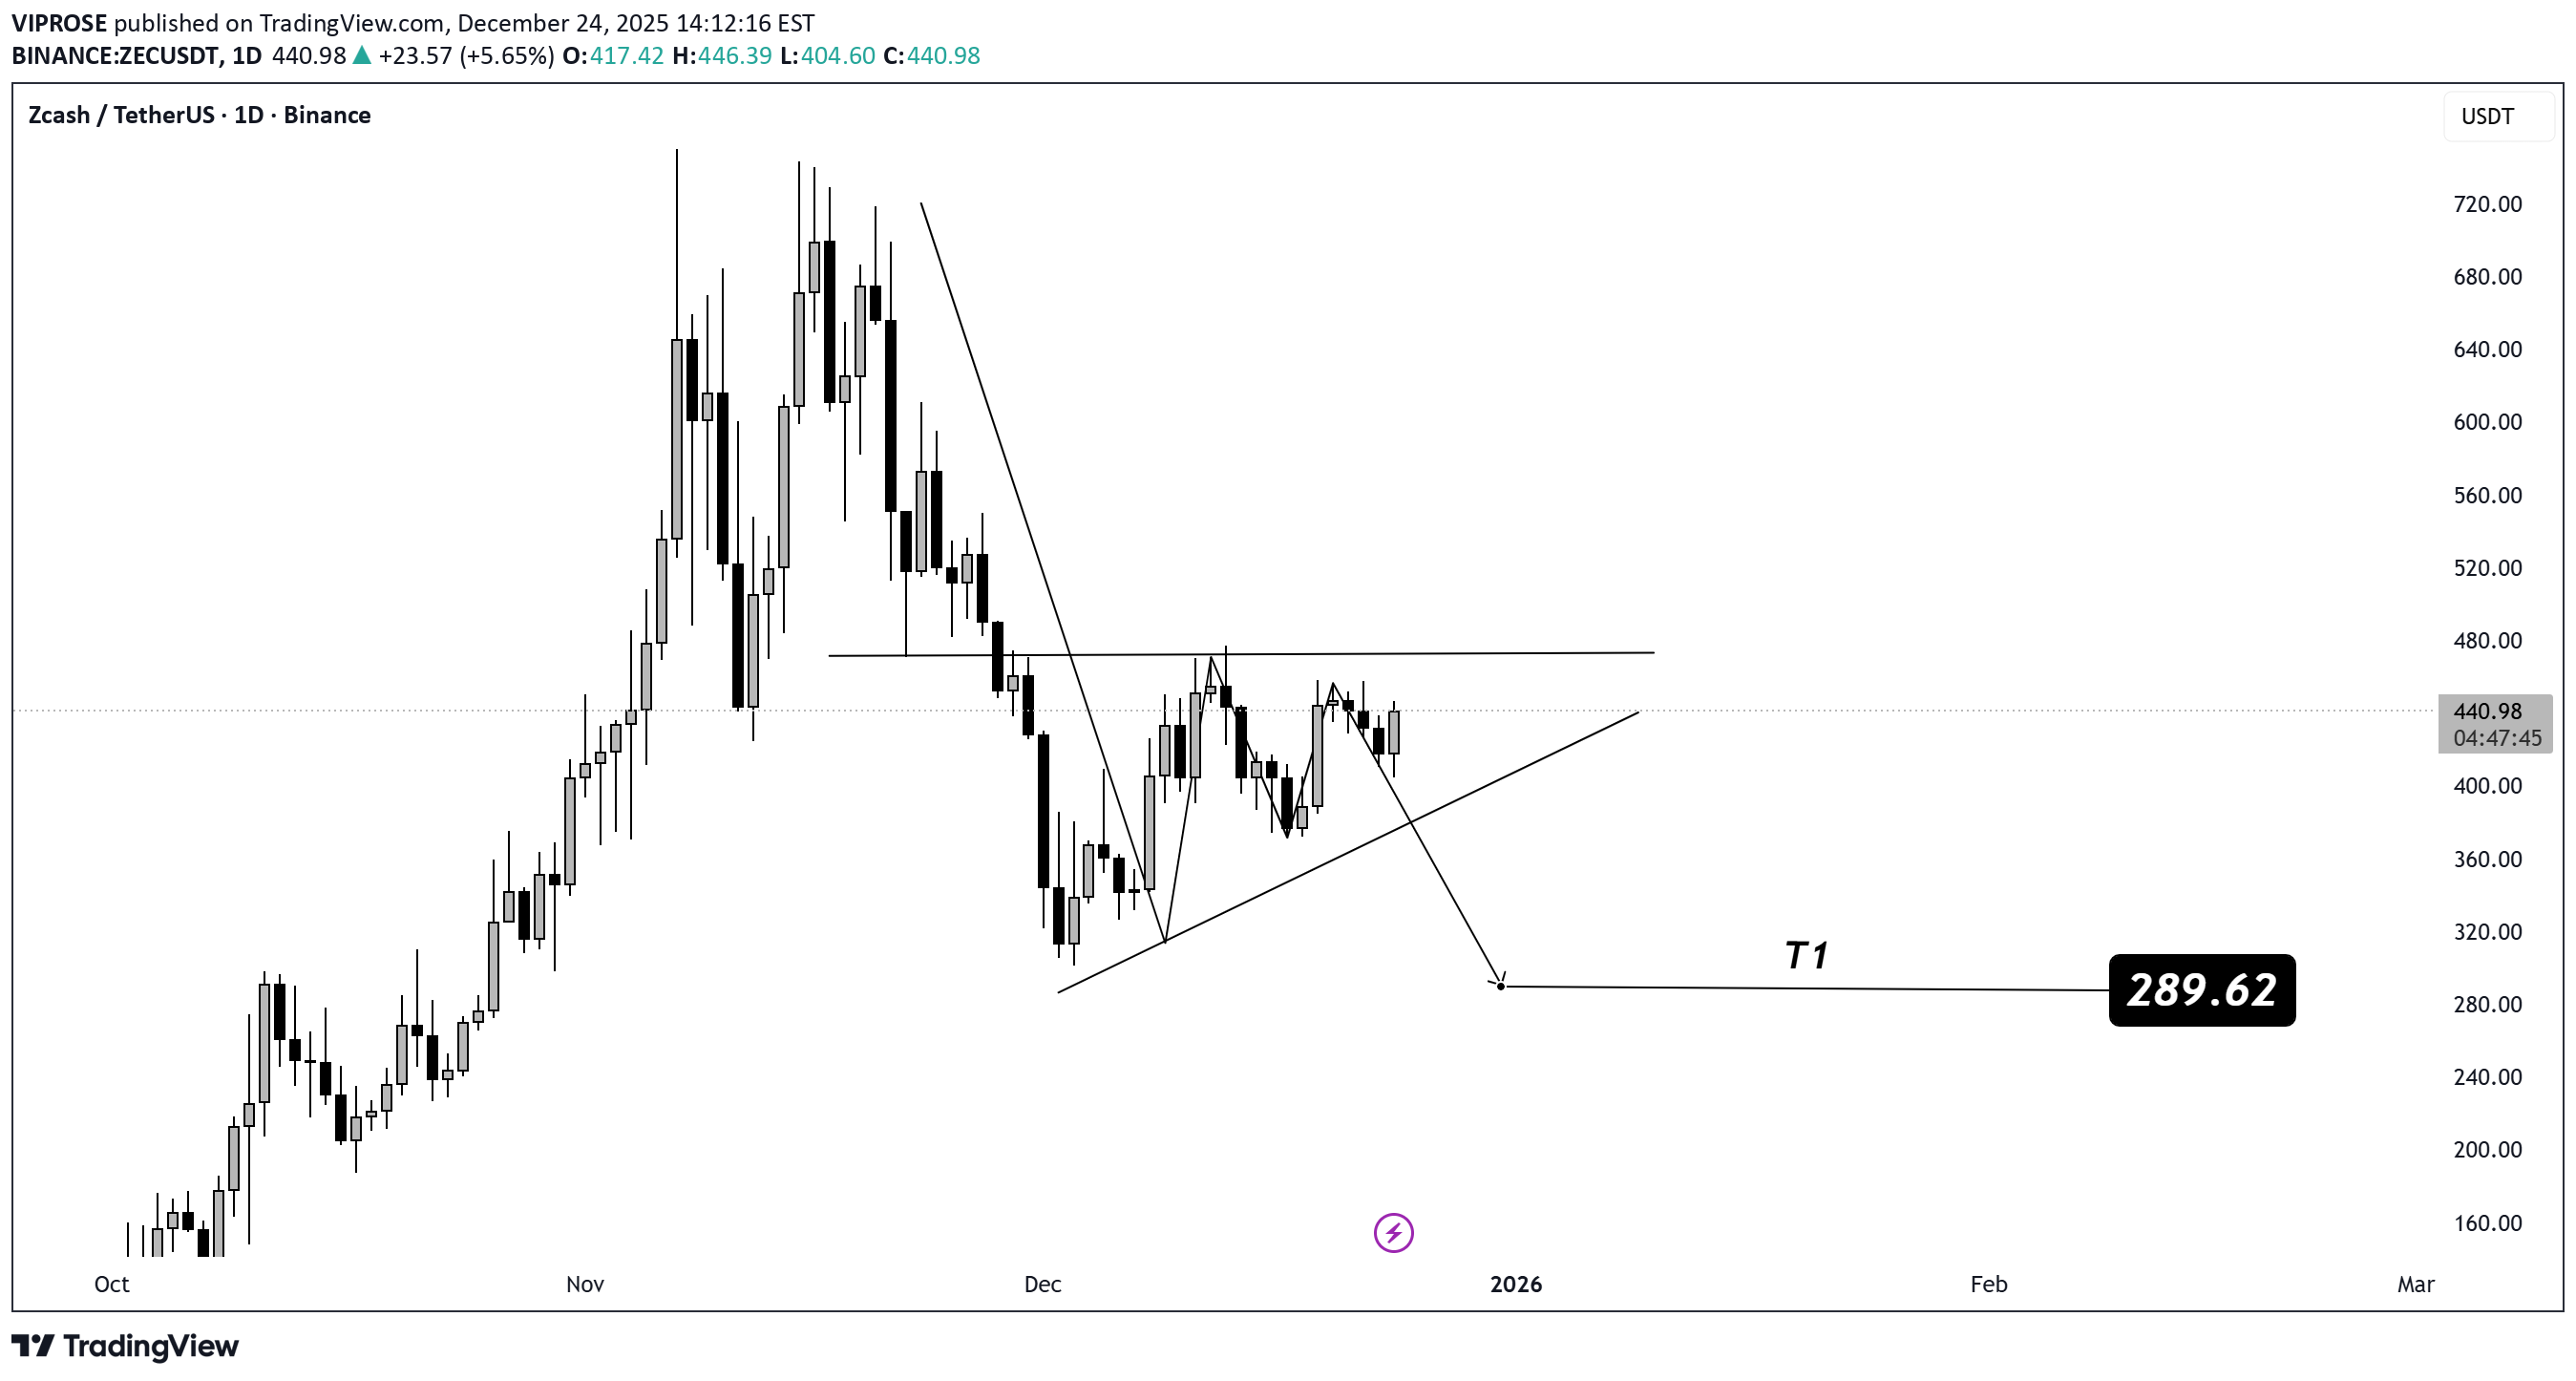
پایان سقوط Zcash: آیا رشد انفجاری در راه است؟ (تحلیل تکنیکال)
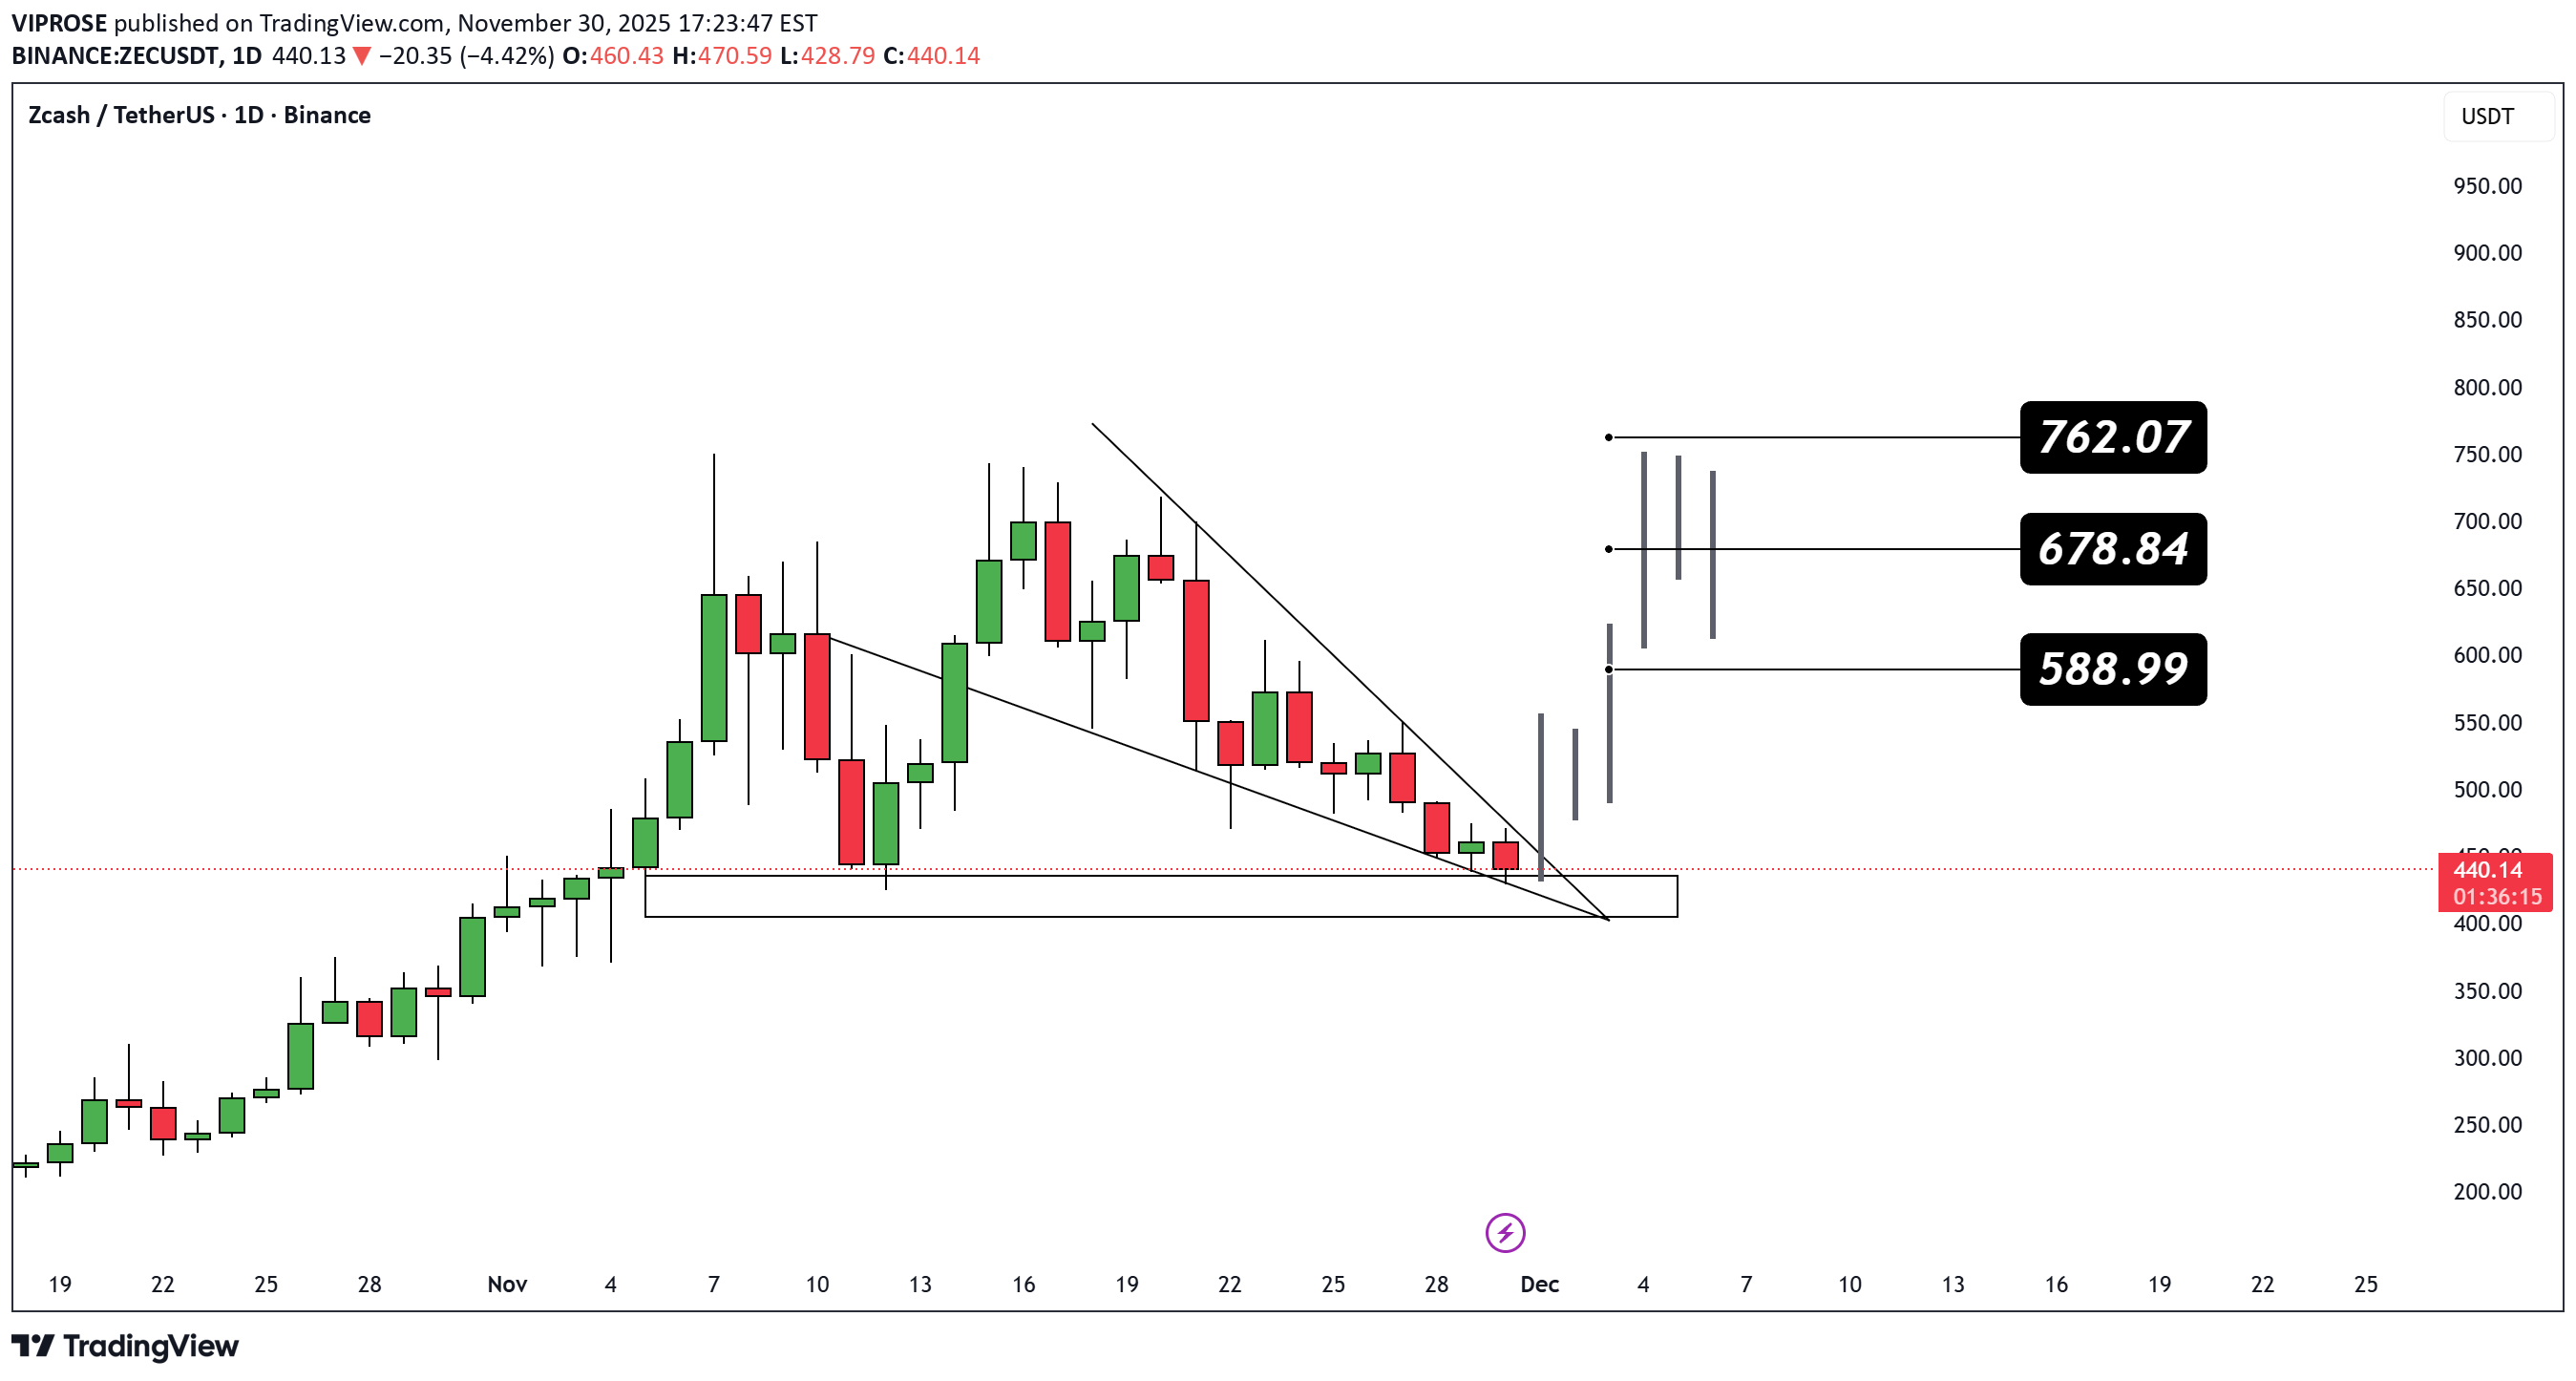
Zcash is completing a falling wedge + demand zone touch, a classic bullish reversal setup📉➡️📈 As long as price holds the support box, upside continuation becomes highly likely. 🎯 Targets: • $588.99 • $678.84 • $762.07
Disclaimer
Any content and materials included in Sahmeto's website and official communication channels are a compilation of personal opinions and analyses and are not binding. They do not constitute any recommendation for buying, selling, entering or exiting the stock market and cryptocurrency market. Also, all news and analyses included in the website and channels are merely republished information from official and unofficial domestic and foreign sources, and it is obvious that users of the said content are responsible for following up and ensuring the authenticity and accuracy of the materials. Therefore, while disclaiming responsibility, it is declared that the responsibility for any decision-making, action, and potential profit and loss in the capital market and cryptocurrency market lies with the trader.