
JASMY
Jasmy
| تریدر | نوع سیگنال | حد سود/ضرر | زمان انتشار | مشاهده پیام |
|---|---|---|---|---|
No results found. | ||||
Price Chart of Jasmy
سود 3 Months :
خلاصه سیگنالهای Jasmy
سیگنالهای Jasmy
Filter
Sort messages by
Trader Type
Time Frame

ulrichniederhausser
جسمی (JASMY) آماده پرواز! موج سوم انفجاری در راه است؟
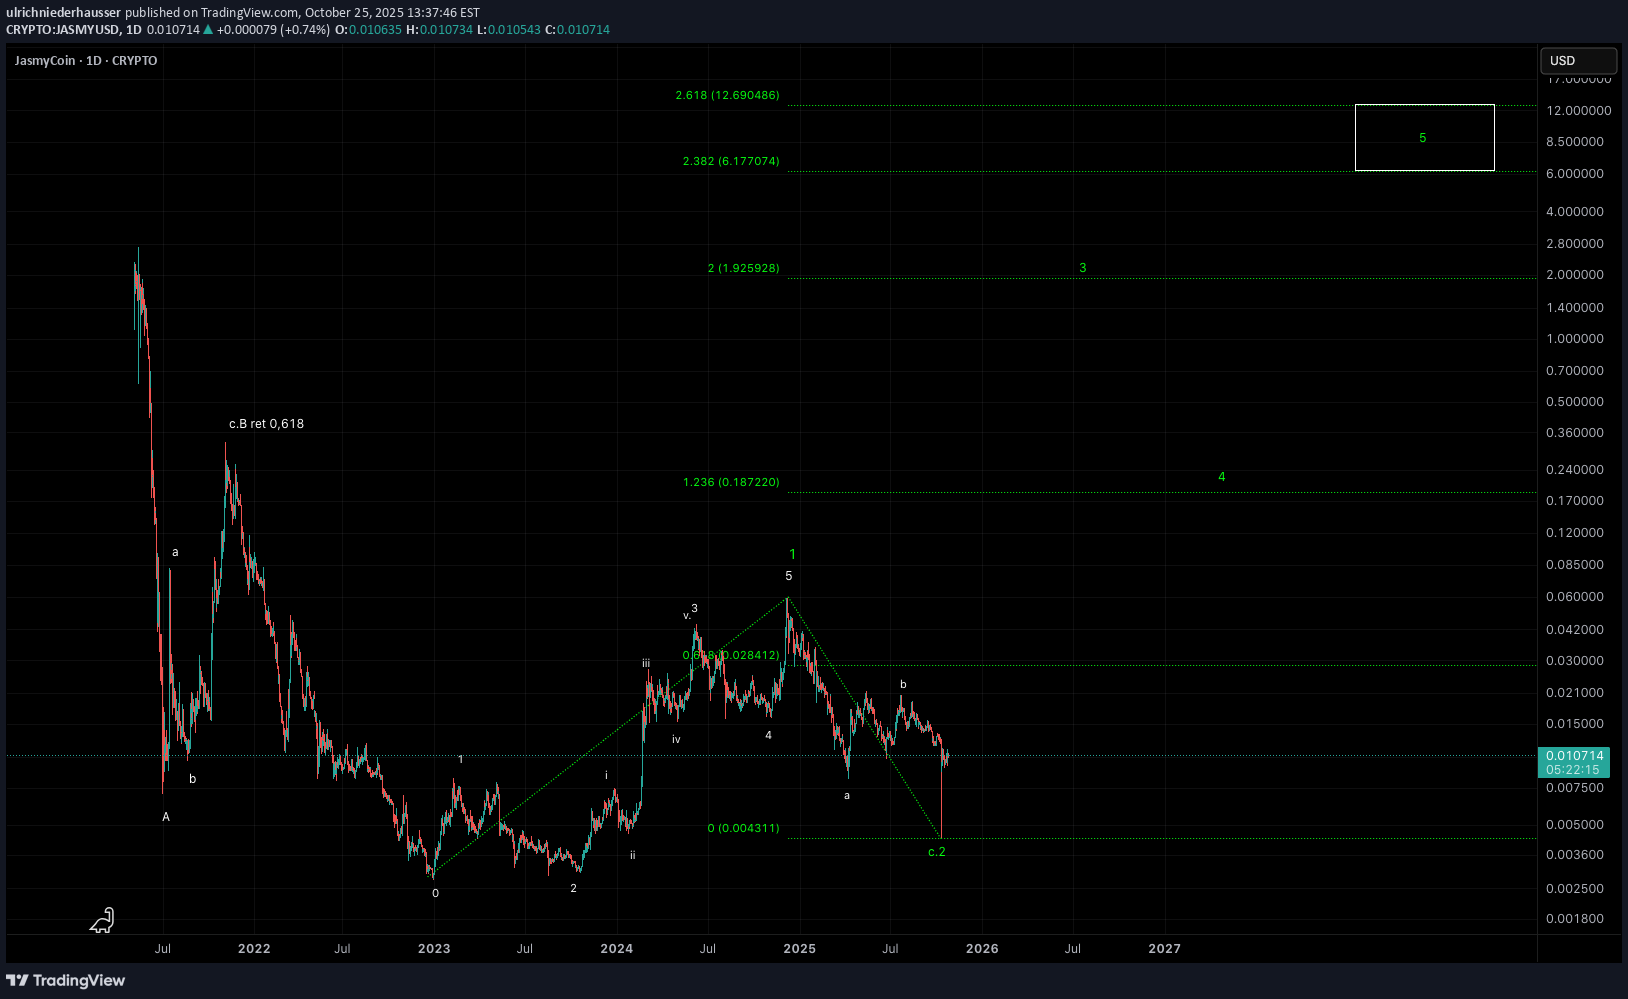
Everywhere we look at, JASMY has a textbook structure. First of all an ABC correction to bottom, then a beautiful wave 1, next a perfect wave 2. The chart shows a potential wave 3 in the making.

Bartleby_the_Trader
آیا جاسم کوین (JASMY) در آستانه یک رالی صعودی بزرگ است؟
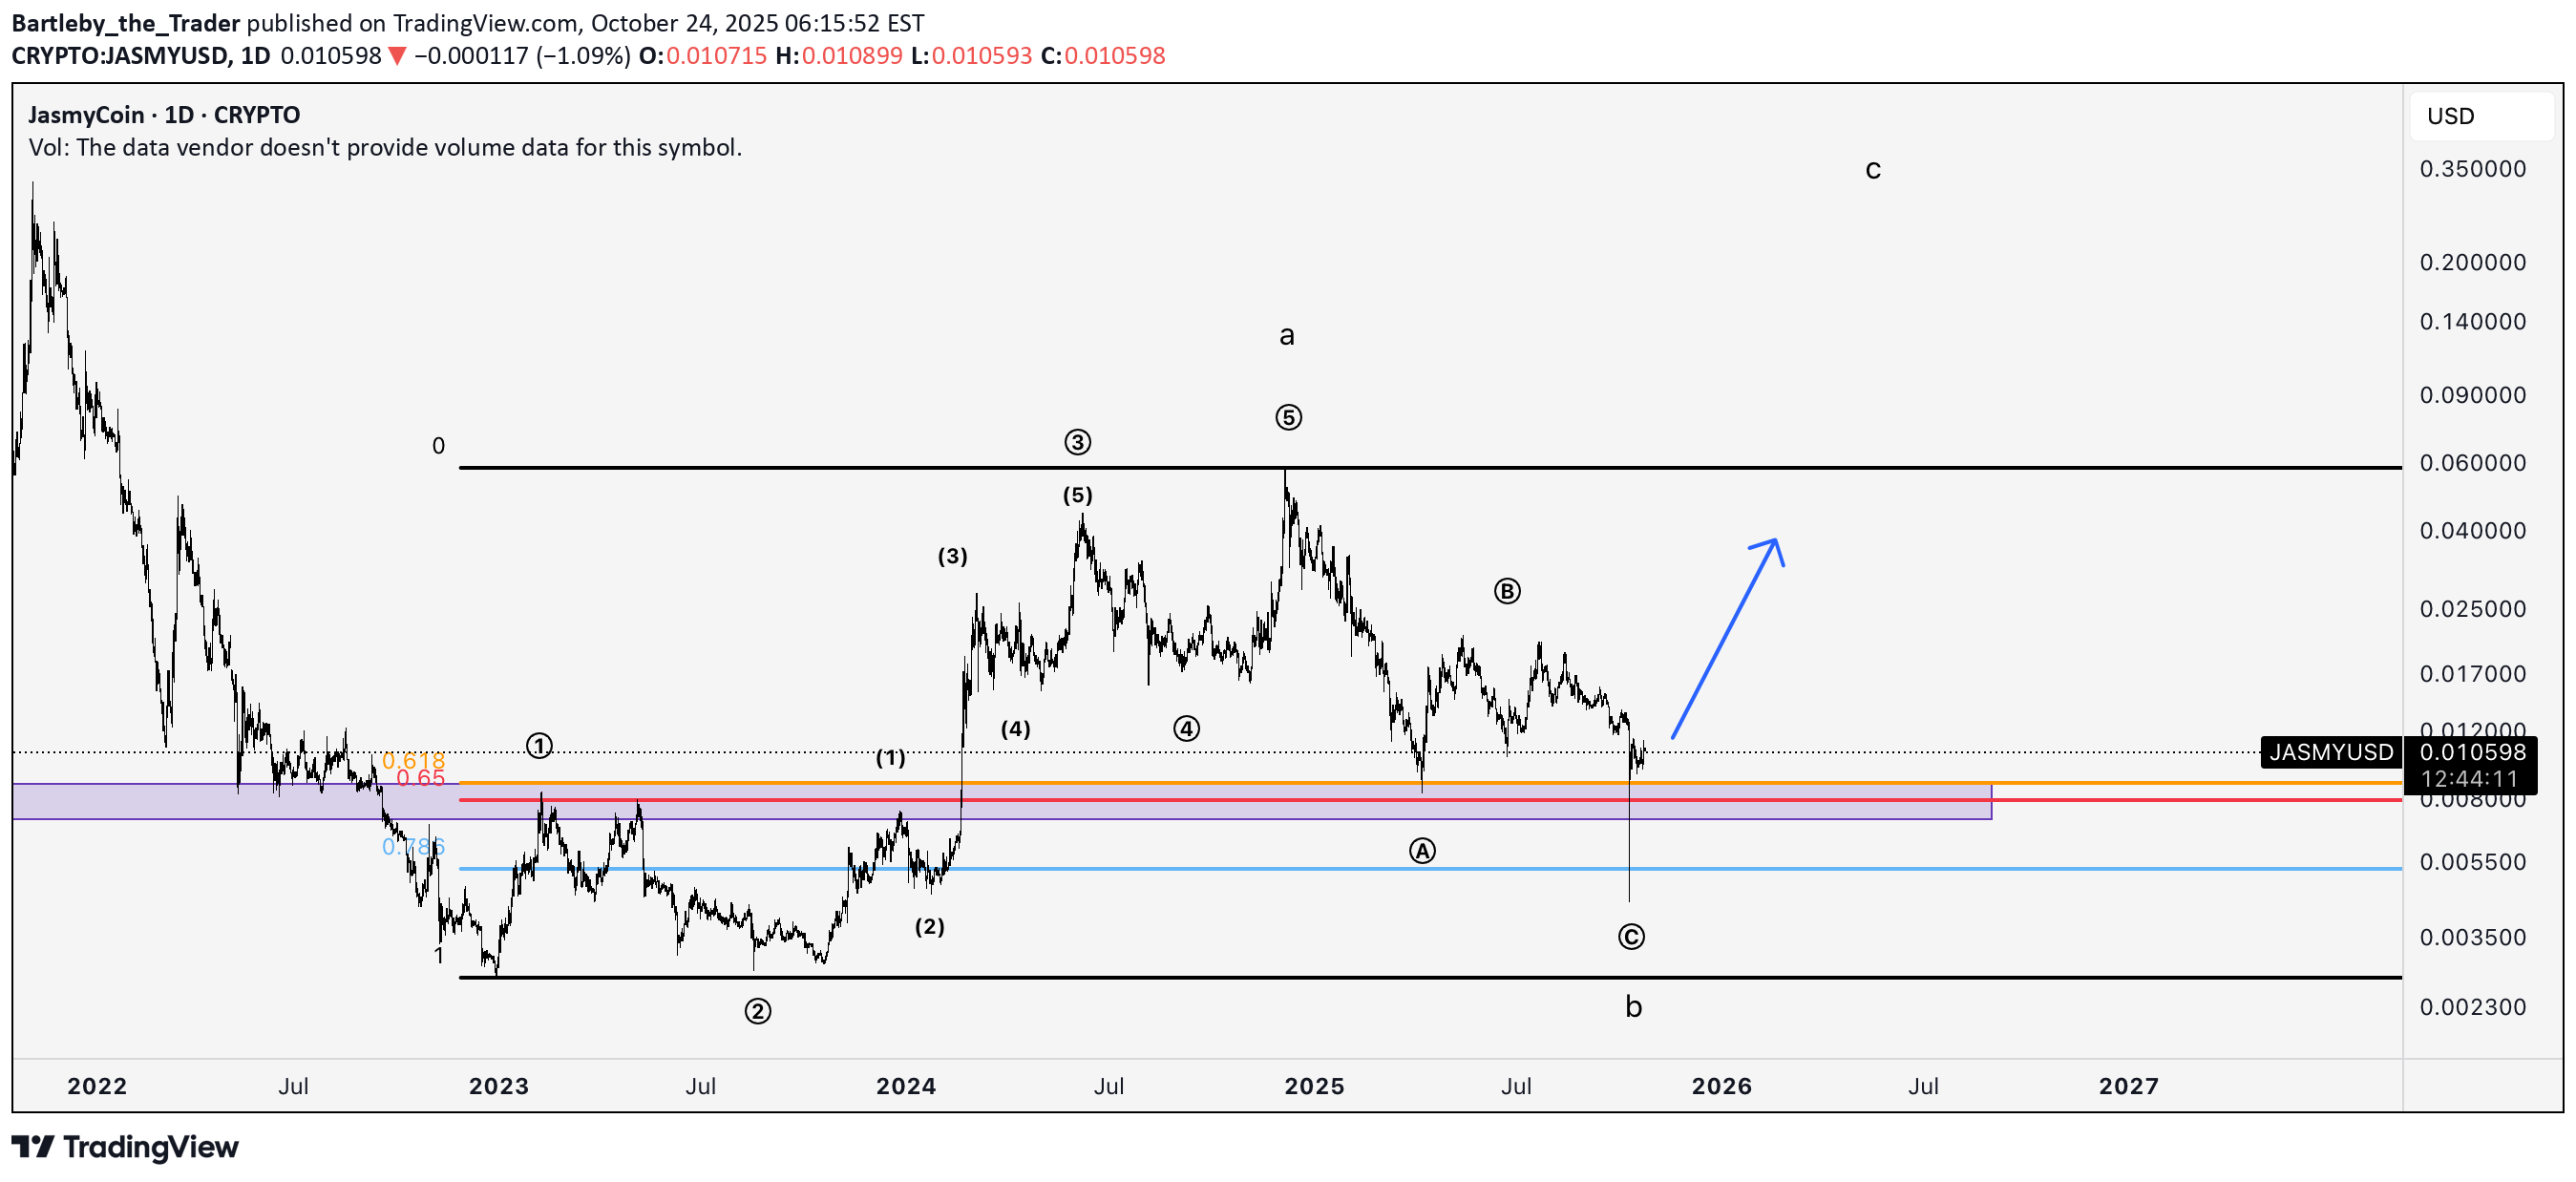
The crypto market doesn’t actually look too bad after the leverage flush on October 10. JasmyCoin, a cryptocurrency hovering around the 100th spot in market capitalization rankings, may be starting a new upward sequence. The Elliott wave structures are textbook examples. Although not all exchanges saw a deep penetration of the 0.0040–0.0080 zone on October 10, the drop can still be considered a legitimate subwave C of wave 2. Good luck! Coinbase chart for comparison:

Bithereum_io
پیشبینی قیمت جاسم: مثلث نزولی در نمودار روزانه و اهداف صعودی هیجانانگیز!
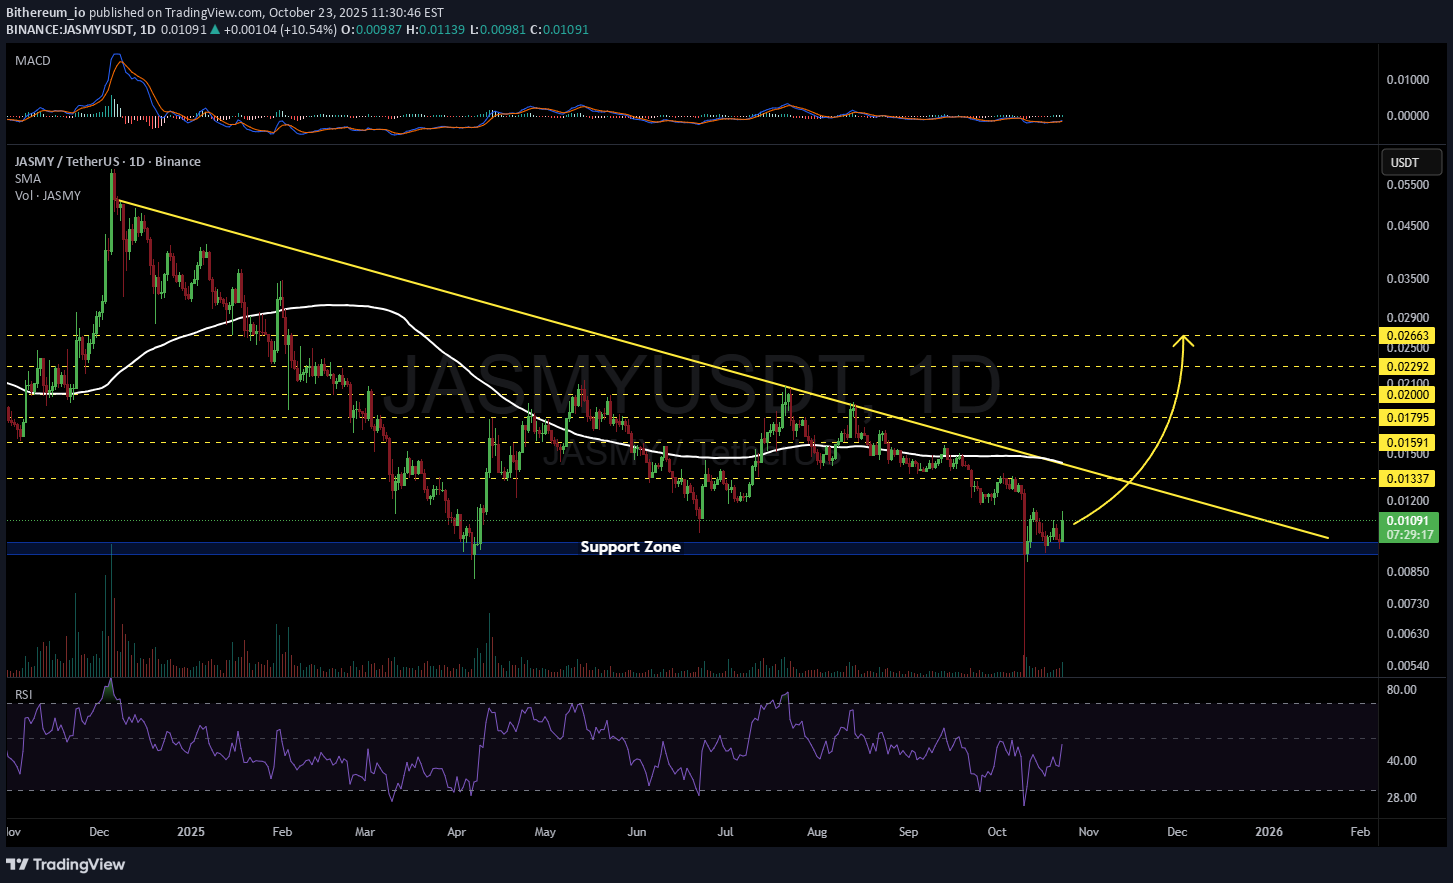
#JASMY is moving inside a descending triangle on the daily chart. In case of a breakout above the pattern, the potential targets are: 🎯 $0.01337 🎯 $0.01591 🎯 $0.01795 🎯 $0.02000 🎯 $0.02292 🎯 $0.02663 ⚠️ Always remember to use a tight stop-loss and maintain proper risk management.

LearningForexB2
تحلیل سرنوشتساز قیمت جاسمی (JASMY): آیا هدف 0.088 واقعیت مییابد؟
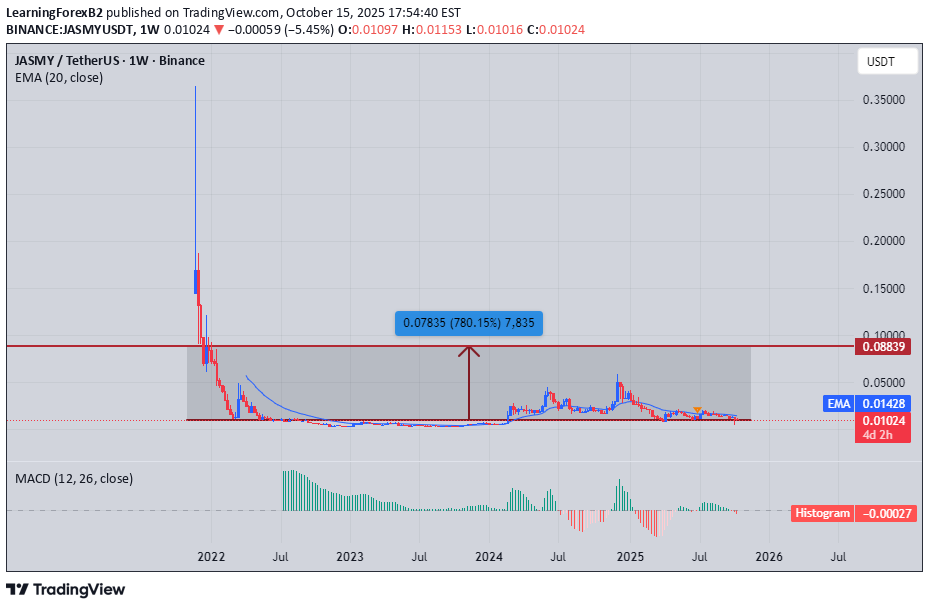
Hello Friends! I hope J JASMY will touch the "0.058" level then it can make some corrections. After her correction, it has more chances to touch the "0.088" level. But if it create counter setup, then close it instant. Do you have any questions, suggestions, or feedback? Then write a comment or private chat. If you need any help, info, or analysis. Then knock me without any hesitation. …Thank you…

CryptocurrencyBlot
رمز ارز یاسی (JASMY)؛ آیا این توکن ژاپنی از سلطه بیتکوین رها خواهد شد؟

Trends of losing all together is such a scam. Crypto does not have to lose in series. The fact that there are very few parallel trends of cryptocurrency stock trading is a presentation of holders across the board that own all tokens and coins selling at the same time like some mass event exodus from cryptocurrency. The losses that are incurred seem to follow bitcoin whether it be by fear of centralized holders who see Bitcoin falling and fear their own investment to lose or if it is directly correlated to outside interests like whales being more in control of the price. The fact is so many cryptocurrency brands do not offer a great deal of circulating supply percentage of investors alone. The drop in prices for a lot of companies cannot have as much to do with investors as insiders of the companies. Cryptocurrency being interconnected by chain should not mean interconnectivity by trade. I thought cryptocurrency would be more freeing compared to the stock market seeing how the DOW price lifts and dips often introduce variables that interfere with the prices of many other major companies. Cryptocurrency, will it ever be independent of the factors of businesses, politics, and outside interests. I'm sure there are a lot of people talking about the connection between the government in the USA and the price of crypto. I'm not sure I care to believe that because BTC is international worldwide everyone. If not long then what? Why should I ever believe the price should go down. I want prices to increase into feasible areas of growth. The news said Japan is doing great on the news of the new leadership so why not Jasmy? Has japan accepted Jasmy as the Bitcoin of Japan? The most popular crypto in japan is the same as the most popular crypto in most places. There are exceptions where certain regions prefer specific altcoins or tokens including trending topics that do or don't favor the groups of people in specific differing regions. Japan is not entirely the same as Denmark and Denmark is not entirely the same as Canada's self interests. People are mostly the same around the world and they all love the major coins, chains, tokens, and meme styles. Variables of interest that determine regionalisms are highly focuses in areas that are less likely to be understood without doing extensive research into the topic of regional impacts on cryptocurrency investment as research. Clearly, Japan is not like USA. When I see memes and tokens created to provide parody, deprecating humor, and other ideas, because I do not know the region all I know is that sometimes the ideas go over my head because I'm in tune with the perspectives.

CrocoCrypto


Martechnic
آیا جاسمِی (JASMY) در حال پایان دادن به دوره انباشت وایکاف است؟ مراحل بعدی چه خواهد بود؟

Question is whether we still need a wick lower to form a spring, or are we following the projected path like displayed in the image?

Crypto-Adda_Official
$JASMY Breakdown Bearish Symmetrical Triangle in 1W
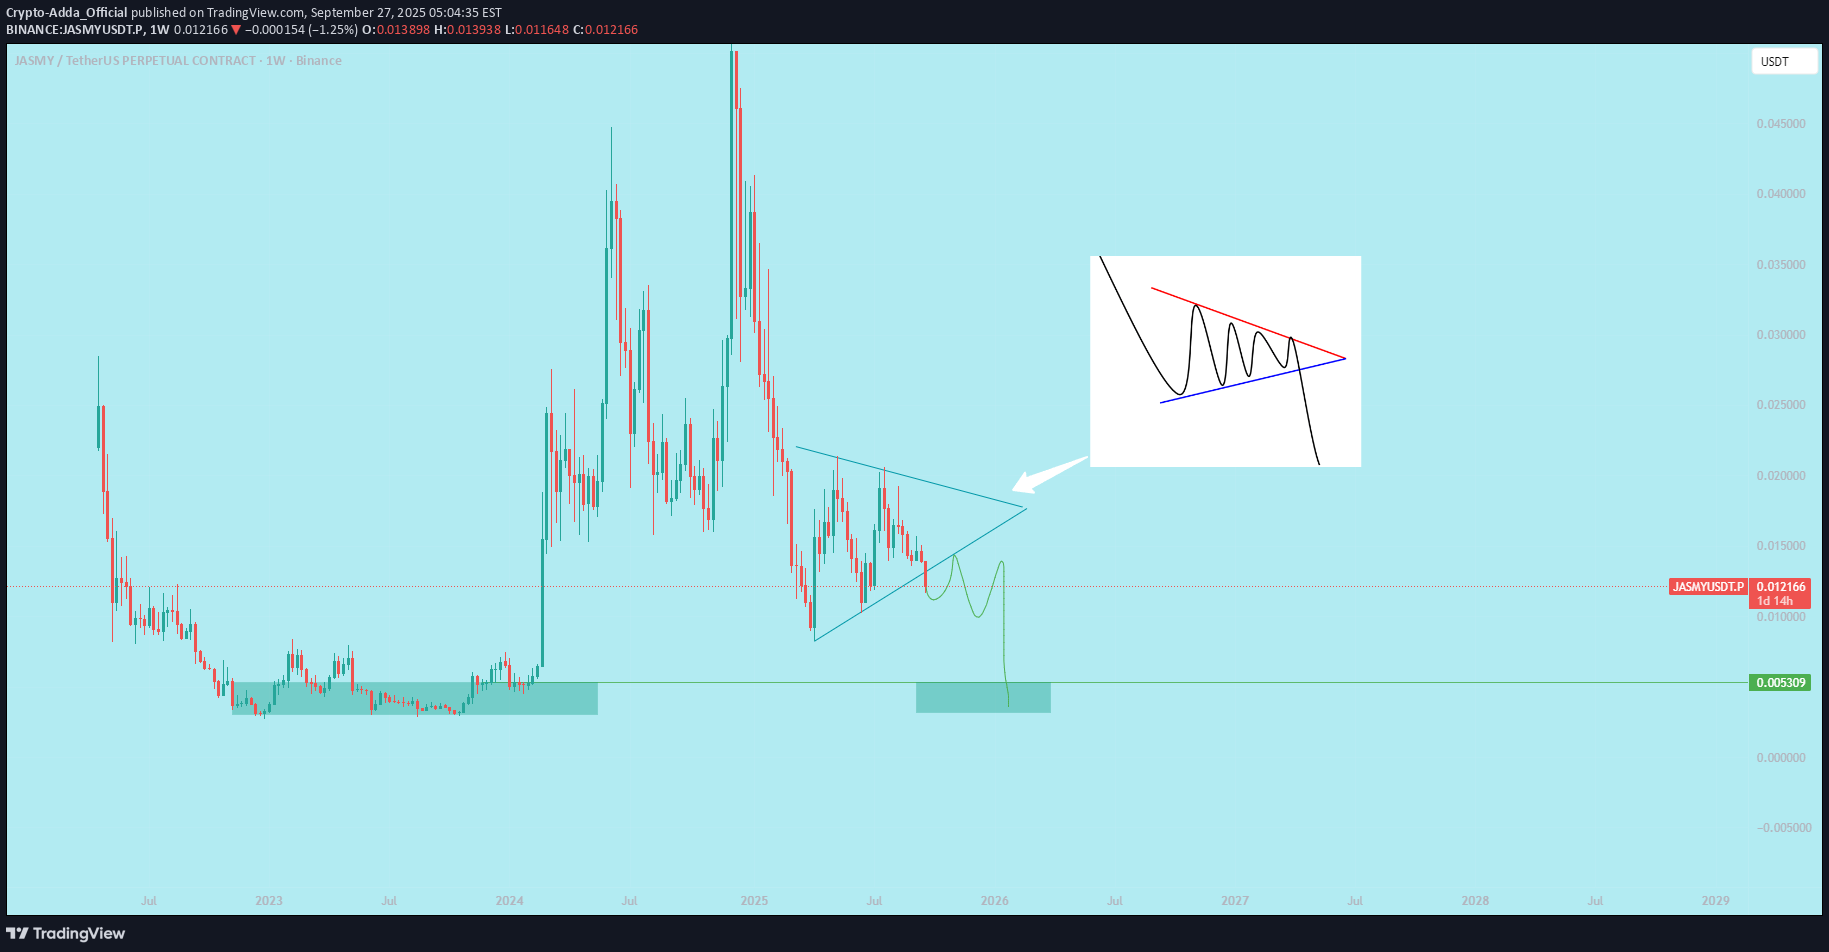
`A bearish symmetrical triangle is a continuation pattern in technical analysis that forms during a downtrend. It signals a period of market consolidation where neither buyers nor sellers have a clear advantage, suggesting a potential continuation of the prevailing downward trend once the pattern is completed.` everyone

CryptoNuclear
JASMY/USDT — Demand Zone: Bounce or Breakdown to Historical Low?

Overview The weekly chart of JASMY/USDT is currently at a crucial point. Price is sitting right inside the long-term demand zone around 0.010 – 0.013 USDT, which has repeatedly acted as a structural floor since 2022. This zone is the “last line of defense” before a potential move back toward the historical low at 0.0027 USDT. At the same time, if buyers step in strongly, this area could once again serve as the launchpad for a major rebound, with multiple resistance levels above offering clear upside targets. --- Structure & Pattern 1. Prolonged downtrend since 2021 → characterized by consistent lower highs and lower lows. 2. Strong demand zone (0.010 – 0.013) → historically a critical accumulation area. 3. Long-term consolidation → suggesting accumulation and positioning by larger players. 4. Repeated tests of demand → validates its importance, but the more it’s tested, the higher the risk of eventual breakdown. --- Bullish Scenario Trigger: A strong bullish weekly candle (rejection, pin bar, or engulfing) forming within the demand zone. Confirmation: A weekly close above 0.01704 USDT → early signal that demand is holding. Targets: 0.02340 (minor resistance), 0.03969 (mid-term resistance), 0.05712 – 0.08716 (major resistance and mid-term bullish targets). Potential: A rebound from here could lead to impulsive moves, as has happened in previous tests of this same demand zone. --- Bearish Scenario Trigger: Weekly close below 0.010 USDT with strong selling volume. Confirmation: Retest of the broken zone as resistance followed by rejection. Target: Possible decline toward 0.0027 USDT (historical low). Risk: A confirmed breakdown here could accelerate panic selling and extend the downtrend. --- Sentiment & Market Psychology This demand zone is closely monitored by traders → a bounce could trigger a strong short squeeze. A breakdown, however, may spark capitulation among retail participants, while smart money positions itself at deeper discounts. Since this is on the weekly timeframe, the outcome here could define JASMY’s direction for months ahead. --- Strategy & Risk Management Aggressive entry: Buy within 0.010–0.013, stop loss slightly below 0.010. Conservative entry: Wait for a confirmed weekly close above 0.017. Profit-taking: Scale out at each resistance target. Risk control: Manage exposure carefully (1–2% per trade), avoid over-leveraging in such a decisive zone. --- Conclusion JASMY is at a make-or-break level. Holding above 0.010–0.013 may trigger a rebound toward 0.017 → 0.023 → 0.087. Failing to hold could send the market back to retest the historical low at 0.0027. This zone will determine whether JASMY enters a new accumulation and recovery phase, or extends its multi-year downtrend. Traders should wait for weekly confirmations before committing to major positions. --- #JASMY #JASMYUSDT #CryptoTA #AltcoinAnalysis #PriceAction #WeeklyChart #SupportResistance #DemandZone #CryptoTrading

Miraqcapital
JASMY/USDT Perpetual (JASMYUSDT.P) 4H Timeframe Analysis
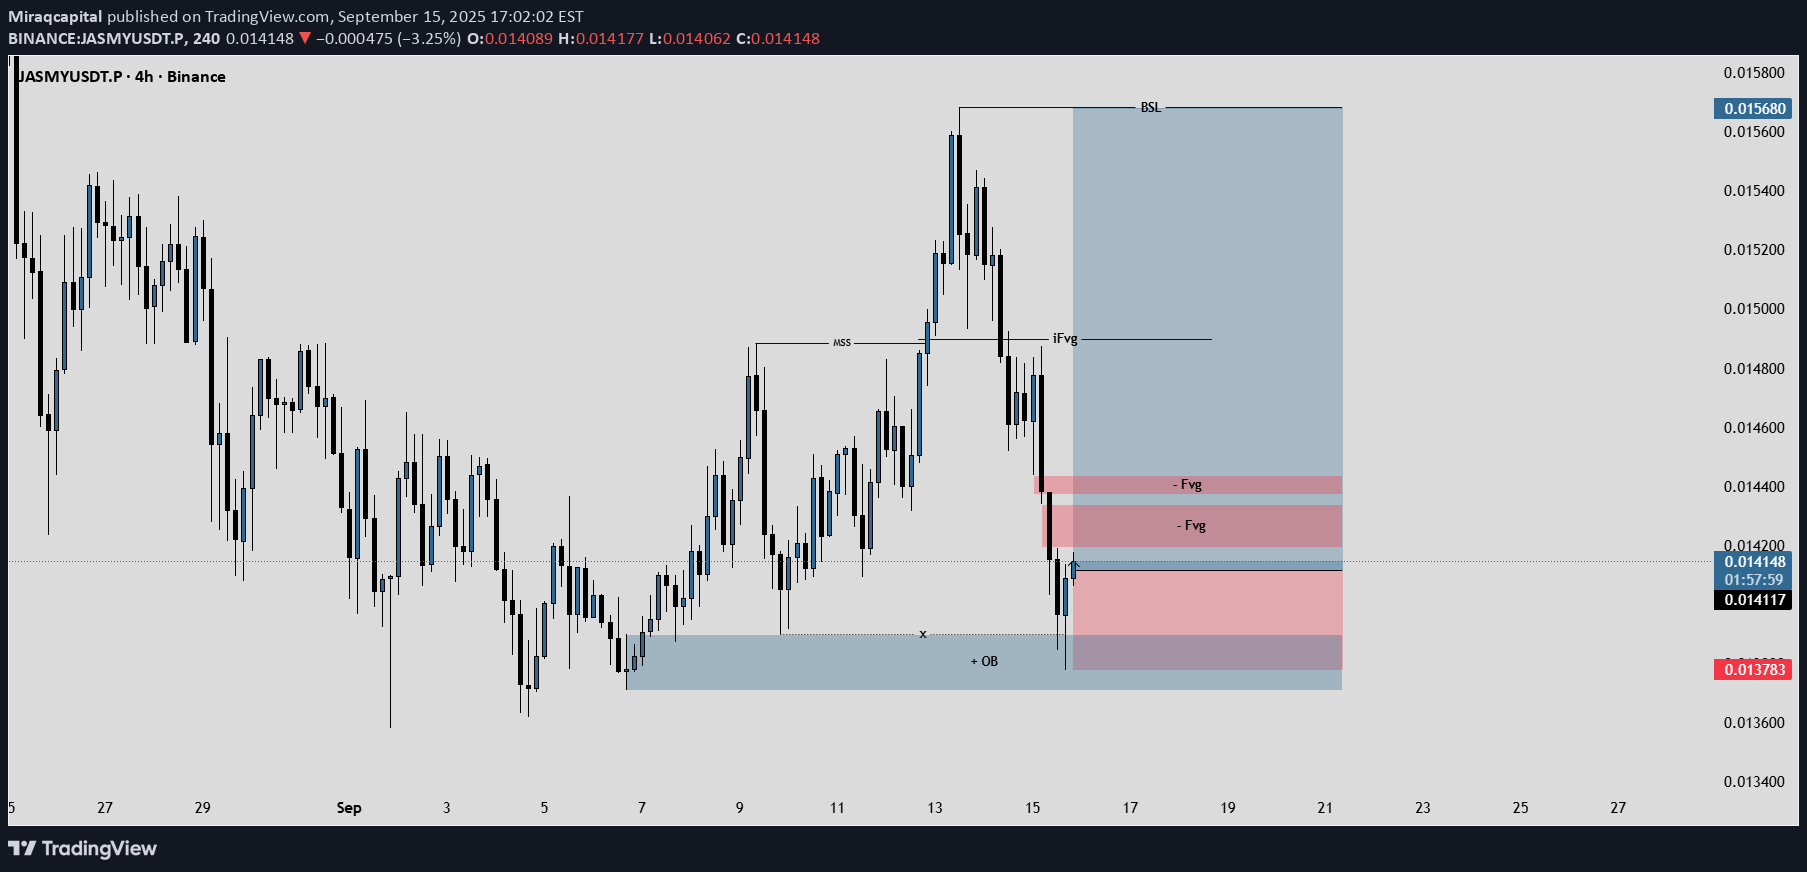
JASMYUSDT.P shows a short-term bearish correction within a broader neutral-to-bullish structure. The price has declined from a local high near $0.017 in late August to recent lows around $0.014, forming a descending channel with lower highs and lows. Volume appears moderate during the pullback, suggesting accumulation rather than panic selling, but spikes on downside wicks indicate liquidity grabs at key supports, Hold above $0.0140; RSI >50; volume spike on green candles. Break $0.0155 confirms. JASMY's 4H setup favors a long (bullish) bias if support holds, given accumulation signals and altseason tailwinds. However, a break below $0.0136 could trigger shorts. Below is a table of scenarios, probabilities (based on technicals and sentiment), and exact trade points (risk-reward ~1:2; use 1–2%Updated JASMYUSDT.P Analysis (4H) - 11:40 AM +03, Sep 18, 2025 Since the last update, JASMYUSDT.P successfully hit the first take-profit (TP1) at the initial Imbalance Fair Value Gap (IFVG) around $0.0155, confirming the anticipated bounce from the key support cluster at $0.0140. This move validated the accumulation narrative, as price swept liquidity lows near $0.01399 (testing the Order Block/OB zone) before reversing with a clear Market Structure Shift (MSS) higher. The short-term bearish correction within the broader neutral-to-bullish channel has resolved bullishly, with moderate volume on the upside candles supporting sustained momentum. Current price sits at ~$0.01479 (up 4% in 24h), consolidating just below the recent 7d high of $0.01561. RSI (14) on 4H is neutral at ~46-51 (recovering from oversold ~37 earlier this week), flashing early bullish divergence, while MACD shows a weakening bearish histogram—signaling potential for continuation if volume spikes on greens.
Disclaimer
Any content and materials included in Sahmeto's website and official communication channels are a compilation of personal opinions and analyses and are not binding. They do not constitute any recommendation for buying, selling, entering or exiting the stock market and cryptocurrency market. Also, all news and analyses included in the website and channels are merely republished information from official and unofficial domestic and foreign sources, and it is obvious that users of the said content are responsible for following up and ensuring the authenticity and accuracy of the materials. Therefore, while disclaiming responsibility, it is declared that the responsibility for any decision-making, action, and potential profit and loss in the capital market and cryptocurrency market lies with the trader.