
Crypto-Adda_Official
@t_Crypto-Adda_Official

What symbols does the trader recommend buying?
Purchase History
پیام های تریدر
Filter
Crypto-Adda_Official
الگوی گُوِه نزولی صعودی بیت کوین: سیگنال قدرتمند بازگشت قیمت!
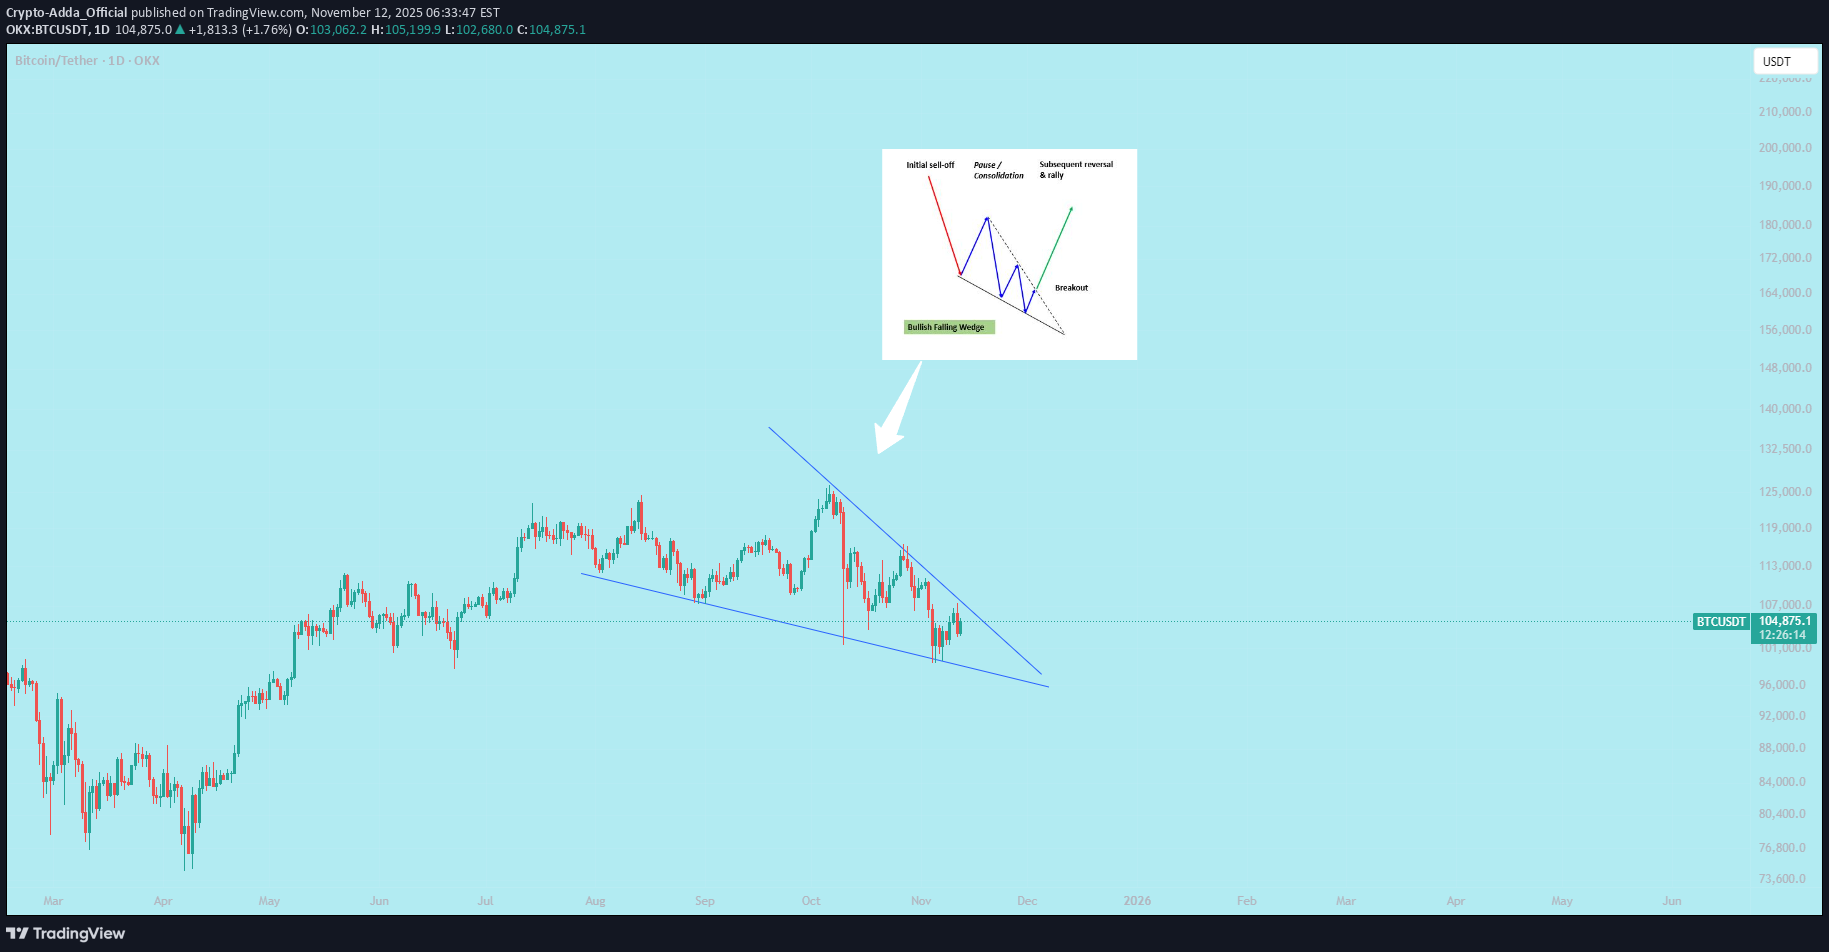
** BTC performing bullish falling wedge** `A bullish falling wedge is a chart pattern in technical analysis that typically signals a potential upward trend reversal or a continuation of an uptrend after a period of consolidation. It is considered a reliable bullish signal.` \
Crypto-Adda_Official
آلرت فوری: اینترنت کامپیوتر (ICP) آماده انفجار به سمت ۶۰ دلار!
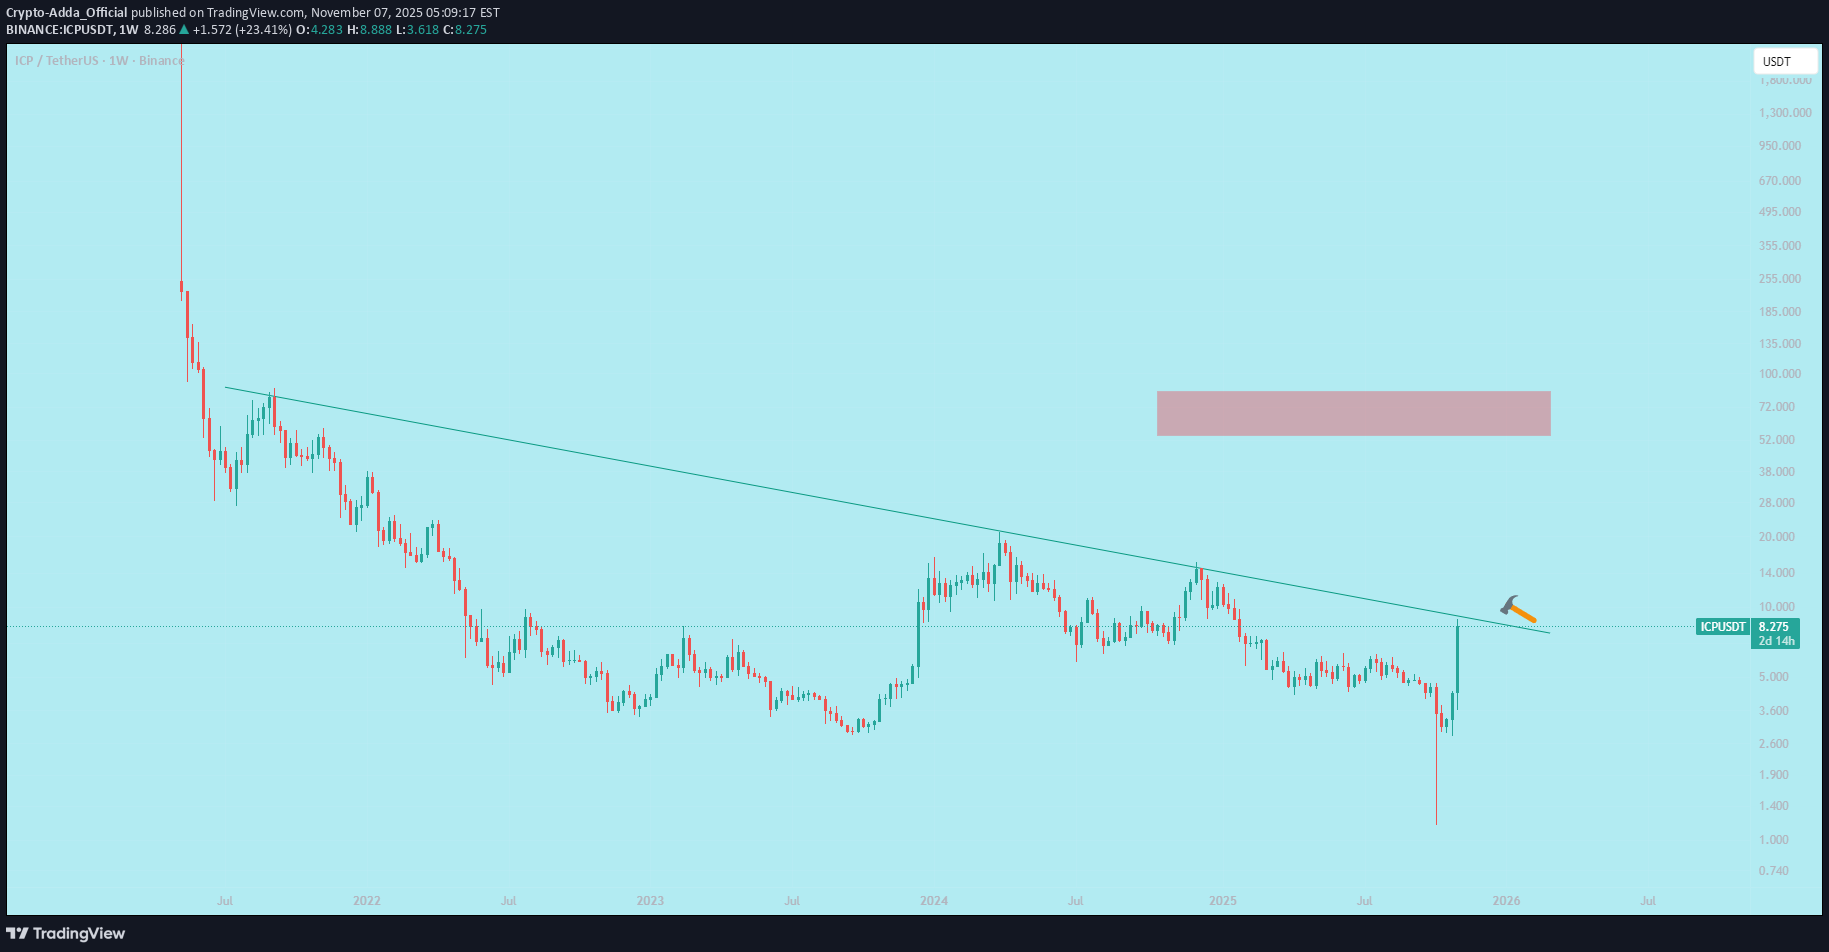
If ** ICP ** breaks the trendline and turns it into upper support, it can move around $60. ICP just smashed through the trendline with a massive breakout and has now flipped it into solid upper support! It's confidently holding above this previous resistance (now turned support). If volume and momentum stay strong, a move around $60 is very realistic. Short & sweet: ICP → Trendline break → Flipped to support → Next target ~$60 Bulls are fully in control. Hold tight!
Crypto-Adda_Official
بیت کوین در مرز ۱۱۷ هزار دلار: آیا سقوط ادامه دارد یا شاهد جهش به ۱۲۷ هزار دلار خواهیم بود؟

🔥 **$117K-$115K Zone:** Critical hold – Strong demand area! Expect bounce-back to $127K+.It's essential for BTC to defend this level to maintain bullish momentum ⚠️ DYOR | NFA This pullback came after a strong rally driven by institutional ETF inflows, dovish Fed signals, and seasonal "Uptober" momentum, but it's now consolidating near key support levels. The market sentiment is mixed: bullish on longer-term fundamentals but cautious short-term due to overbought conditions and profit-taking.
Crypto-Adda_Official
تحلیل تکنیکال اتریوم: راز کانال صعودی و مسیر احتمالی قیمت

An ascending channel, or rising channel, is a chart pattern used in technical analysis to identify a security's ongoing uptrend. It is characterized by the price fluctuating between two parallel, upward-sloping trendlines. Key components Higher highs and higher lows: The price consistently makes higher swing highs and higher swing lows over a period of time, indicating steady bullish momentum. Parallel trendlines: Two parallel lines are drawn to frame the price action. Upper line (resistance): Connects the higher swing highs. It represents the point where selling pressure is strong enough to temporarily stop the price from rising. Lower line (support): Connects the higher swing lows. This line indicates where buying pressure is strong enough to prevent the price from falling further.
Crypto-Adda_Official
$JASMY Breakdown Bearish Symmetrical Triangle in 1W
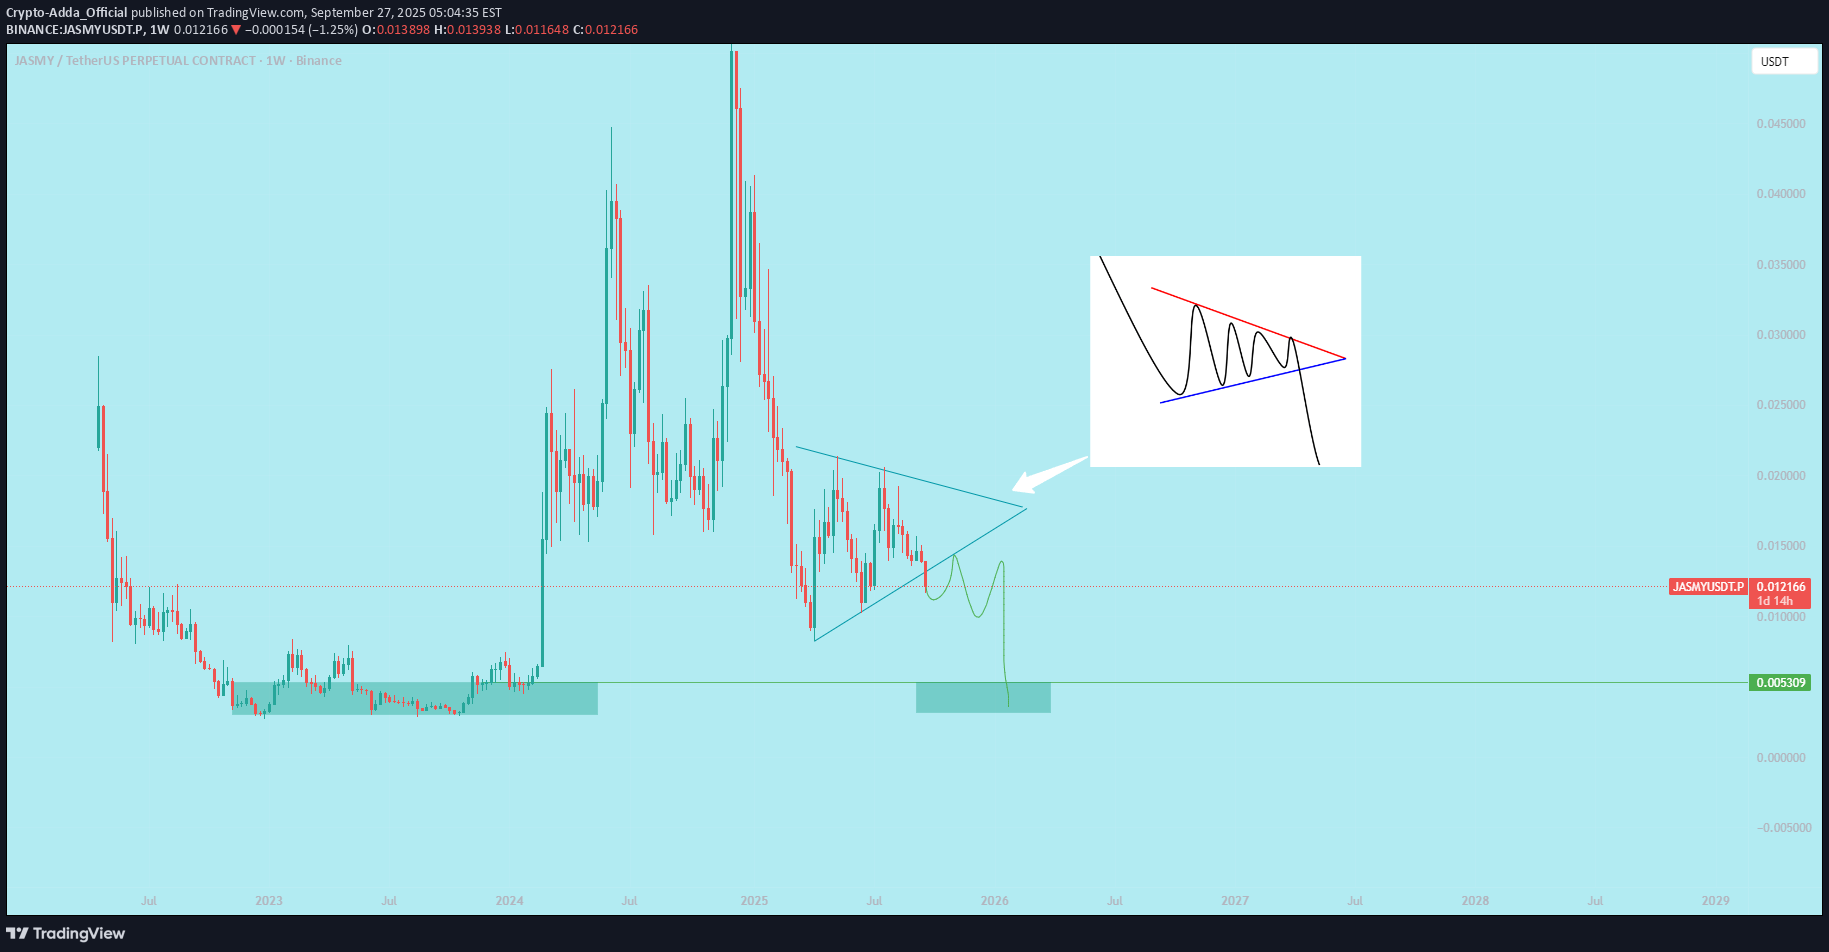
`A bearish symmetrical triangle is a continuation pattern in technical analysis that forms during a downtrend. It signals a period of market consolidation where neither buyers nor sellers have a clear advantage, suggesting a potential continuation of the prevailing downward trend once the pattern is completed.` everyone
Crypto-Adda_Official
$XRP Performing falling wedge pattern in 1D
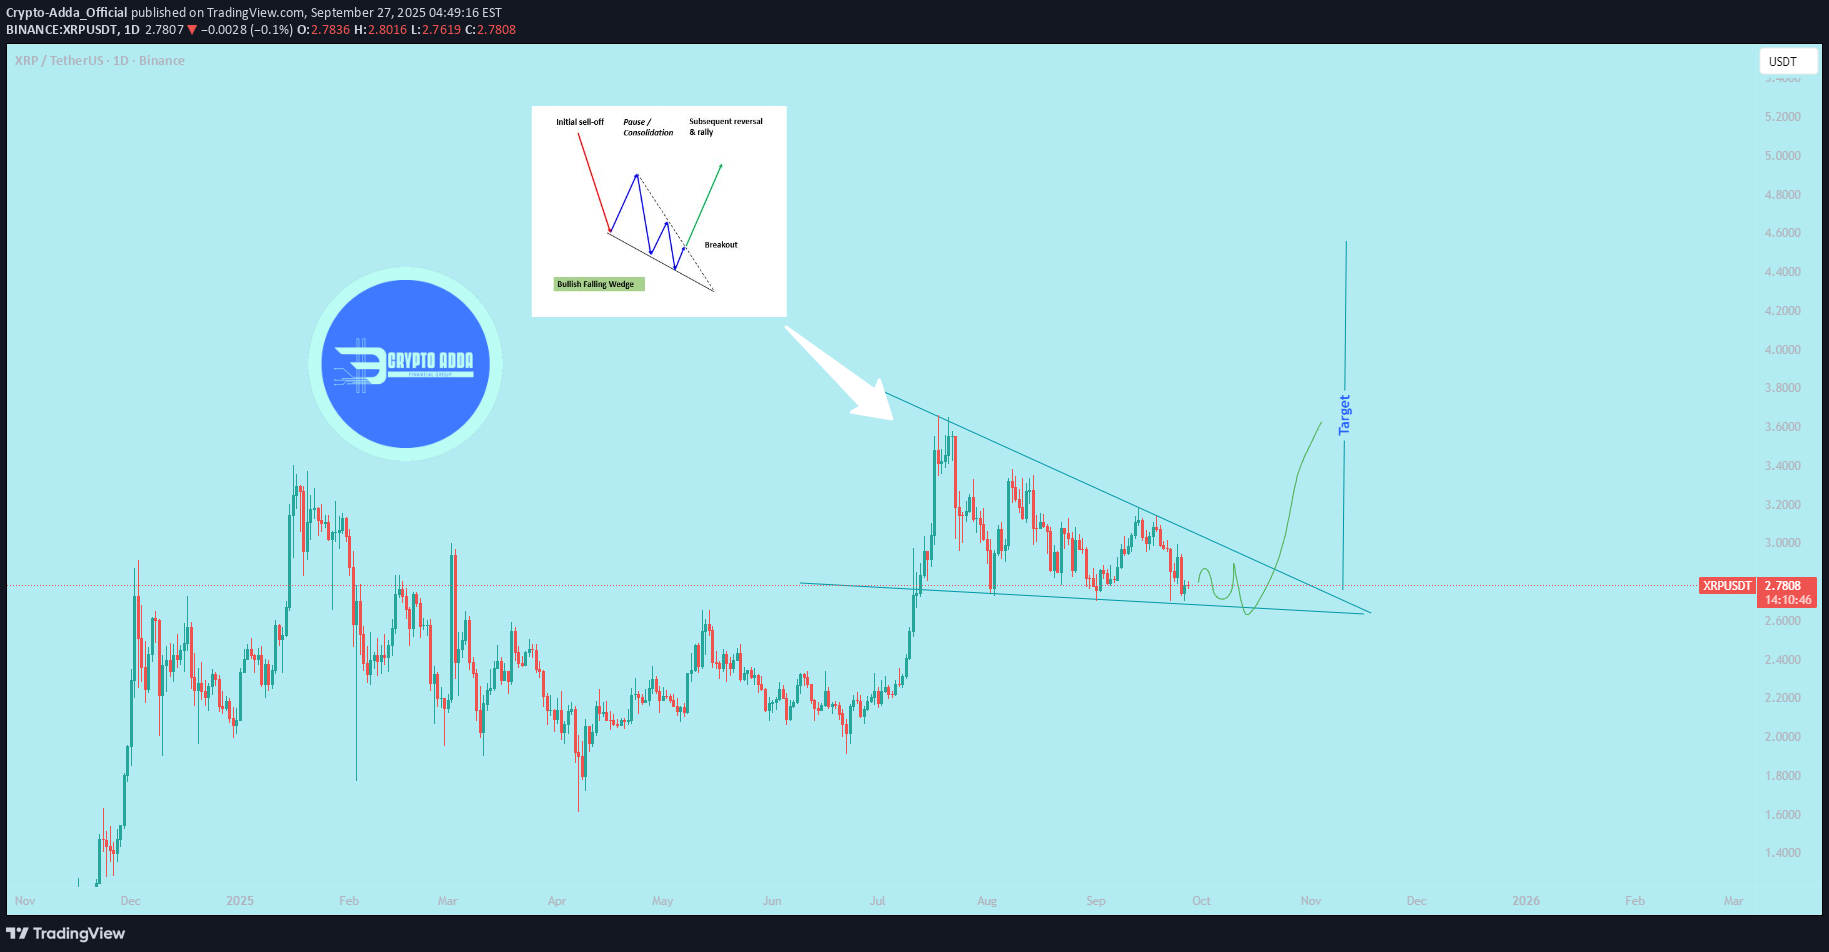
> Falling wedge as a reversal vs. continuation pattern `As a reversal pattern` `Location:` Occurs at the end of a prolonged downtrend. Signal: The narrowing price action and declining volume suggest that sellers are exhausting their momentum. The pattern is completed when the price breaks above the upper resistance line, signaling a potential bullish reversal. `As a continuation pattern` `Location: `Appears after a strong uptrend. Signal: The falling wedge acts as a temporary consolidation or pause in the current trend. The price then breaks out to the upside, continuing the original uptrend. everyone
Crypto-Adda_Official
$SUI Trendline breakdown
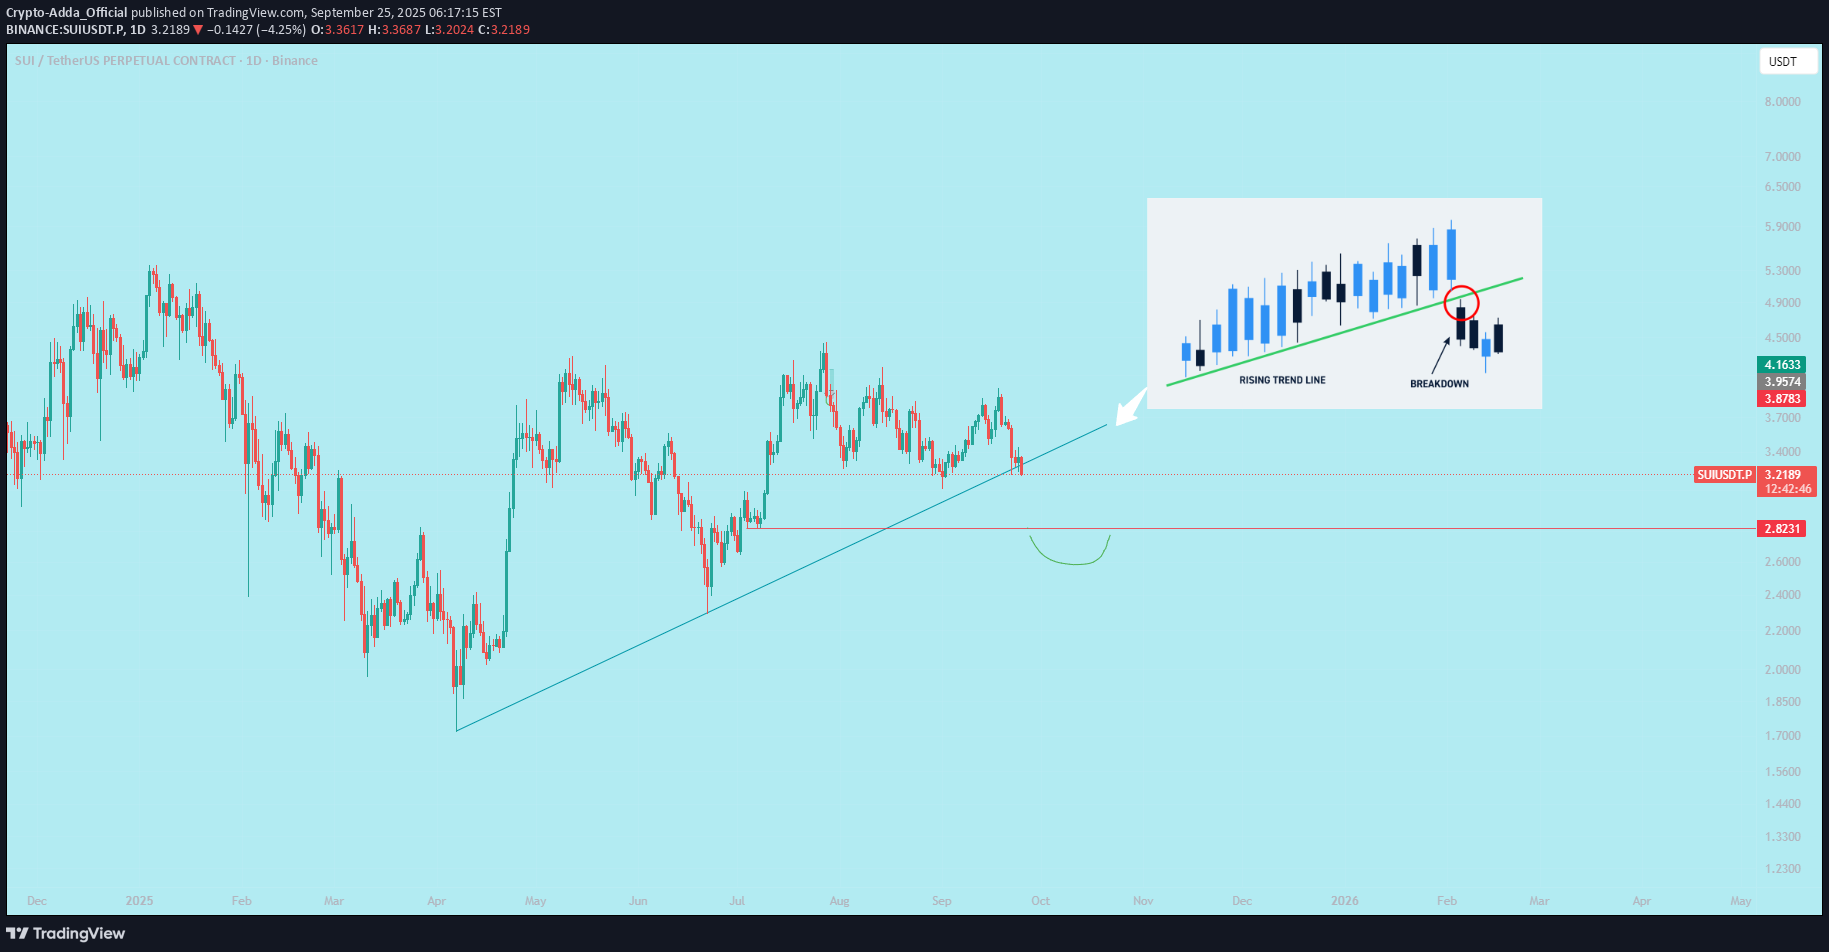
A trendline breakdown occurs when the price of an asset falls below a trendline, signaling a potential reversal or shift in market momentum. Here’s how it works, explained concisely: 1. **Trendline Definition**: A trendline is a diagonal line drawn on a price chart connecting higher lows in an uptrend or lower highs in a downtrend, indicating support or resistance levels. 2. **Breakdown Process**: - In an **uptrend**, a trendline connects higher lows, acting as support. - A breakdown happens when the price closes below this trendline, suggesting buyers are losing control and sellers are gaining momentum. - The break often indicates the end of the uptrend, potentially leading to a price decline or consolidation. 3. **Confirmation**: - A single candle closing below the trendline may not confirm a breakdown. - Traders often wait for additional signals, like a strong bearish candle, increased selling volume, or a retest of the trendline (where price fails to reclaim it). 4. **Key Factors**: - **Volume**: Higher volume on the breakdown strengthens its validity. - **Timeframe**: Breakdowns on longer timeframes (e.g., daily or weekly) are more significant than on shorter ones (e.g., hourly). - **Retest**: Price may return to test the broken trendline as resistance before continuing downward. 5. **Implications**: - A breakdown can signal a trend reversal (from bullish to bearish) or a temporary pullback. - Traders may use it to enter short positions, set stop-losses above the trendline, or exit long positions. 6. **False Breakdowns**: - Sometimes, price briefly dips below the trendline but quickly recovers, known as a "fake out." - To avoid this, traders use additional indicators like moving averages, RSI, or support levels for confirmation. **Note**: Always combine trendline analysis with other technical indicators and risk management, as breakdowns are not foolproof signals. Market conditions and news can also impact outcomes.PERFCT DROP
Crypto-Adda_Official
$ETH shows bullish hidden RSI divergence.
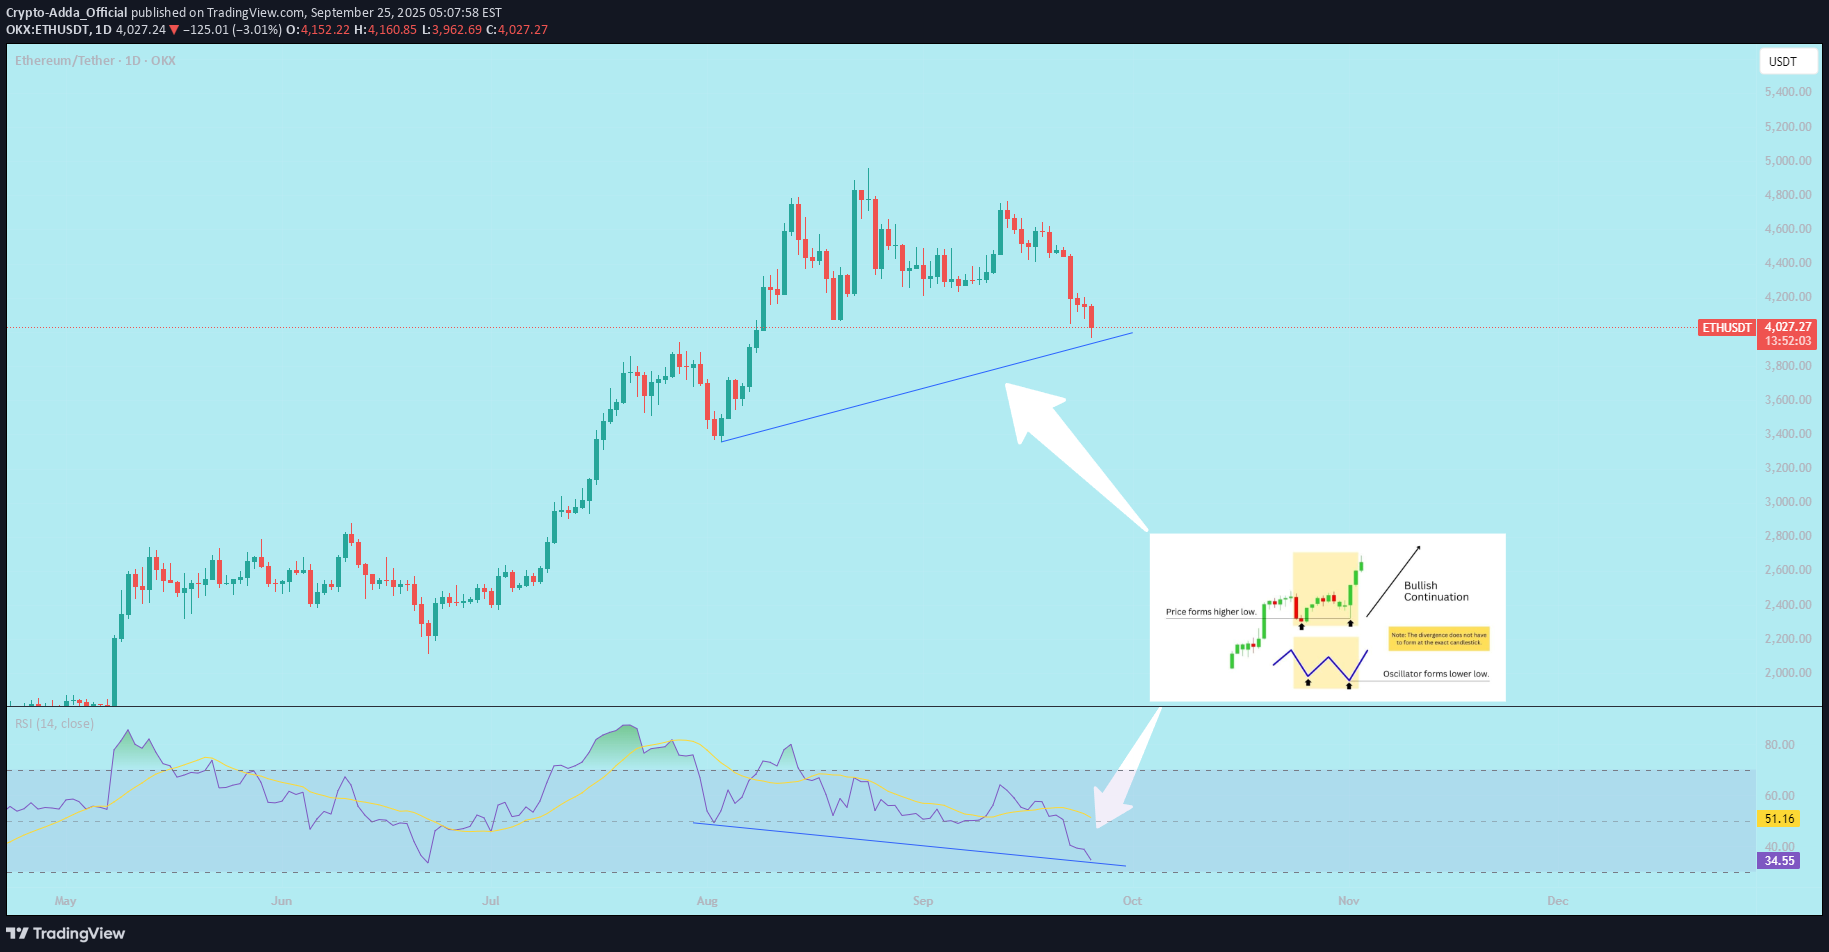
A **bullish hidden RSI divergence** is a trading signal that suggests a continuation of an upward trend, often indicating that the price will keep rising. It occurs when the price action and the Relative Strength Index (RSI) show a specific pattern. Here's a simple explanation of how to identify and trade it: ### Step 1: Understand the Pattern - **Price Action**: The price makes **higher lows** (each low point is higher than the previous one), indicating an uptrend. - **RSI**: The RSI makes **lower lows** (the RSI is declining while the price is not), showing a divergence from the price trend. - This mismatch suggests that the uptrend is still strong, and the dip in RSI is just a temporary slowdown in momentum, not a reversal. ### Step 2: Identify the Divergence 1. **Chart Setup**: Use a price chart (e.g., candlestick chart) with the RSI indicator (typically set to 14 periods) on a platform like TradingView . 2. **Spot Higher Lows in Price**: Look for a price chart where the recent low is higher than the previous low (e.g., $100 to $105). 3. **Check RSI for Lower Lows**: At the same time, check if the RSI is making a lower low (e.g., RSI drops from 50 to 45 while price makes a higher low). 4. **Confirm the Uptrend**: Ensure the overall trend is bullish (price is generally moving up with higher highs and higher lows). ### Step 3: Trading the Bullish Hidden RSI Divergence 1. **Entry Point**: - Enter a **buy** trade when you confirm the divergence and see the price starting to rise again after the higher low. - Look for additional confirmation, like a bullish candlestick pattern (e.g., a hammer or engulfing candle) or a break above a resistance level. 2. **Stop Loss**: - Place a stop loss below the most recent higher low to protect against a potential trend reversal. - For example, if the higher low is at $105, set the stop loss slightly below, like $103. 3. **Take Profit**: - Target a take-profit level based on previous highs, support/resistance levels, or a risk-reward ratio (e.g., 1:2, meaning you aim for twice the profit compared to your risk). - For instance, if your stop loss is $2 below entry, aim for a $4 profit target. ### Step 4: Manage the Trade - **Monitor RSI**: Ensure RSI doesn’t drop into oversold territory (below 30) or show signs of a bearish reversal. - **Adjust Stop Loss**: As the price moves up, consider trailing your stop loss to lock in profits. - **Exit Strategy**: Exit the trade if the price hits your target, or if you see signs of a trend reversal (e.g., a bearish divergence or break of key support). ### Example - **Price**: Stock XYZ makes a low at $100, then a higher low at $105. - **RSI**: RSI drops from 50 to 45 during the same period. - **Action**: You enter a buy trade at $106 after a bullish candle. Set a stop loss at $103 and aim for a take-profit at $110 (1:2 risk-reward). - **Outcome**: If the price continues its uptrend to $110, you take profit. If it drops below $103, you exit with a small loss. ### Tips - **Timeframes**: Use higher timeframes (e.g., 1-hour, 4-hour, or daily) for more reliable signals. - **Confirmation Tools**: Combine with other indicators like moving averages or trendlines for stronger signals. - **Practice**: Test this strategy on a demo account before using real money to understand how it works in different market conditions. - **Risk Management**: Never risk more than 1-2% of your trading account on a single trade. This strategy works best in trending markets, so always confirm the broader trend before trading.
Crypto-Adda_Official
Bitcoin Price Update and Trading Plan
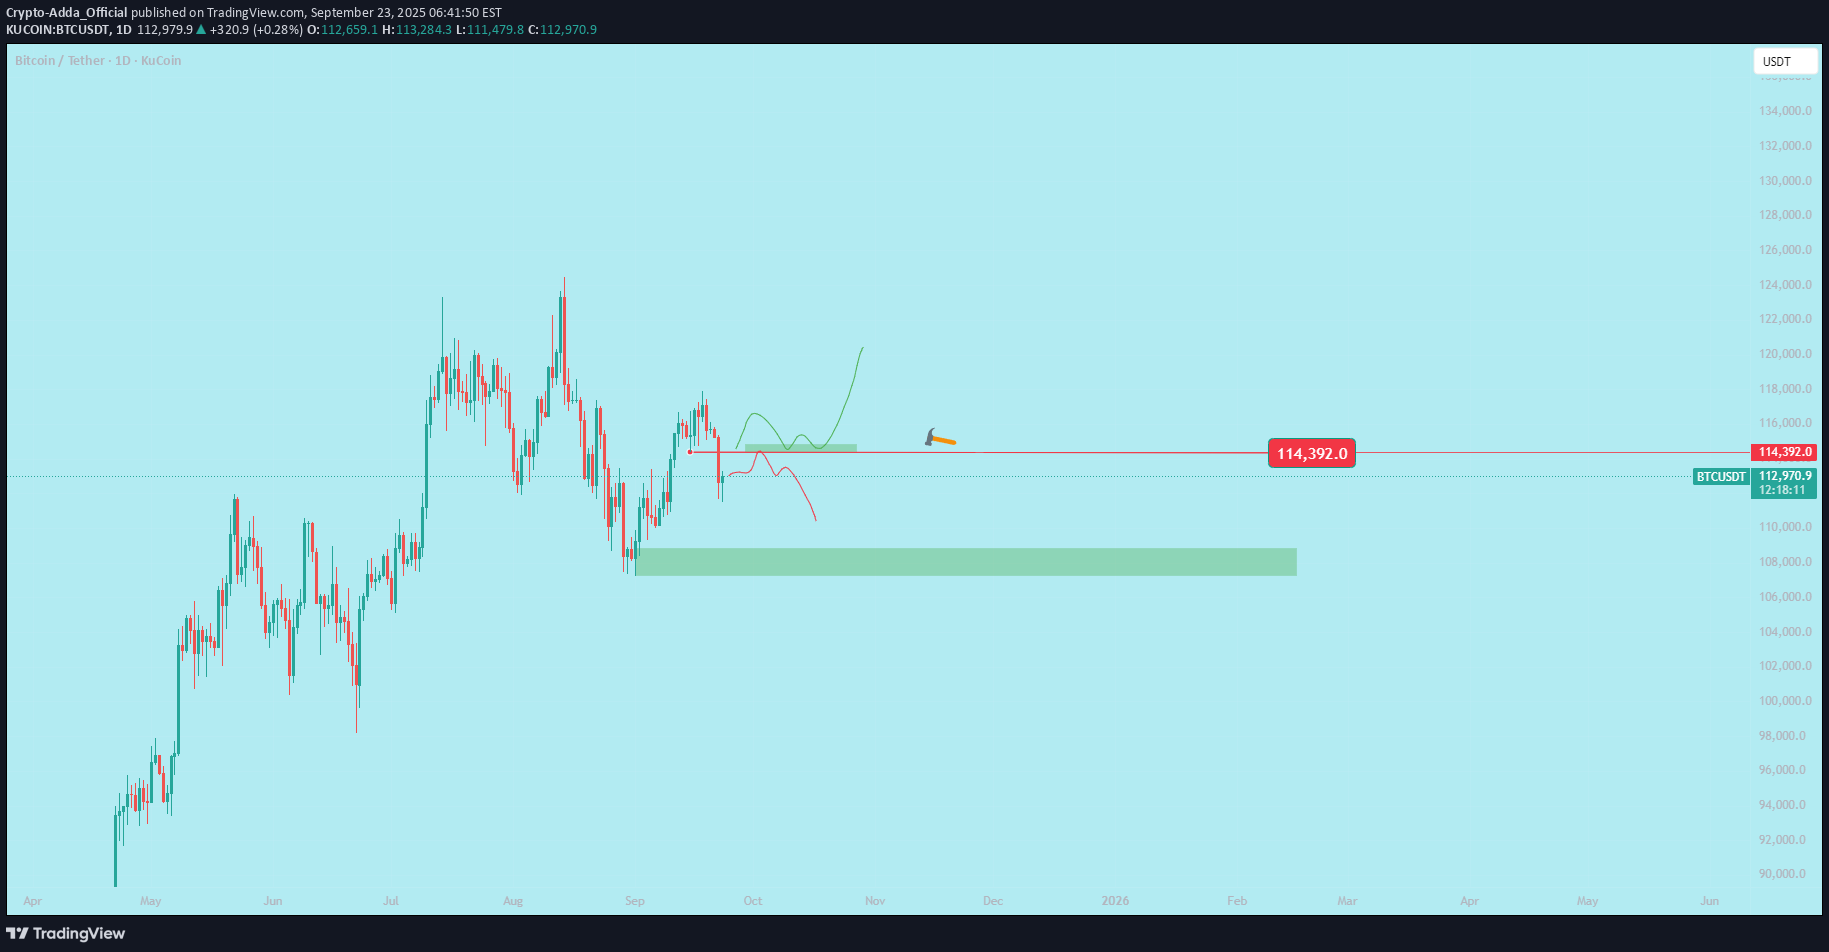
**Current Situation**: Bitcoin (BTC) is at a critical level, and its weekly closing price is highly important for traders. A strong bounce from the current price, followed by a weekly close above **$114,500**, is needed to confirm bullish momentum. This could lead to a significant upward move, allowing traders to capitalize on the next strong price movement. However, BTC should first retest its key support level, which it previously broke, to confirm its strength. If rejected at this support, a downward move toward **$108,000** is possible. **Trading Plan**: 1. **Bullish Case**: - **Condition**: If BTC bounces from its current level and closes above **$114,500** on the weekly chart, it signals strong bullish momentum. - **Action**: Enter a long position targeting higher levels, such as **$117,200-$120,000**. - **Stop Loss**: Place below **$114,000** to manage risk. - **Rationale**: A close above **$114,500** confirms support and sets the stage for the next upward move. 2. **Bearish Case**: - **Condition**: If BTC fails to hold above **$114,500** and breaks below the key support, it may retest the **$108,000-$110,000** zone, where it previously found support. - **Action**: Wait for confirmation of a bounce at **$108,000** for a potential long trade, or short if rejection occurs at this level. - **Stop Loss**: For shorts, place above **$115,000** to limit risk. - **Target**: A downward move could target **$108,000**, with further declines possible if selling pressure increases. - **Rationale**: A rejection at **$108,000** after breaking key support indicates bearish pressure, potentially leading to a deeper correction. **Key Levels to Monitor**: - **Support**: **$114,500** (immediate), **$108,000-$110,000** (major support zone). - **Resistance**: **$117,200-$118,000** (immediate), **$120,000+** (next target). - **Weekly Close**: The weekly close on September 28, 2025, will determine whether BTC confirms bullish strength or signals a deeper pullback. **Conclusion**: For a bullish outlook, BTC needs to close above **$114,500** to confirm a bounce and target higher levels. If it fails, traders should prepare for a potential retest of **$108,000**, where a rejection could lead to further downside. Monitor price action closely and use tight risk management due to BTC’s volatility. *Disclaimer*: Cryptocurrency trading is highly risky. This is not financial advice; always conduct your own research before trading.
Crypto-Adda_Official
$USELESS liquidity sweep
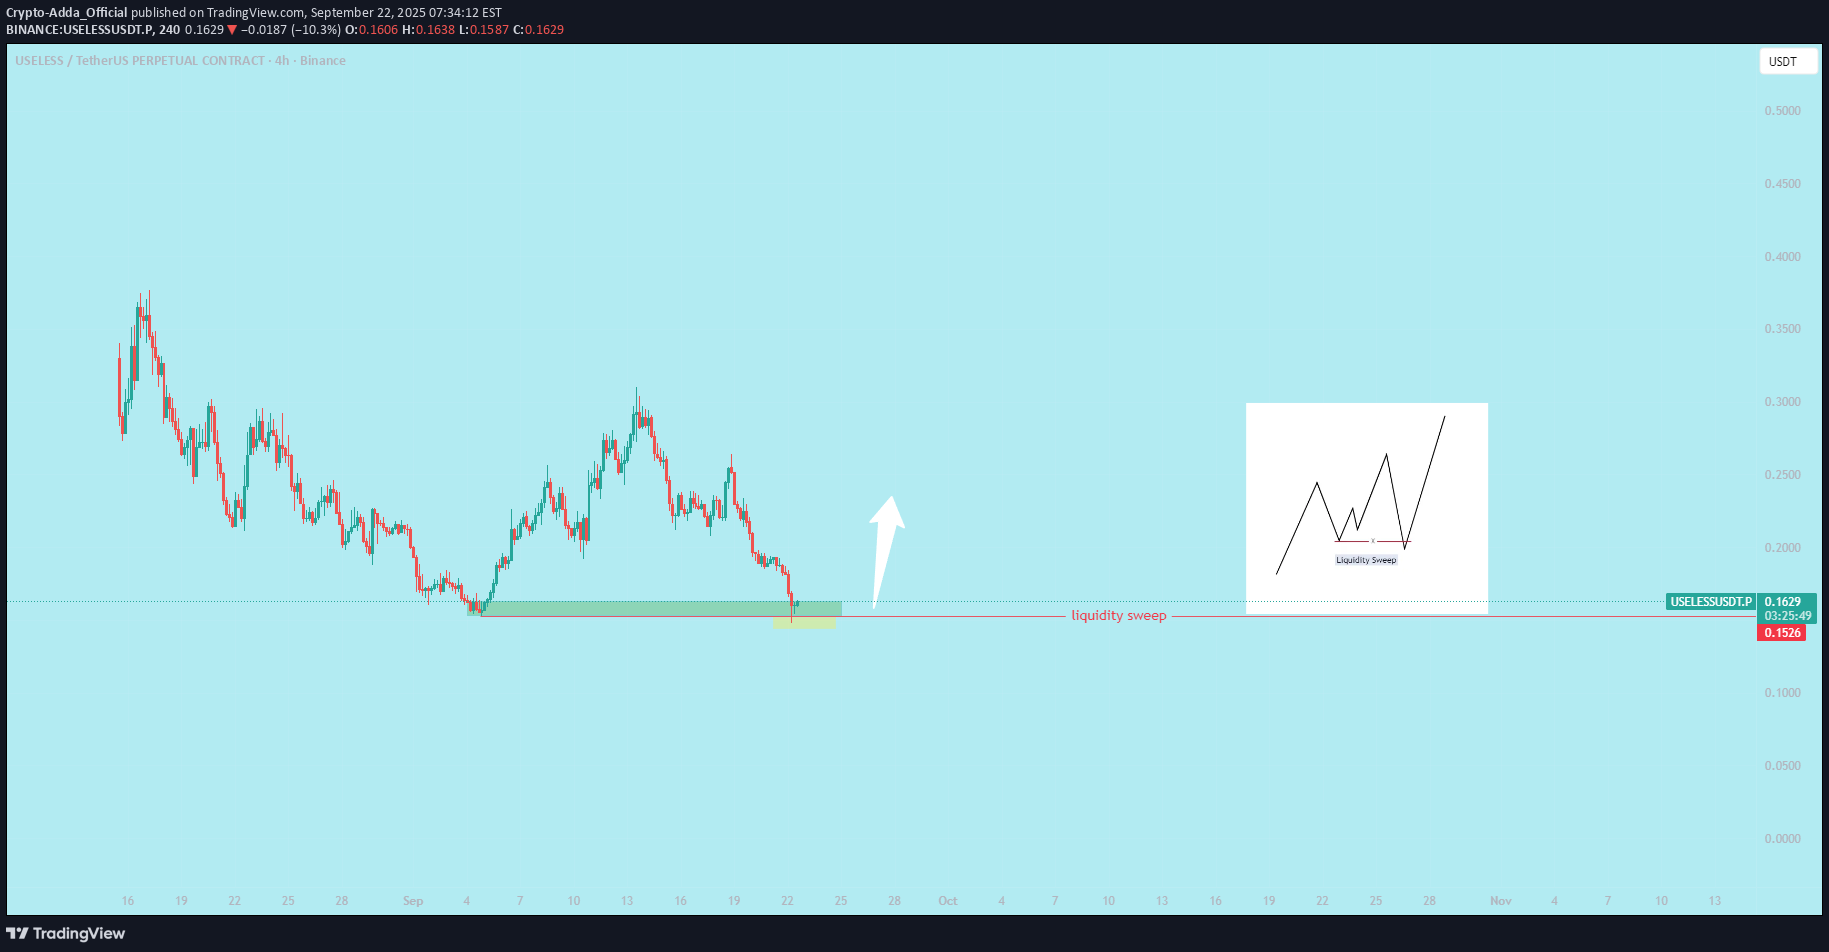
**liquidity sweep** in trading happens when the price of a coin or asset quickly moves to a level where many stop-loss orders or pending orders (buy/sell) are placed, triggering them. These orders are often clustered at key support or resistance levels, like round numbers or recent highs/lows. Large players (like whales or institutions) may intentionally push the price to these levels to "sweep" or clear out this liquidity (execute these orders), allowing them to buy low or sell high before the price reverses. **In simple words**: It’s when the market price suddenly moves to hit a bunch of stop-losses or pending orders, clearing them out, often before a big price move in the opposite direction. For example, if many traders set stop-losses just below a support level, a liquidity sweep might push the price down to trigger those stops, then bounce back up. **How to use this in trading**: - Watch key levels (support/resistance) on charts where stop-losses might cluster. - Avoid placing stop-losses at obvious levels (e.g., exact round numbers like $0.10). - For coins like #WLFI or #USELESS, check order books or volume spikes to spot potential sweeps. - Manage risk by using smaller position sizes and setting stops away from crowded levels. Always confirm price action and trends before acting, especially with volatile new coins.50% move from entry
Disclaimer
Any content and materials included in Sahmeto's website and official communication channels are a compilation of personal opinions and analyses and are not binding. They do not constitute any recommendation for buying, selling, entering or exiting the stock market and cryptocurrency market. Also, all news and analyses included in the website and channels are merely republished information from official and unofficial domestic and foreign sources, and it is obvious that users of the said content are responsible for following up and ensuring the authenticity and accuracy of the materials. Therefore, while disclaiming responsibility, it is declared that the responsibility for any decision-making, action, and potential profit and loss in the capital market and cryptocurrency market lies with the trader.