
CryptocurrencyBlot
@t_CryptocurrencyBlot

What symbols does the trader recommend buying?
Purchase History
پیام های تریدر
Filter
CryptocurrencyBlot
(jasmy) JASMY "historical purchase lines"
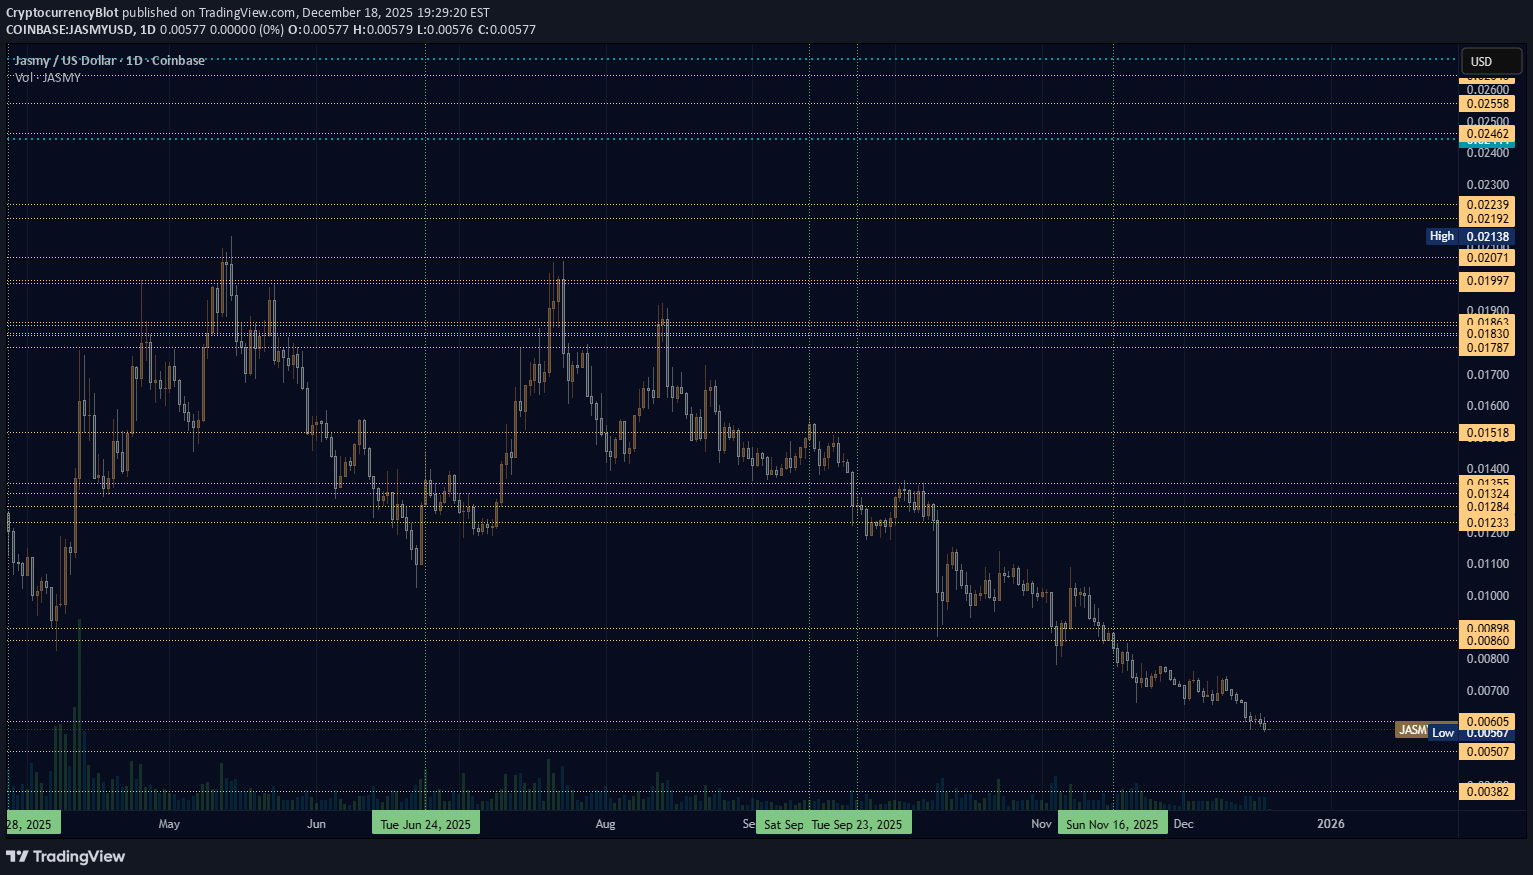
One more Jasmy post for the internet of trading view before the end of the year becomes final. Did I already post this image? This is quite sad to see there was no stability in the price of Jasmy this year. Not a single dollar withheld from the gobs of money that poured into Jasmy during the past year; Oh well. These lines represent prices of Jasmy when I have made buys. Sells in blue, Buys in Orange. I never made any money from Jasmy, I never sold the bulk of my investment and only watched as the price fell to where it is now. Or I should say, I stopped watching seeing how there was no reversal in price after the price began to fall.
CryptocurrencyBlot
توشی (TOSHI): آیا این میمکوین سراب است یا یک استراتژی پنهان؟

Is Toshi a fluke this year? So far, the price of the meme has not left the price of the origin starting price. 10 months and no change in price for long term holders, not great. Meme stability not a fluke? The price is not lower than the starting price and that is not always a bad thing because keeping money is better then losing money.
CryptocurrencyBlot
رمز ارز یاسی (JASMY)؛ آیا این توکن ژاپنی از سلطه بیتکوین رها خواهد شد؟

Trends of losing all together is such a scam. Crypto does not have to lose in series. The fact that there are very few parallel trends of cryptocurrency stock trading is a presentation of holders across the board that own all tokens and coins selling at the same time like some mass event exodus from cryptocurrency. The losses that are incurred seem to follow bitcoin whether it be by fear of centralized holders who see Bitcoin falling and fear their own investment to lose or if it is directly correlated to outside interests like whales being more in control of the price. The fact is so many cryptocurrency brands do not offer a great deal of circulating supply percentage of investors alone. The drop in prices for a lot of companies cannot have as much to do with investors as insiders of the companies. Cryptocurrency being interconnected by chain should not mean interconnectivity by trade. I thought cryptocurrency would be more freeing compared to the stock market seeing how the DOW price lifts and dips often introduce variables that interfere with the prices of many other major companies. Cryptocurrency, will it ever be independent of the factors of businesses, politics, and outside interests. I'm sure there are a lot of people talking about the connection between the government in the USA and the price of crypto. I'm not sure I care to believe that because BTC is international worldwide everyone. If not long then what? Why should I ever believe the price should go down. I want prices to increase into feasible areas of growth. The news said Japan is doing great on the news of the new leadership so why not Jasmy? Has japan accepted Jasmy as the Bitcoin of Japan? The most popular crypto in japan is the same as the most popular crypto in most places. There are exceptions where certain regions prefer specific altcoins or tokens including trending topics that do or don't favor the groups of people in specific differing regions. Japan is not entirely the same as Denmark and Denmark is not entirely the same as Canada's self interests. People are mostly the same around the world and they all love the major coins, chains, tokens, and meme styles. Variables of interest that determine regionalisms are highly focuses in areas that are less likely to be understood without doing extensive research into the topic of regional impacts on cryptocurrency investment as research. Clearly, Japan is not like USA. When I see memes and tokens created to provide parody, deprecating humor, and other ideas, because I do not know the region all I know is that sometimes the ideas go over my head because I'm in tune with the perspectives.
CryptocurrencyBlot
بدترین ریزش تاریخ بیت کوین: رمز ارزها چرا سقوط کردند؟

This looks like the biggest losing candle I've ever seen on Bitcoin, and the same goes for Ethereum. Huge single day losses for cryptocurrency. I find a winning a solution and instead the entire market of cryptocurrency loses big time all because they don't want me to be able to win. Decentralizing trades does nothing to protect information when comparing Coinbase to Coinbase wallet defi. The Defi of coinbase wallet is the same as Coinbase where some type of inside log knows data of my trades and I lose when I start putting my money in at the perfect time to win.
CryptocurrencyBlot
حضور ناگهانی "PROVE" در کراکن: از دید پنهان ماندن یا فراموشی من؟

When I was doing the end of month tally I did notice a few companies that were listed on Coinbase that were not available on Kraken. The next day I noticed PROVE was on Kraken. Did it slip by unnoticed inpublicly based on the new listings page of kraken or did I not write it down at the time. I check new listings for Kraken daily, practically, and even if a day or two goes by when I miss checking I usually catch up quickly.
CryptocurrencyBlot
کراکن لیست کرد! رمز ارز جدیدی که همه جا پیچید (و شاید ندیدید)

Kraken slipped this one past the main new listings page that I noticed today.
CryptocurrencyBlot
(LAYER) solayer "neutral after listing"
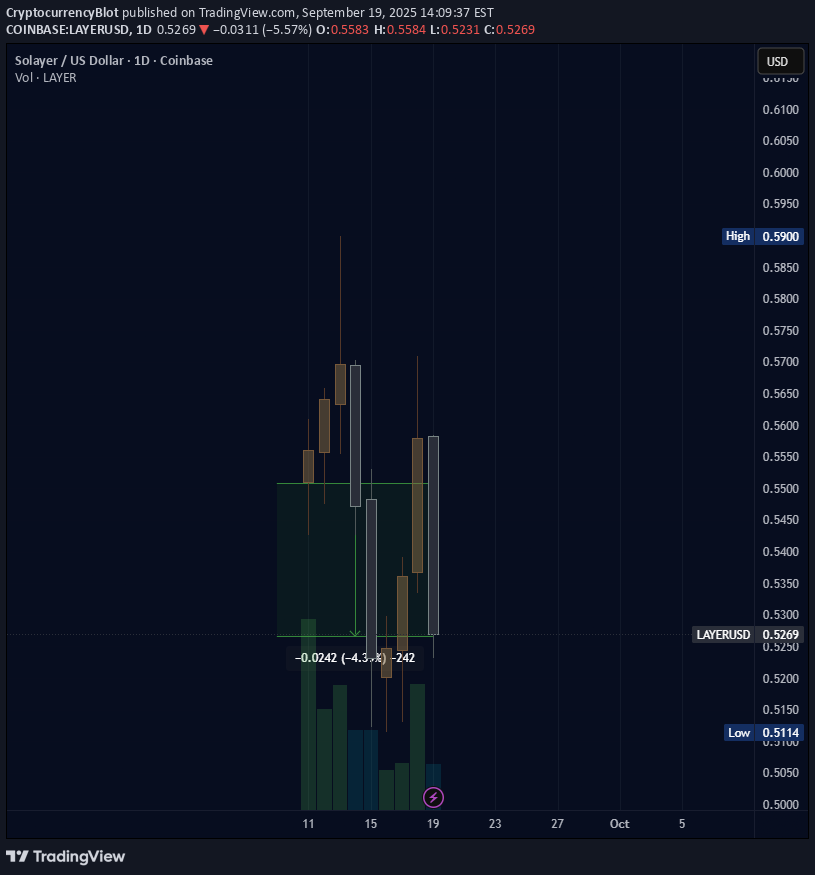
Solayer listed to coinbase remains neutral, slightly negative.
CryptocurrencyBlot
(BTC) bitcoin "years - boxes - overlap"
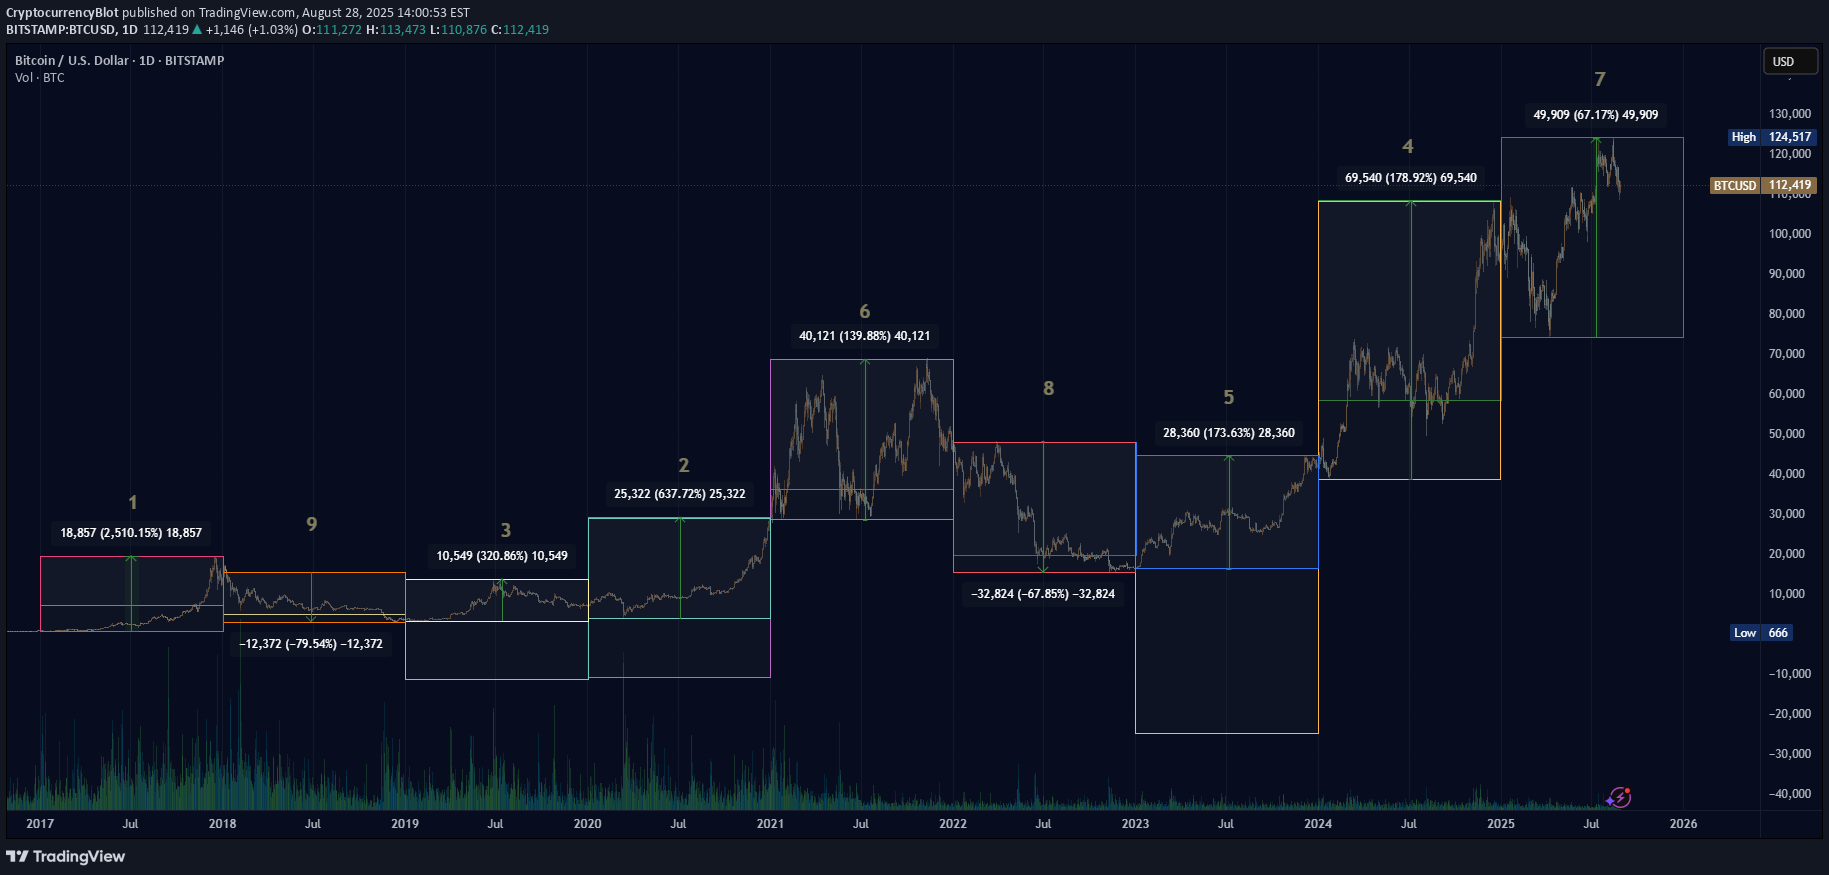
Essentially, the boxes in the chart gives and easy way to see Bitcoin between years correlated by using colored boxes. Using boxes I overlapped each year based on the following year's performance, working backwards. There are two boxes for each year in different colors and only touching the highest point of each year to see the difference overlapped between years and amount of gains or losses with the price of Bitcoin chart. I do not have a bias towards Bitstamp it is the chart with the longest view of BTC at the time of adding BTC to my watchlist some years ago.
CryptocurrencyBlot
(BTC) bitcoin "balancing act"
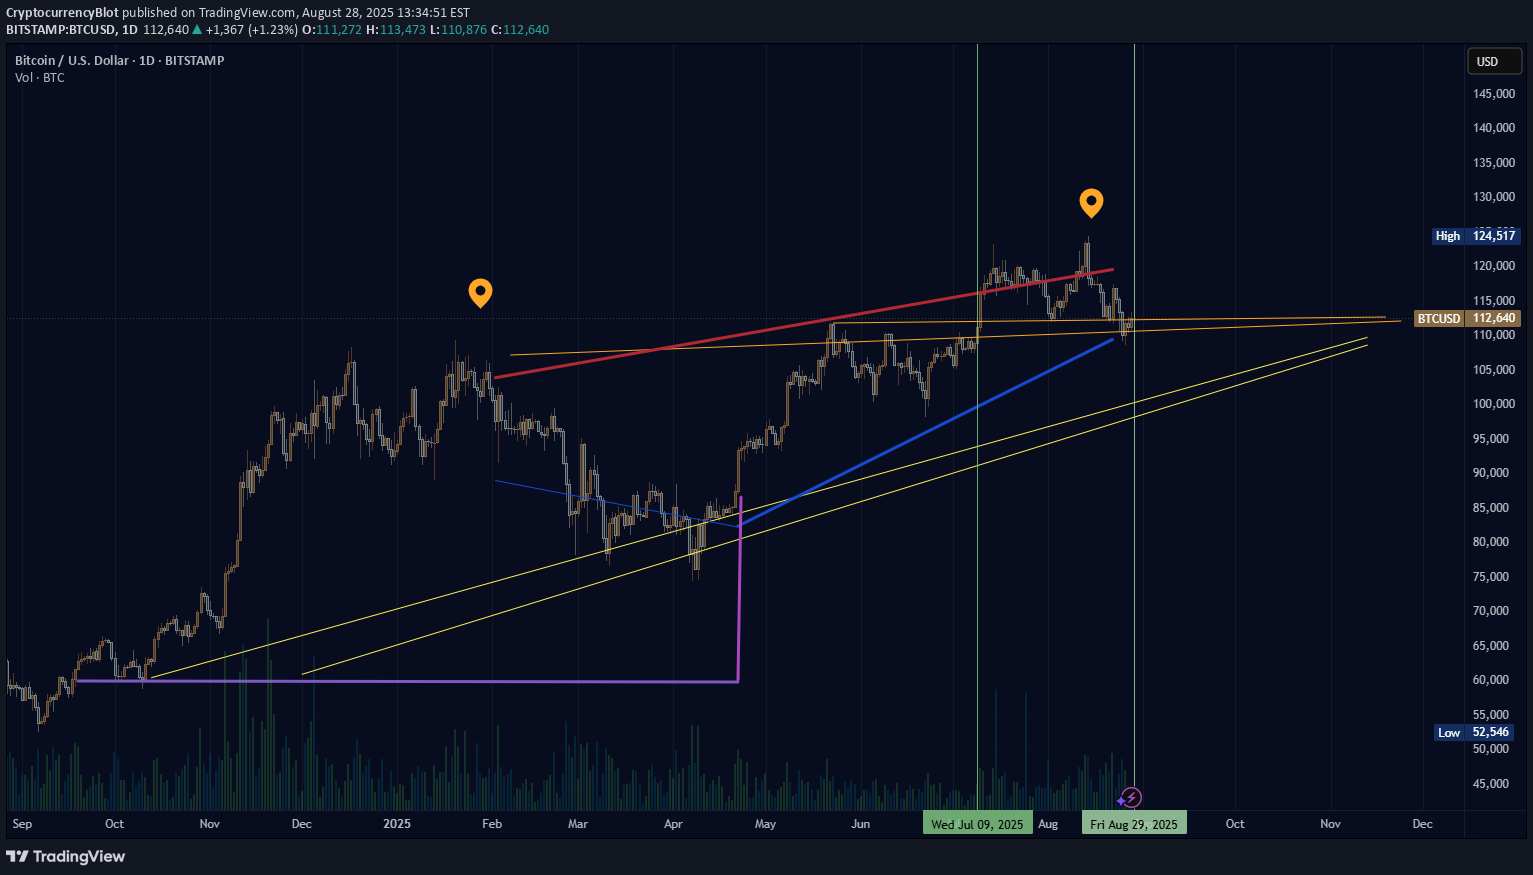
Lines drawn based on indications in an attempt to foresee the direction of bitcoin. Day chart. Yellow Lines are aligned with variable average patterns. Orange lines are more concretely focused on consistent timeframe measurements. The trading psychology right now is not at its peak. Array pressure on the price is high where May 2025 was the last time BTC was at a low array buying pressure. Similarly, Bollinger Band phase is positive with the last negative being around April to May 2025. Bear power is in control right now. Selling pressure chop chai confirms the bear power indicator. Directional momentum does appear to be being taken over by selling also indicated is the strong average gauge to confirm the strength of selling. MA quad gives an indication the price is losing with the losing line in control over the top of the winning line. Triple descending pyramids appeared last week with the last time multiples of those type appeared happened around the start of February 2025. MACD lines have crossed 0 moving in a downward direction. The balance of the imaginary weighted scale appears to be shifting to the right as in falling until the balance is level. The price of BTC often follows no logical path or makes any sense. This image is not entirely made up and relies on indicators which are unpublished that I drew over to show what is stated in the post.
CryptocurrencyBlot
(SHIB) shiba inu "array -> YTDs" fib-no-chi
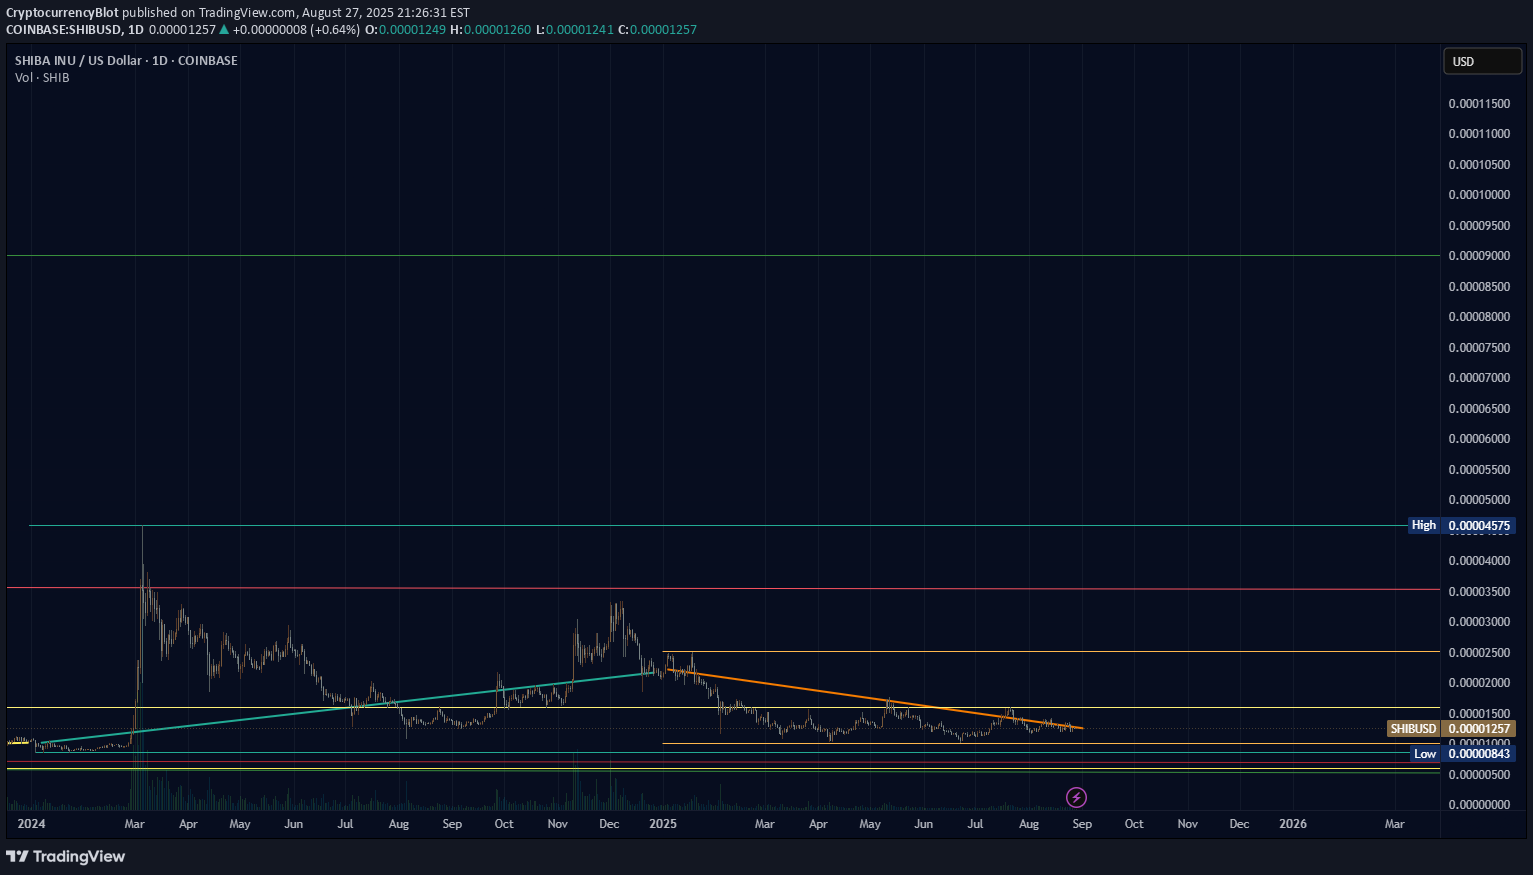
Shiba Inu through the years based on concurrent array measures that act as a pseudo fibonacci kind of doodle. Nothing else to say. The price is not necessary to analyze so much as look at the picture and look at it. The price of Shiba Inu is still so very low, so low. Not enough three zeroes after the decimal. Could the logo image of Shiba Inu ever become a different background color? Is the company locked in on always using red as the background color for Shiba Inu?
Disclaimer
Any content and materials included in Sahmeto's website and official communication channels are a compilation of personal opinions and analyses and are not binding. They do not constitute any recommendation for buying, selling, entering or exiting the stock market and cryptocurrency market. Also, all news and analyses included in the website and channels are merely republished information from official and unofficial domestic and foreign sources, and it is obvious that users of the said content are responsible for following up and ensuring the authenticity and accuracy of the materials. Therefore, while disclaiming responsibility, it is declared that the responsibility for any decision-making, action, and potential profit and loss in the capital market and cryptocurrency market lies with the trader.