
IOTX
IoTeX
| تریدر | نوع سیگنال | حد سود/ضرر | زمان انتشار | مشاهده پیام |
|---|---|---|---|---|
No results found. | ||||
Price Chart of IoTeX
سود 3 Months :
سیگنالهای IoTeX
Filter
Sort messages by
Trader Type
Time Frame

iMoneyTeam
IOTX Buy/Long Signal (4H)

Price is currently trading around two key levels, and in addition to the CH, we also have a bullish iBOS on the chart. The overall structure supports buy/long positions, so we are looking for long entries around the support zones. We have two entry points and positions should be built using a DCA approach. The targets have been clearly marked on the chart. If you would like us to analyze a coin or altcoin for you, first like this post, then comment the name of your altcoin below.

pullbacksignal
سیگنال خرید قوی IOTX: الگوی کف گرد و اهداف قیمتی هیجانانگیز!
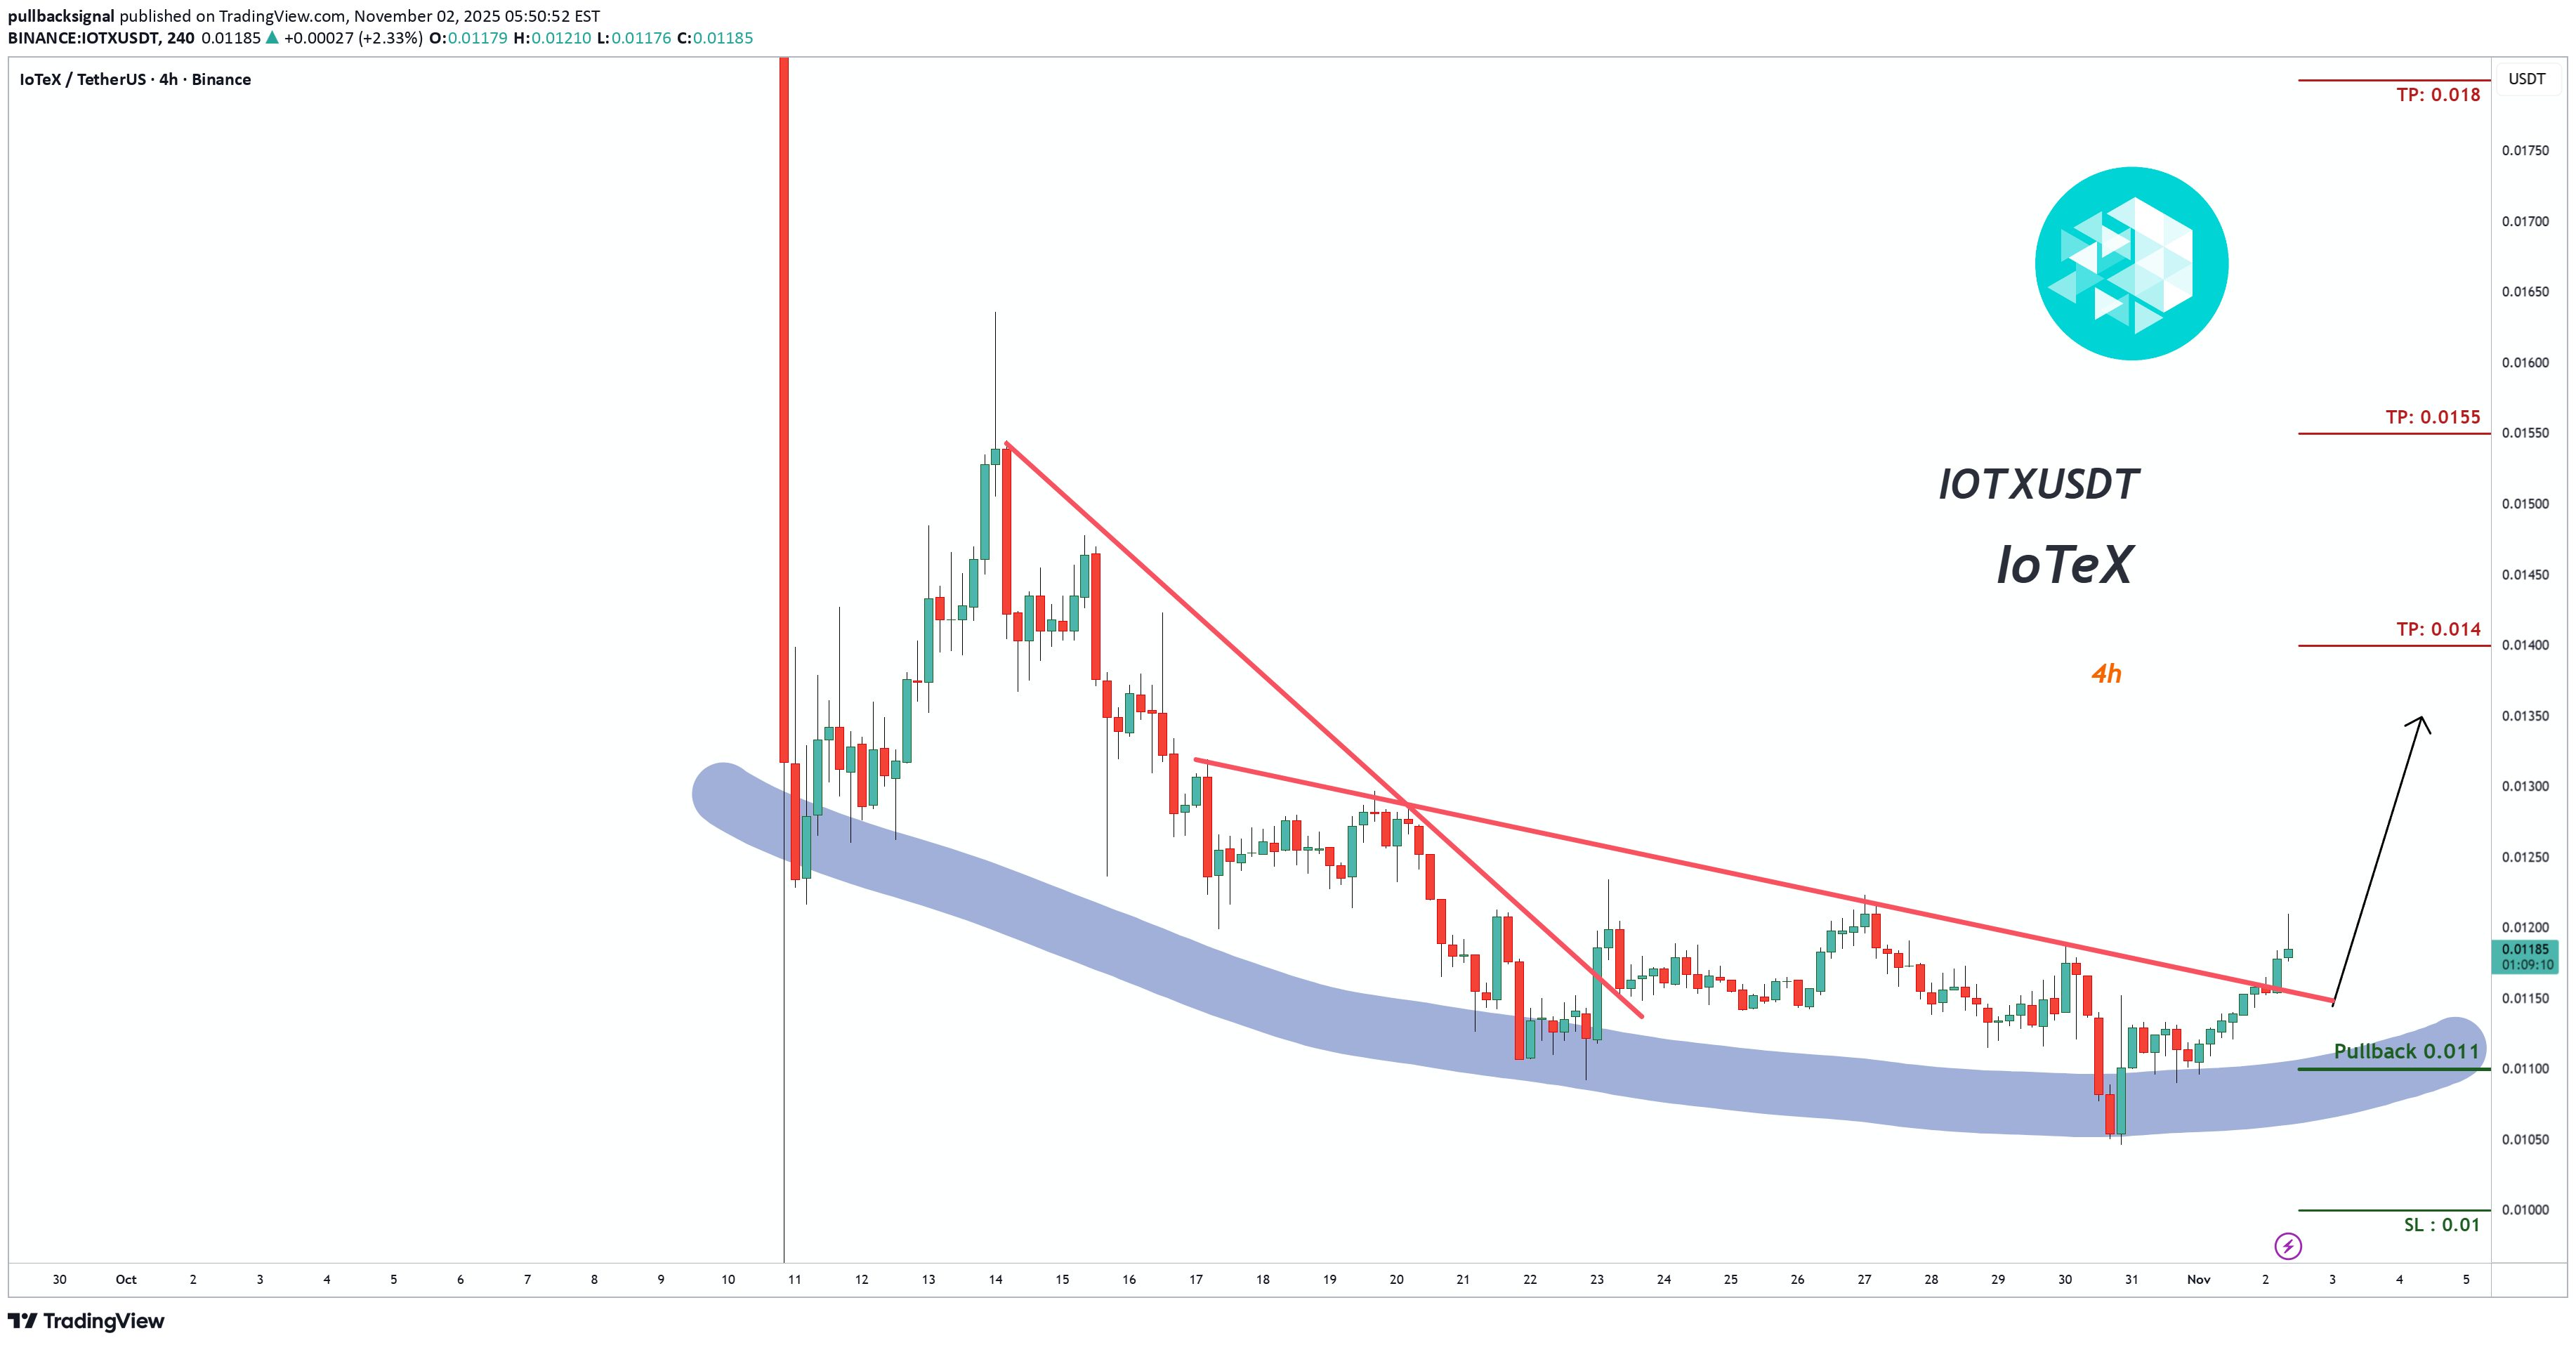
Trading Setup: There is a Trading Signal to Buy in IOTXUSDT IoTeX (4h) (spot) Traders can open their Buy Trades NOW ⬆️Buy now or Buy on 0.011 ⭕️SL @ 0.01 🔵TP1 @ 0.014 🔵TP2 @ 0.0155 🔵TP3 @ 0.018 What are these signals based on? Classical Technical Analysis Price Action Candlesticks Fibonacci RSI, Moving Average , Ichimoku , Bollinger Bands Risk Warning Trading Forex, CFDs, Crypto, Futures, and Stocks involve a risk of loss. Please consider carefully if such trading is appropriate for you. Past performance is not indicative of future results. If you liked our ideas, please support us with your likes 👍 and comments .

king-off-crypto
iotx ready to fly

After being corrected and collected, it's ready for a good move. Don't miss it, buddy.

bakbak88
Iotx, superb beautiful amd pattern
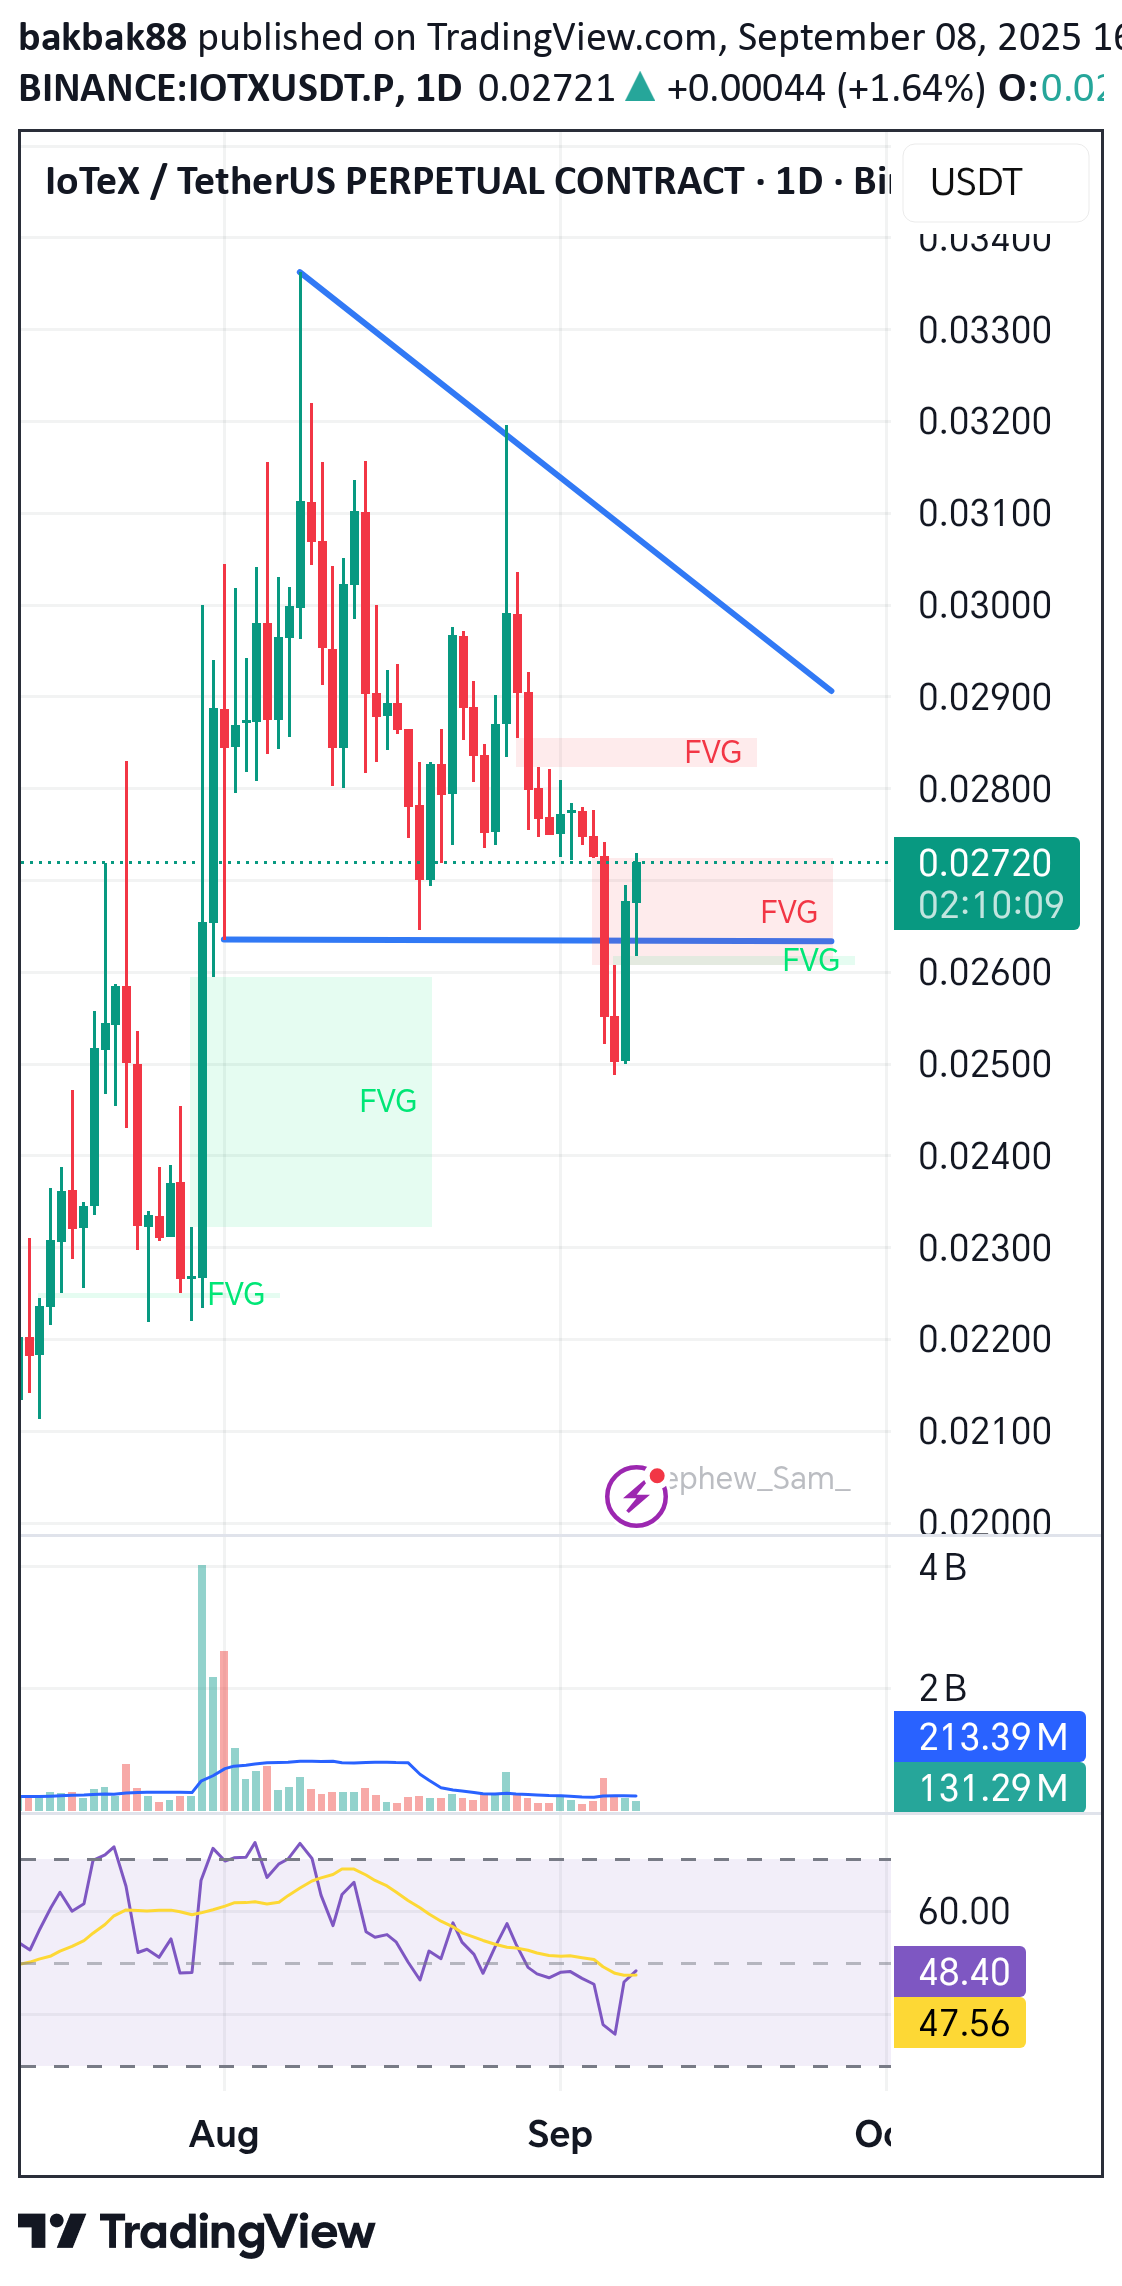
Just completed accumulation, manipulation pattern.. Time to mark up and pump to the moon

AltcoinPiooners
Unlock Profit Potential: $IOTX Trading Signal with Clear Targets
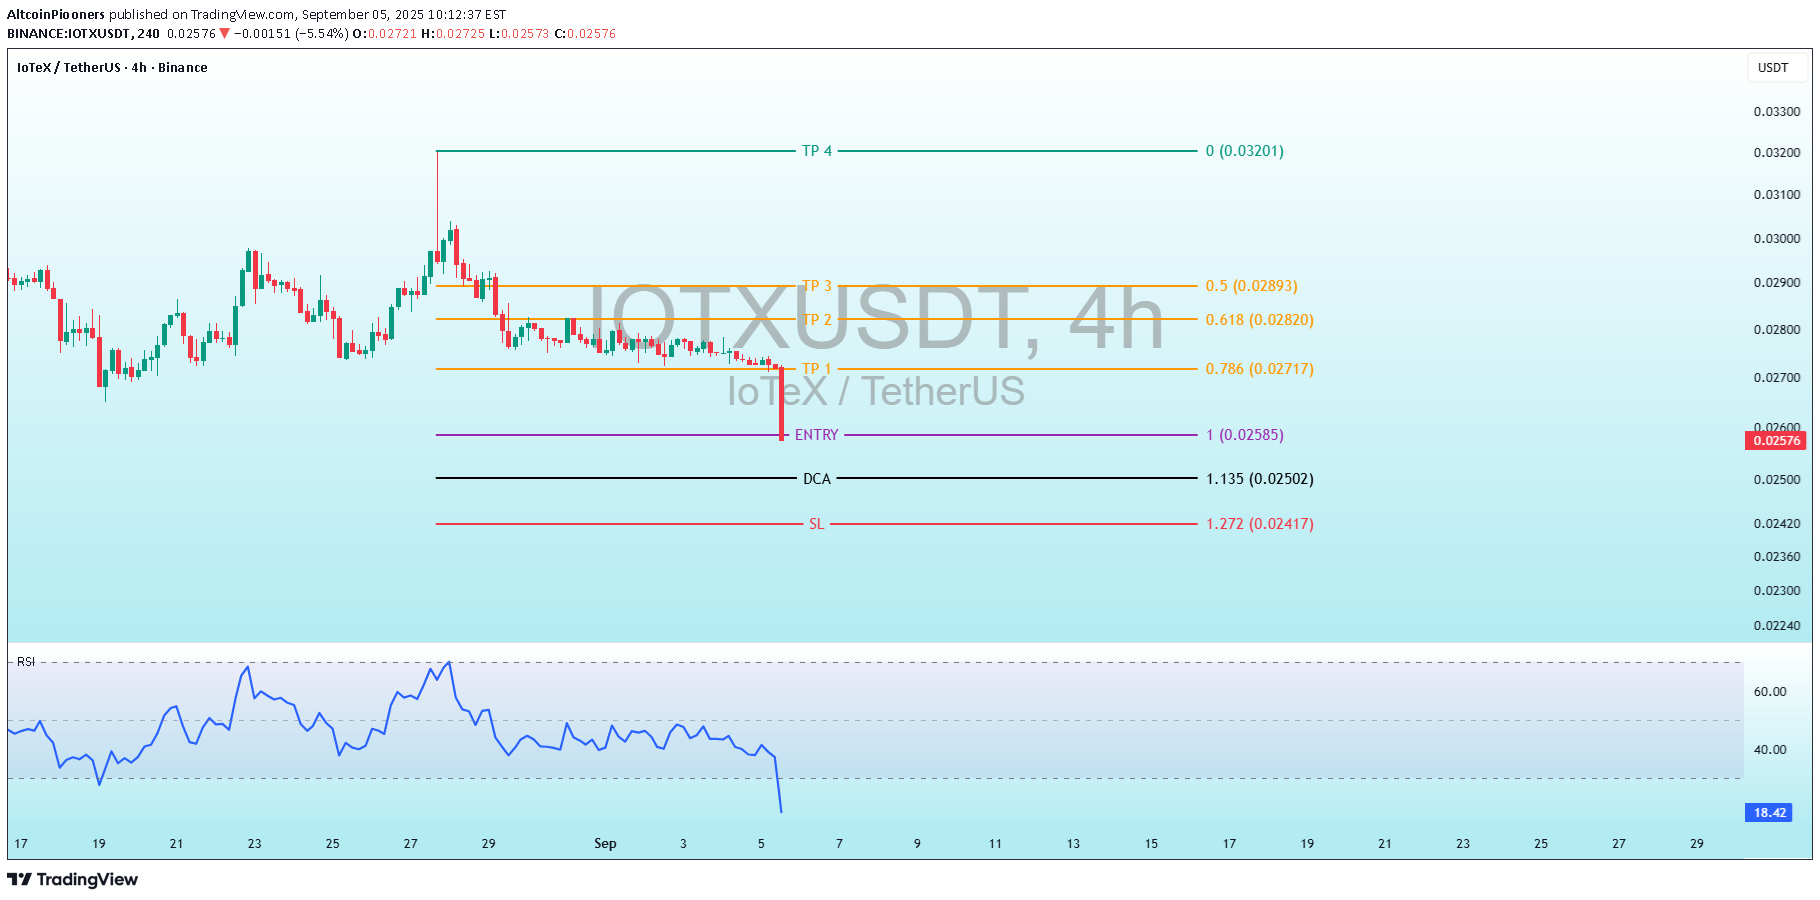
IOTXUSDT Unlock Profit Potential: I IOTX Trading Signal with Clear Targets! Detailed Description of the Signal: Entry (ENTRY): Price level: 1 0.02580 0.02570 USDT This is the point where a trader is recommended to enter a long position. Take Profit Levels (TP): TP1: 0.786 (0.02717 USDT) TP2: 0.618 (0.02820 USDT) TP3: 0.5 (0.02893 USDT) TP4: 0 (0.03201 USDT) These levels represent potential profit targets, with TP4 being the highest target, indicating a full position exit or maximum profit point. Dollar-Cost Averaging (DCA): Price level: 1.135 (0.02502 USDT) This suggests an additional entry point to average the cost if the price moves against the initial entry. Stop Loss (SL): Price level: 1.272 (0.02417 USDT) This is the level where the trade should be closed to limit losses if the price moves unfavorably. Chart Analysis: The chart shows a recent sharp upward movement in price, followed by a consolidation phase. The signal appears to be based on a potential continuation or reversal pattern. Horizontal lines on the chart mark the key levels (ENTRY, TP1-TP4, DCA, SL), with the ENTRY level aligning near a recent support or breakout point. The RSI at the bottom indicates momentum, with the index recently dropping from overbought territory (above 70) to around 19.44, suggesting a potential oversold condition that might support a bullish reversal.ENTRY 0.02585 TP 1 ✅ +7.62% PROFIT DCA ENTRY 0.02502 1 ✅ +11.20% PROFIT 🧗♂️ Fall seven times, stand up eight. Interested for Premium 👉 t.me/Altcoin_Piooners Follow for signals! 🔥#Crypto #Trading #CryptoSignals #IOTX #Altcoins

Crypto-by-PRIME
IOTX / USDT : Breaking out from symmetrical triangle
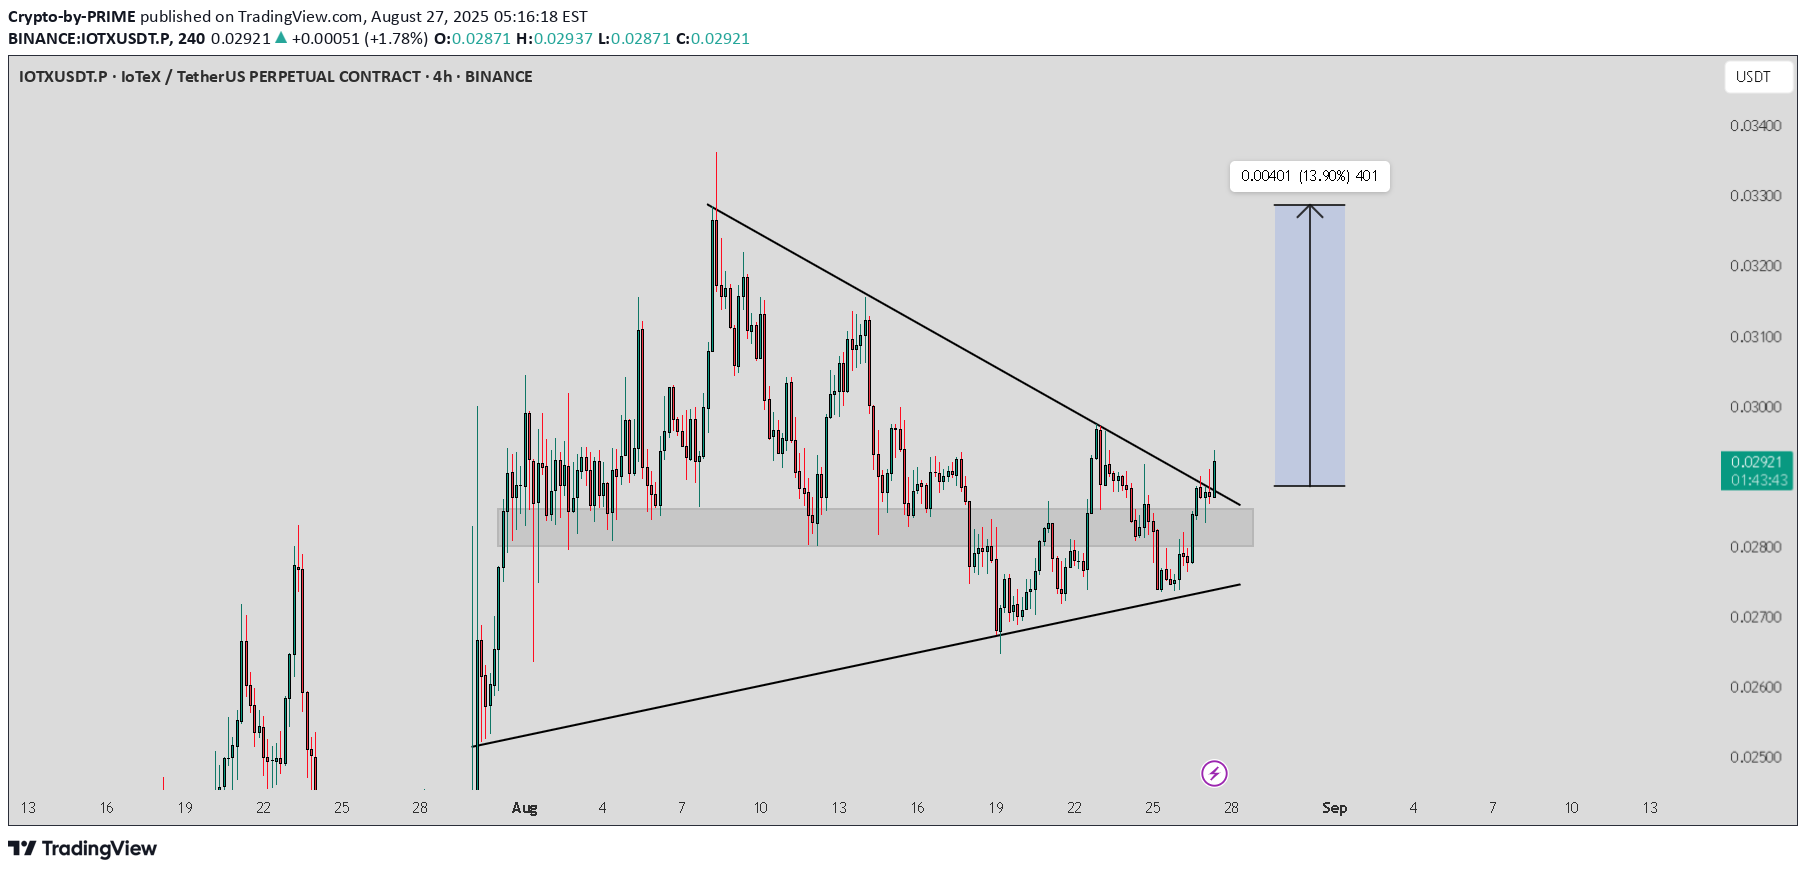
IOTX/USDT has broken out from the symmetrical triangle. The key now is confirmation — a retest of the breakout zone may occur before continuation. If this level holds, price could rally toward the $0.0315 – $0.033 zone (+13–15%). Trade Setup: Entry: On successful retest hold / bullish confirmation candle above $0.030 Targets: $0.0315 – $0.033 Stop-Loss: Below $0.028 (breakout zone invalidation) Best strategy: Wait for retest confirmation to avoid getting trapped in a false breakout.

asilturk
IOTX Bir gün de 300 Kademe Yukseldi

Yesterday (21 hours ago) 0.02600 ¢ (Cent) price range we share and the proposal for the futures transactions IOST crypto currency at the moment of 0.02900 cents has reached the level of 300 levels increased and continues to rise. Futures (Capsur) friends are required to update their transactions as mentioned below. The liquidity levels of those who open 50 × transactions of 1000 $ 1000 are below the price of 0.01550 ¢ (Binance) 0.01550 ¢ (for the Mexc platform) for 1000 $ minor 20 × Popsa. Foot note; There is no risk for those who make spot transactions .. Contact you only for futures transactions, I don't waste time for stocks .. The minimum investment amount can write investors $ 50,000 or more. I wish you plenty of gains

coin_mastermind
IOTX Presses Against Channel Resistance on Daily Chart

💥 I IOTX is back on breakout radar as price tests the upper boundary of its ascending channel on the daily timeframe 📈 The structure has held cleanly so far, and price action is now tightening just beneath resistance 🔍. If buyers push through this level, we could see an explosive move to the upside 🚀 However, a rejection here might trigger a short-term pullback toward mid-channel support ⏬ 👀 Critical moment unfolding — break or bounce? Let’s see who takes control from here. Not financial advice.
asilturk
IOTX Şimdi Değilse Ne Zaman?

9.44 billion of the 260m dollar company's 10 billion supply of the main dish target in circulation 0.05 In my opinion, hard and solid movements may come. The purpose of keeping shortly in futures (leveled) hunting a few whales and turning to other alt coins, respectively, according to our strategy, the graph is not bad, and the volume is close to 100 million dollars. I leave the point of making a profit. Foot Note: In the graphics I share crypto, if possible, I share futures (leveled) friends and myself as personal notes. For this reason, not in shares, but pay attention to the liquidity level and risk status in crypos.

ZEUS_Market_Alerts
IOTX ANALYSIS

🔆#IOTX Analysis : Channel Following ⛔️⛔️ As we can see that #IOTX is following ascending channel on daily time frame. We can see a bullish formation here. And if it trade with good volume then we can see a proper bullish move in #IOTX 📈📈 🔖 Current Price: $0.02400 ⏳ Target Price: $0.03500 ⁉️ What to do? - Keep your eyes on the chart, observe trading volume and stay accustom to market moves.🚀💸 🏷Remember, the crypto market is dynamic in nature and changes rapidly, so always use stop loss and take proper knowledge before investments. #IOTX #Cryptocurrency #ChartPattern #DYOR
Disclaimer
Any content and materials included in Sahmeto's website and official communication channels are a compilation of personal opinions and analyses and are not binding. They do not constitute any recommendation for buying, selling, entering or exiting the stock market and cryptocurrency market. Also, all news and analyses included in the website and channels are merely republished information from official and unofficial domestic and foreign sources, and it is obvious that users of the said content are responsible for following up and ensuring the authenticity and accuracy of the materials. Therefore, while disclaiming responsibility, it is declared that the responsibility for any decision-making, action, and potential profit and loss in the capital market and cryptocurrency market lies with the trader.