
GME
GameStop
| تریدر | نوع سیگنال | حد سود/ضرر | زمان انتشار | مشاهده پیام |
|---|---|---|---|---|
No results found. | ||||
Price Chart of GameStop
سود 3 Months :
سیگنالهای GameStop
Filter
Sort messages by
Trader Type
Time Frame

mohamadgadimpour
GME Analysis
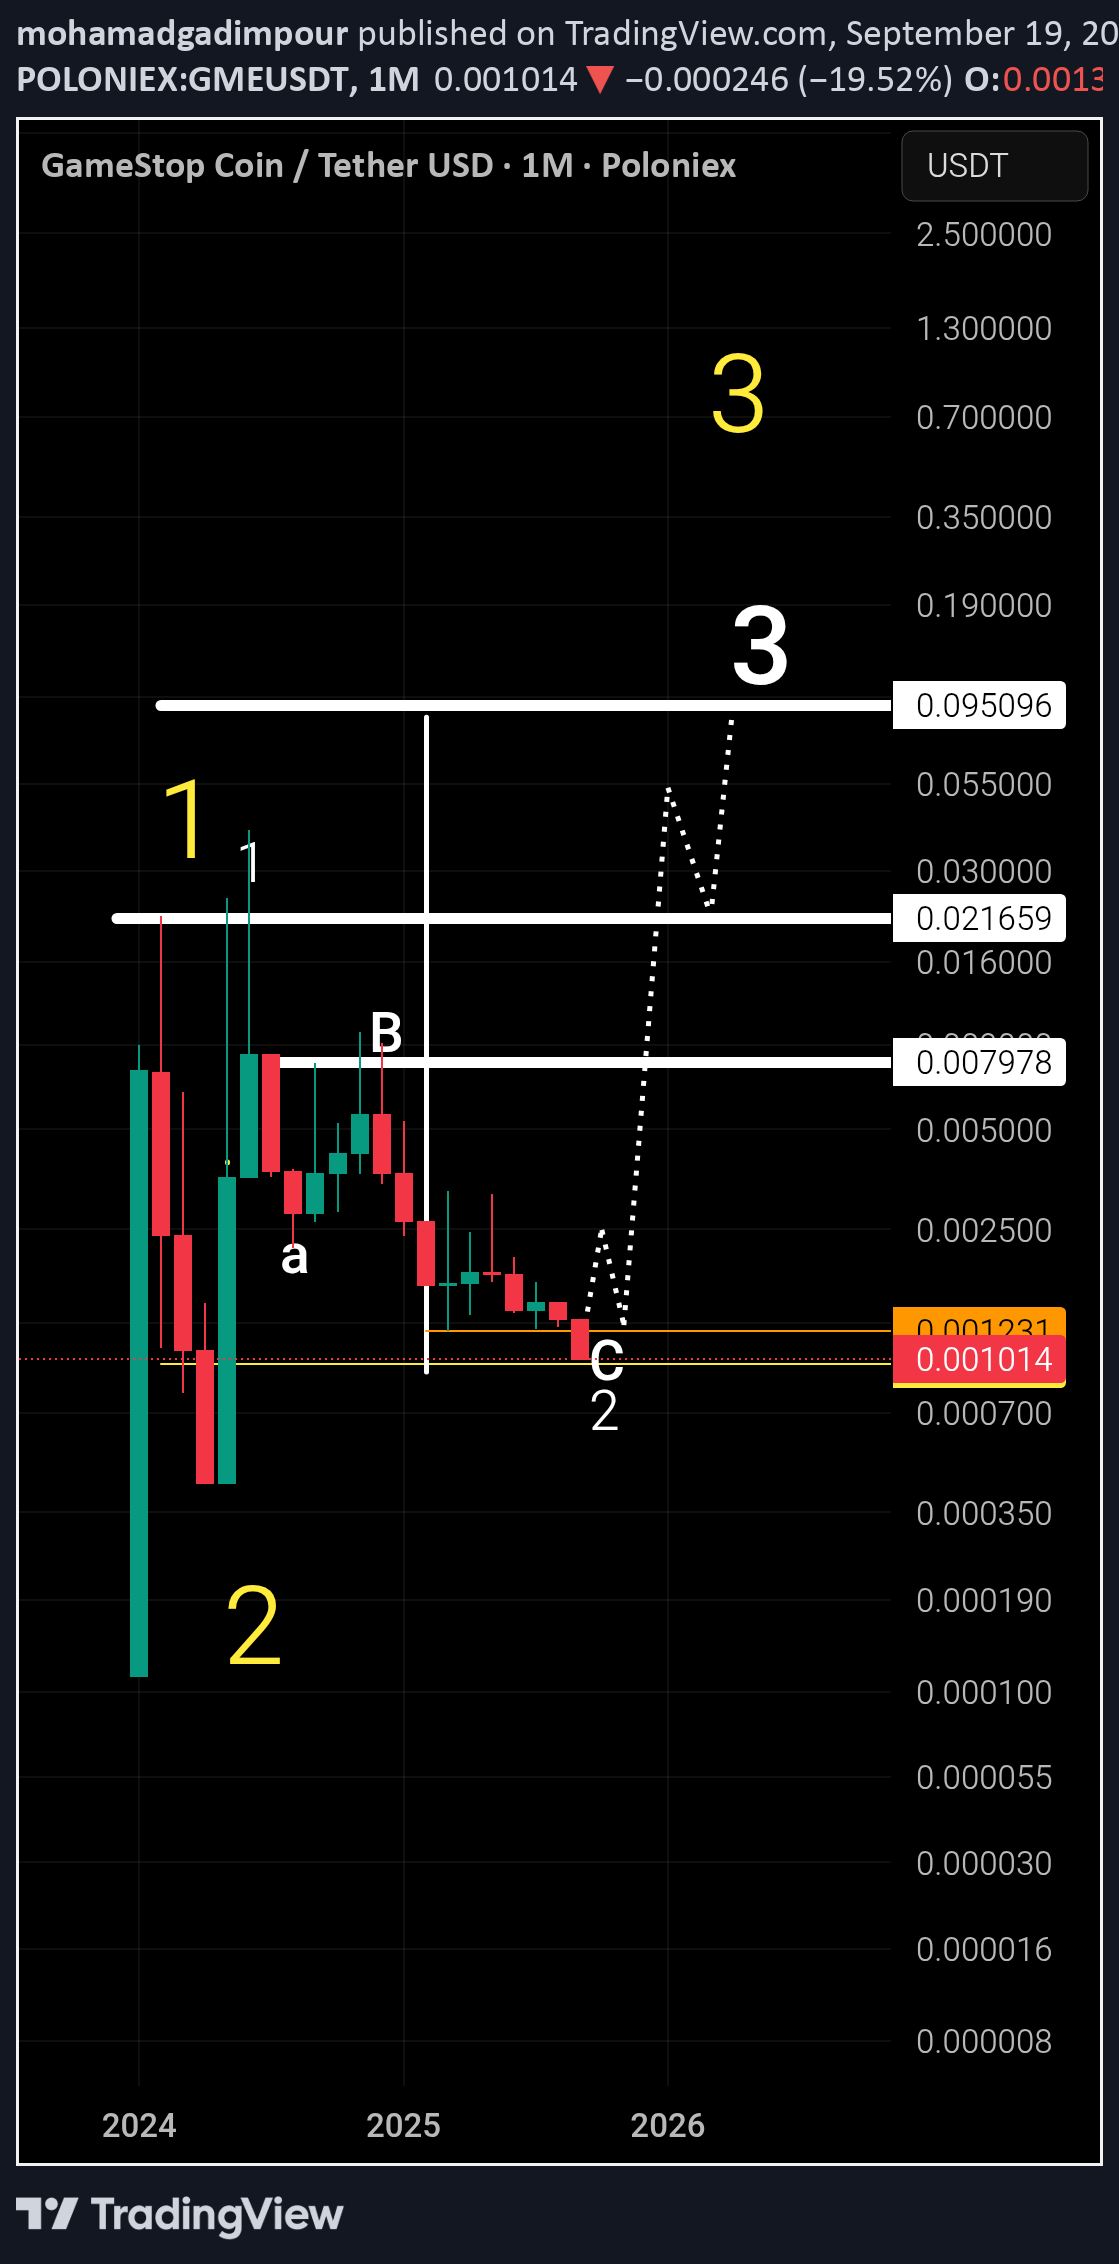
If, according to my analysis, it will be marketed by the end of the year

marshyyy
GME on SOL: The Wyckoff Accumulation Range Continues to Unfold
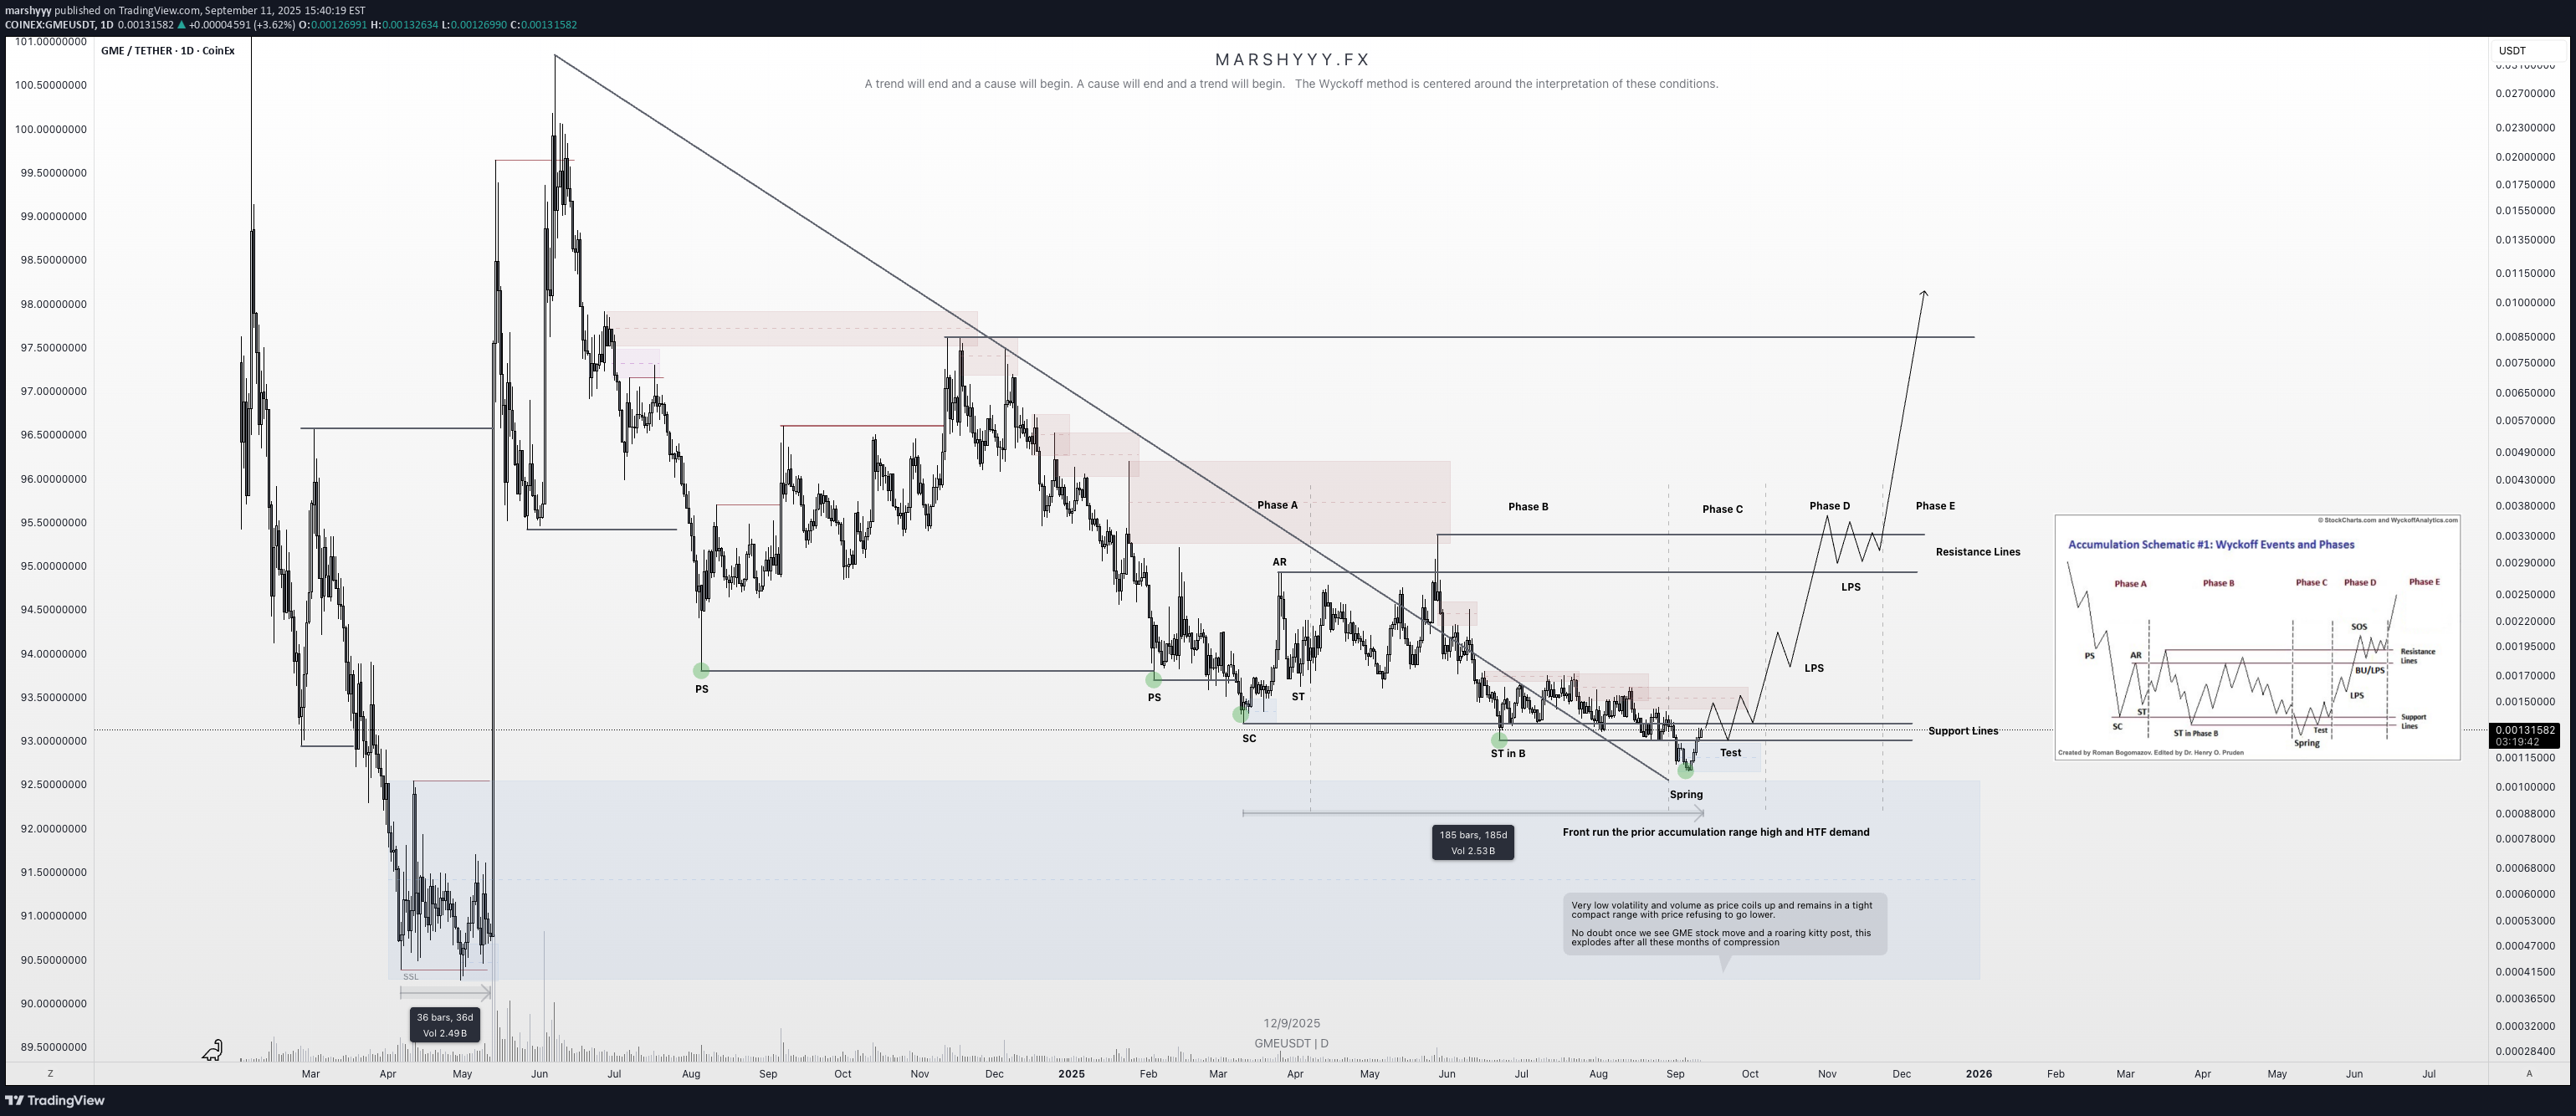
GME on SOL continues to unfold in its Wyckoff accumulation range, now spanning 185 days. It’s currently in phase C of the accumulation range development, and I’m looking for confirmation of price reclaiming the range low, taking support off the support lines and daily demand, and starting to form bullish orderflow. That, to me, would signal my thesis is correct and that price is in the process of a HTF deviation and reversal from these lows. Looking at the monthly, price has respected this accumulation range structure and has always rejected from the lows — just as it’s doing now. This could form a bullish pinbar close on the monthly from this low and reverse from here, aligning with the LTF if we get confirmations. Note this: the HTF is aligning to the LTF here imo, giving strong confluence. The same applies to the 1W, 2W, and 3W charts — all show the range well defined, rejecting the range low and deviating over many months. There’s only so long this will go on before the cause has developed enough and the effect takes place as price reverses and moves higher. And remember this: the longer the cause (development of the range), the greater the effect (the price movement that follows the cause). Reflect on price and think about where we could head if everything aligns as I’m forecasting and the narrative plays out as a whole. For me, the targets are clear and always have been with this coin (and AMC, WSB, and KITTY on SOL). I truly believe GME will smash a new ATH when the GME stock movement takes off (and it doesn’t seem too far away now!) and Roaring Kitty comes back on X. I think we’ll see an absolute melt-up in them all, with capital rotating between them all and the GME stock. The way I see it, price is in this local accumulation range as marked. Once we break out of this, the target is the ATH at $230 million MC — and let’s be honest, price moved from $2.83 million to $150 million in 3 days after breaking out of its prior accumulation range spanning only 36 days. Think what could happen after ranging here for 185 days within this local accumulation range, sat inside a larger range from the low of August 2024 where price has ranged for over 400 days! I think we see $500 million (a modest 2x) or maybe even $1 billion MC. I don’t think that’s out of the question if everything unfolds as I’ve discussed before — so imagine what AMC and WSB on SOL could also run to... It’s funny, because GME on SOL has been the weakest pair of them all despite being the centre of it all. Is it a telling sign of manipulation during the accumulation phase? Who knows. 1D: 2D: 3D: 1W: 2W: 3W: 1M:

DEXWireNews
GameStop-Themed Memecoin Spikes 167% Amidst Latest Bitcoin Play

A memecoin named after GameStop Corp. GME skyrocketed about 167% Tuesday breaking out of a falling wedge pattern after the video game retailer adopted Bitcoin as a treasury reserve asset.Build on the Ethereum blockchain, GameStop Coin (GME) soared 167% in the last 24 hours, dwarfing returns by blue-chip cryptocurrencies like Bitcoin and Dogecoin The latest uptick widened the coin's monthly returns to an astounding +3778.06%. However, a cursory glance at its trajectory revealed periods of short-term rise followed by sharp collapse, indicating its speculative nature.Note that the cryptocurrency isn't tied to GameStop in any way but seeks to capitalize on the hype surrounding the meme stock.Technical OutlookAs of the time of writing, GME coin is up 9.92% currently retraced as hinted by the Relative Strength Index (RSI) at 60. With the growing hype surrounding meme coins Gamestop coin is looking poised for a comeback as indicated by the daily chart - the wedge is still in play with a speculated surge to the January high, 2025. GameStop (gamestop-coin.vip) Price Live DataThe live GameStop (gamestop-coin.vip) price today is $0.000101 USD with a 24-hour trading volume of $1,595,457 USD. GameStop (gamestop-coin.vip) is up 4.09% in the last 24 hours, with a live market cap of $41,512,628 USD. It has a circulating supply of 411,297,484,026 GME coins and a max. supply of 420,690,000,000 GME coins.

WaveRiders2
GME/USDT Analysis

The price has broken out of the red resistance zone.🎯 First Target: Green line

MISANTHROPE3
PATIENCE.

Errybody shilling GME. I say Wait. I'm expecting a double bottom.

NavidBasatzadeh
GME

This currency has the potential to grow during the daily timeframe, subject to loss limits.

mas4paulius
Everybody knows whats next for this 40m cap gem

It looks like some same basket coins its about to move again. Expect nothink but buy and hold till 1$ which is more than realistic with 6.89B circulation. Good luck Boys !

weslad
GMEUSDT buy opportunity

GMEUSDT is showing accumulation within an ascending triangle formation, with the price recently breaking above the neckline. This breakout opens a significant buying opportunity upon a successful retest of this zone. The main plan is to re-accumulate within this current price towards the area of buy back zone, with the final target marked on the chart for guidance on profit taking.Breakout again

بختیاری ، 4 سال صبر برای امروز
تشکیل موج ۳ صعود ،، این یک سونامی است ،،

دوست عزیز، آیا برای یک سونامی (رشد ناگهانی) آماده هستید؟ بعداً از من تشکر کرد! به نظر من، سهام شرکت گیماستاپ بعد از پیروزی ترامپ در انتخابات، شاهد یک صعود چشمگیر بود و موج سوم صعودی هم در حال آغاز شدن است. توکن جم هم به تبعیت از سهام شرکت، صعود قویای را تجربه کرده است. سقف کانال صعودی ۲۲۰۰ دلار است، در حالی که قیمت فعلی هر سهم فقط ۲۴ دلار است! ببینیم توکن سولانا ما چقدر صعود داشته است.

سید مهدی هاشمی
بروز رسانی تحلیل گیم استاپ (1403/08/13 ساعت 20:00)

به نام خدا. سلام و وقت بخیر. پیش درآمد تحلیل: هر تحلیلی که از من دنبال میکنید، باید در راستای تأیید استراتژی و سبک معاملاتی خودتان از آن استفاده کنید. بنده هیچ مسئولیتی در قبال معاملات شما ندارم. هدف، به تصویر کشیدن ساختاری است که شاید مخاطب به دلیل هیجان ناشی از نوسانات قیمت یا عدم مهارت کافی تکنیکال قادر به تشخیص آن نباشد. تحلیل یعنی بررسی احتمال بیشتر. این به این معنا نیست که احتمال کمتر برابر صفر است و همان میزان کمتر هم به قوت خودش باقی میماند. تصویر پیوست، نمودار ۱۲ ساعته GME/USDT است. قیمت در لحظه نگارش ۰.۰۰۳۵۱۹ در حال نوسان است. به ساختار توجه کنید. در روزهای اخیر و با اصلاح از سقف ۰.۰۰۵۱ تا محدوده ۰.۰۰۴ طی پایه اول اصلاحی که به کار خودش خاتمه نداد، ما شاهد پایه دوم ریزشی و برابر پایه اول به میزان ۲۰٪ به محدوده ۰.۰۰۳۴ و حمایت داینامیک (خط روند) تایم روزانه هستیم. با توجه به تکمیل پایه دوم اصلاحی در محدوده ۰.۰۰۳۴ و همچنین حمایت خط روند تایم بلند و الگوهای فراکتالی و همچنین وجود الگوی سر و شانه صعودی و ۵۰٪ ناحیه رنج (کادر بنفش رنگ) و با شروع به کار بازارهای مالی از ساعات آینده، انتظار فرسایش این اصلاح و بعد از دست رفتن مومنتوم ریزشی و گسترش قیمت در محور زمان، احتمالاً باید به از سر گیری روندی صعودی هر چند ناپایدار چشم امید داشت. نکته بعدی، حضور قیمت و دیگر آلت کوینها بر روی حمایتهای ماژور و عددی است. همانطور که در پیامها و تحلیلهای گذشته عنوان شد، حد ضرر بهینه برای دوستان نوسانگیر محدوده ۰.۰۰۲۹ است و فقط دامنه نوسانی ما بزرگتر شده. ساختار با اینکه در ریز موج موفق به تشکیل سقف بالاتر از سقف قبلی (HH) نشده، ولی هنوز بالای کف قیمتی بالاتر (HL) قرار دارد. دوستان، بنده از محدوده قیمتی صحبت میکنم نه نقطه قیمتی و شاید با تلورانس (انحراف) ۵٪ از محدودهها شاهد چرخش روند باشیم.
Disclaimer
Any content and materials included in Sahmeto's website and official communication channels are a compilation of personal opinions and analyses and are not binding. They do not constitute any recommendation for buying, selling, entering or exiting the stock market and cryptocurrency market. Also, all news and analyses included in the website and channels are merely republished information from official and unofficial domestic and foreign sources, and it is obvious that users of the said content are responsible for following up and ensuring the authenticity and accuracy of the materials. Therefore, while disclaiming responsibility, it is declared that the responsibility for any decision-making, action, and potential profit and loss in the capital market and cryptocurrency market lies with the trader.