
marshyyy
@t_marshyyy

What symbols does the trader recommend buying?
Purchase History
پیام های تریدر
Filter
marshyyy
GME on SOL: The Wyckoff Accumulation Range Continues to Unfold
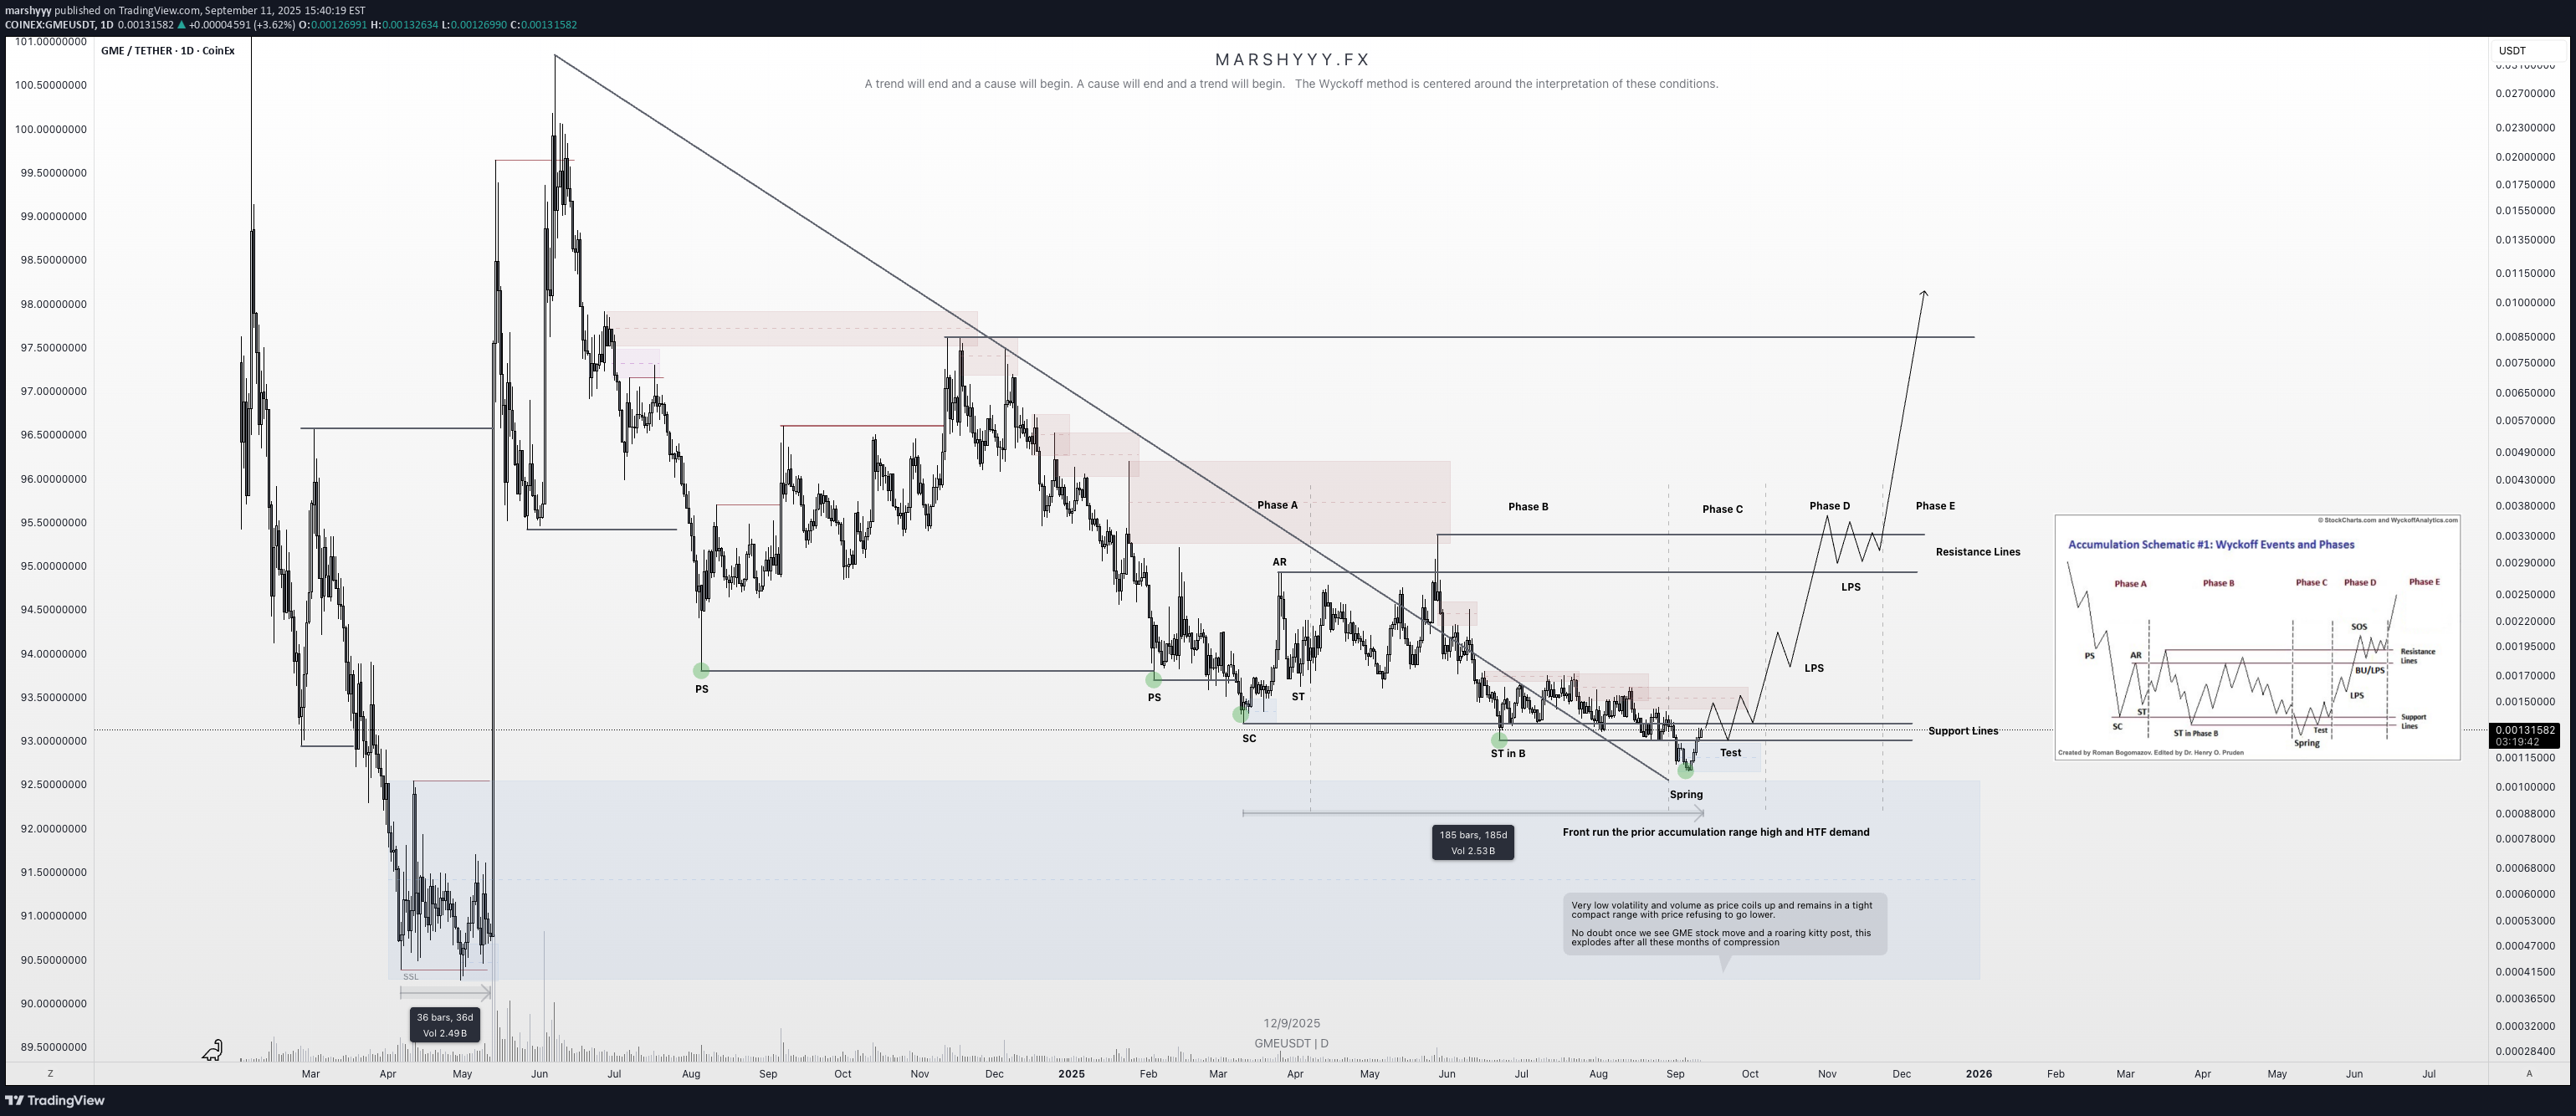
GME on SOL continues to unfold in its Wyckoff accumulation range, now spanning 185 days. It’s currently in phase C of the accumulation range development, and I’m looking for confirmation of price reclaiming the range low, taking support off the support lines and daily demand, and starting to form bullish orderflow. That, to me, would signal my thesis is correct and that price is in the process of a HTF deviation and reversal from these lows. Looking at the monthly, price has respected this accumulation range structure and has always rejected from the lows — just as it’s doing now. This could form a bullish pinbar close on the monthly from this low and reverse from here, aligning with the LTF if we get confirmations. Note this: the HTF is aligning to the LTF here imo, giving strong confluence. The same applies to the 1W, 2W, and 3W charts — all show the range well defined, rejecting the range low and deviating over many months. There’s only so long this will go on before the cause has developed enough and the effect takes place as price reverses and moves higher. And remember this: the longer the cause (development of the range), the greater the effect (the price movement that follows the cause). Reflect on price and think about where we could head if everything aligns as I’m forecasting and the narrative plays out as a whole. For me, the targets are clear and always have been with this coin (and AMC, WSB, and KITTY on SOL). I truly believe GME will smash a new ATH when the GME stock movement takes off (and it doesn’t seem too far away now!) and Roaring Kitty comes back on X. I think we’ll see an absolute melt-up in them all, with capital rotating between them all and the GME stock. The way I see it, price is in this local accumulation range as marked. Once we break out of this, the target is the ATH at $230 million MC — and let’s be honest, price moved from $2.83 million to $150 million in 3 days after breaking out of its prior accumulation range spanning only 36 days. Think what could happen after ranging here for 185 days within this local accumulation range, sat inside a larger range from the low of August 2024 where price has ranged for over 400 days! I think we see $500 million (a modest 2x) or maybe even $1 billion MC. I don’t think that’s out of the question if everything unfolds as I’ve discussed before — so imagine what AMC and WSB on SOL could also run to... It’s funny, because GME on SOL has been the weakest pair of them all despite being the centre of it all. Is it a telling sign of manipulation during the accumulation phase? Who knows. 1D: 2D: 3D: 1W: 2W: 3W: 1M:
marshyyy
DOGE Update: Reversal Playing Out — $1+ in Sight?

DOGE is playing out almost exactly as forecast back on June 14th, where I was monitoring for price to sweep the SSL and tap into range low demand within this larger HTF range. Price did exactly that — pushing into discount, tagging the marked demand zone, and bottoming out right where I expected the reversal. I DCA’d hard at $0.165 after the initial low printed — just as planned. Now sitting around +50% on those buys, and my plan remains to ride this out toward the ATH at $0.74 and potentially $1+. The HTF closes forming here — across 3D, 4D, 5D, 6D candles — are showing clear strength. For me, the low is likely in, and I’m expecting new higher highs and ATHs from here. Now it’s just about letting the market do its thing, trailing stops, and taking profits into strength as alerts and targets get hit. Zooming way out — I’m also watching DOGE’s 10-year uptrend channel. Price has once again tagged the lower bound of that channel, and historically, this has led to moves back to the channel highs. 🧠 Layer on a fib projection from the previous ATH to the bear market low, and we get: 1.272 Fib → ~$1.54 1.618 Fib → ~$3.92 Both of which align perfectly with the upper bounds of that long-term trend channel — giving us a key HTF reversal zone to monitor in the future. In summary: - Reversal from demand ✅ - DCA filled ✅ - HLs printing ✅ - Targets = ATH and beyond - Watching HTF fibs + channel highs for eventual cycle top formation DOGE is doing what DOGE does — don’t overcomplicate it. 1D: 3D: 1W: 1M:
marshyyy
BTC – Final Push Before the Top? Here's What I’m Watching

Been getting a lot of questions recently about where I think BTC tops this cycle, so I figured it’s time to lay out what I’m seeing on the higher timeframes and what could be coming next. First off, I want to stress this again — USDT.D will be the key chart for spotting the top. It’s been one of the most accurate indicators across the board for understanding tops and bottoms. But it’s even more powerful when used alongside broader structure and confluence, which is what I’m doing here. Looking at BTC’s high timeframe structure, I’ve been tracking this ascending trend channel since 2023 — and we’ve remained within its bounds beautifully. Every leg up has been met with a reaction near the channel highs, while each major correction has tapped into the lower channel support or just below midline before continuing the trend. Right now, price is pushing back up toward that upper channel resistance, and if it behaves like it has previously, I’d expect it to act as a major magnet again. That aligns with a projected range of $140,000 to $160,000, depending how deep the wick runs or how extended this move gets from the channel midline. On top of that, fib extensions from the previous high to low give us another layer of confidence. We’ve already seen a reaction at the 1.272 level, which paused price temporarily. The next big fib? The 1.618 — which sits right around $138k — adding confluence with the top of this HTF trend channel. What makes this even more interesting is that this move is aligning near-perfectly with the 4-year cycle structure, which suggests a potential cycle top around September 2025. That’s roughly two months away, and it fits the pattern of previous cycles where BTC tops approximately 18–20 months post-halving. As we approach this zone, I’ll be watching for the usual signs: slowing momentum, bearish divergence, volume anomalies, and rejection candles into resistance. But I won’t just be relying on the BTC chart alone. I’ll be stacking confluences from other key indicators too — USDT.D, BTC.D, macro risk indicators, and stablecoin flows — to confirm if this is truly the top or if there’s one more leg left in the tank. Once the top does form, whether it's $138k or $160k or somewhere in between, I think we move into the distribution phase that begins the next macro downtrend. The next few years will be about preservation and accumulation again, and I’m already eyeing zones like $49k and below as potential long-term HTF demand levels when that time comes. For now, we’re in what I believe is the final bullish leg of this cycle. I’m positioned, prepared, and watching closely for signs of exhaustion as we move into this zone of confluence. Let the market do its thing — just make sure you’ve got a plan for when the music stops.
marshyyy
FET – HTF Setup Primed for Expansion
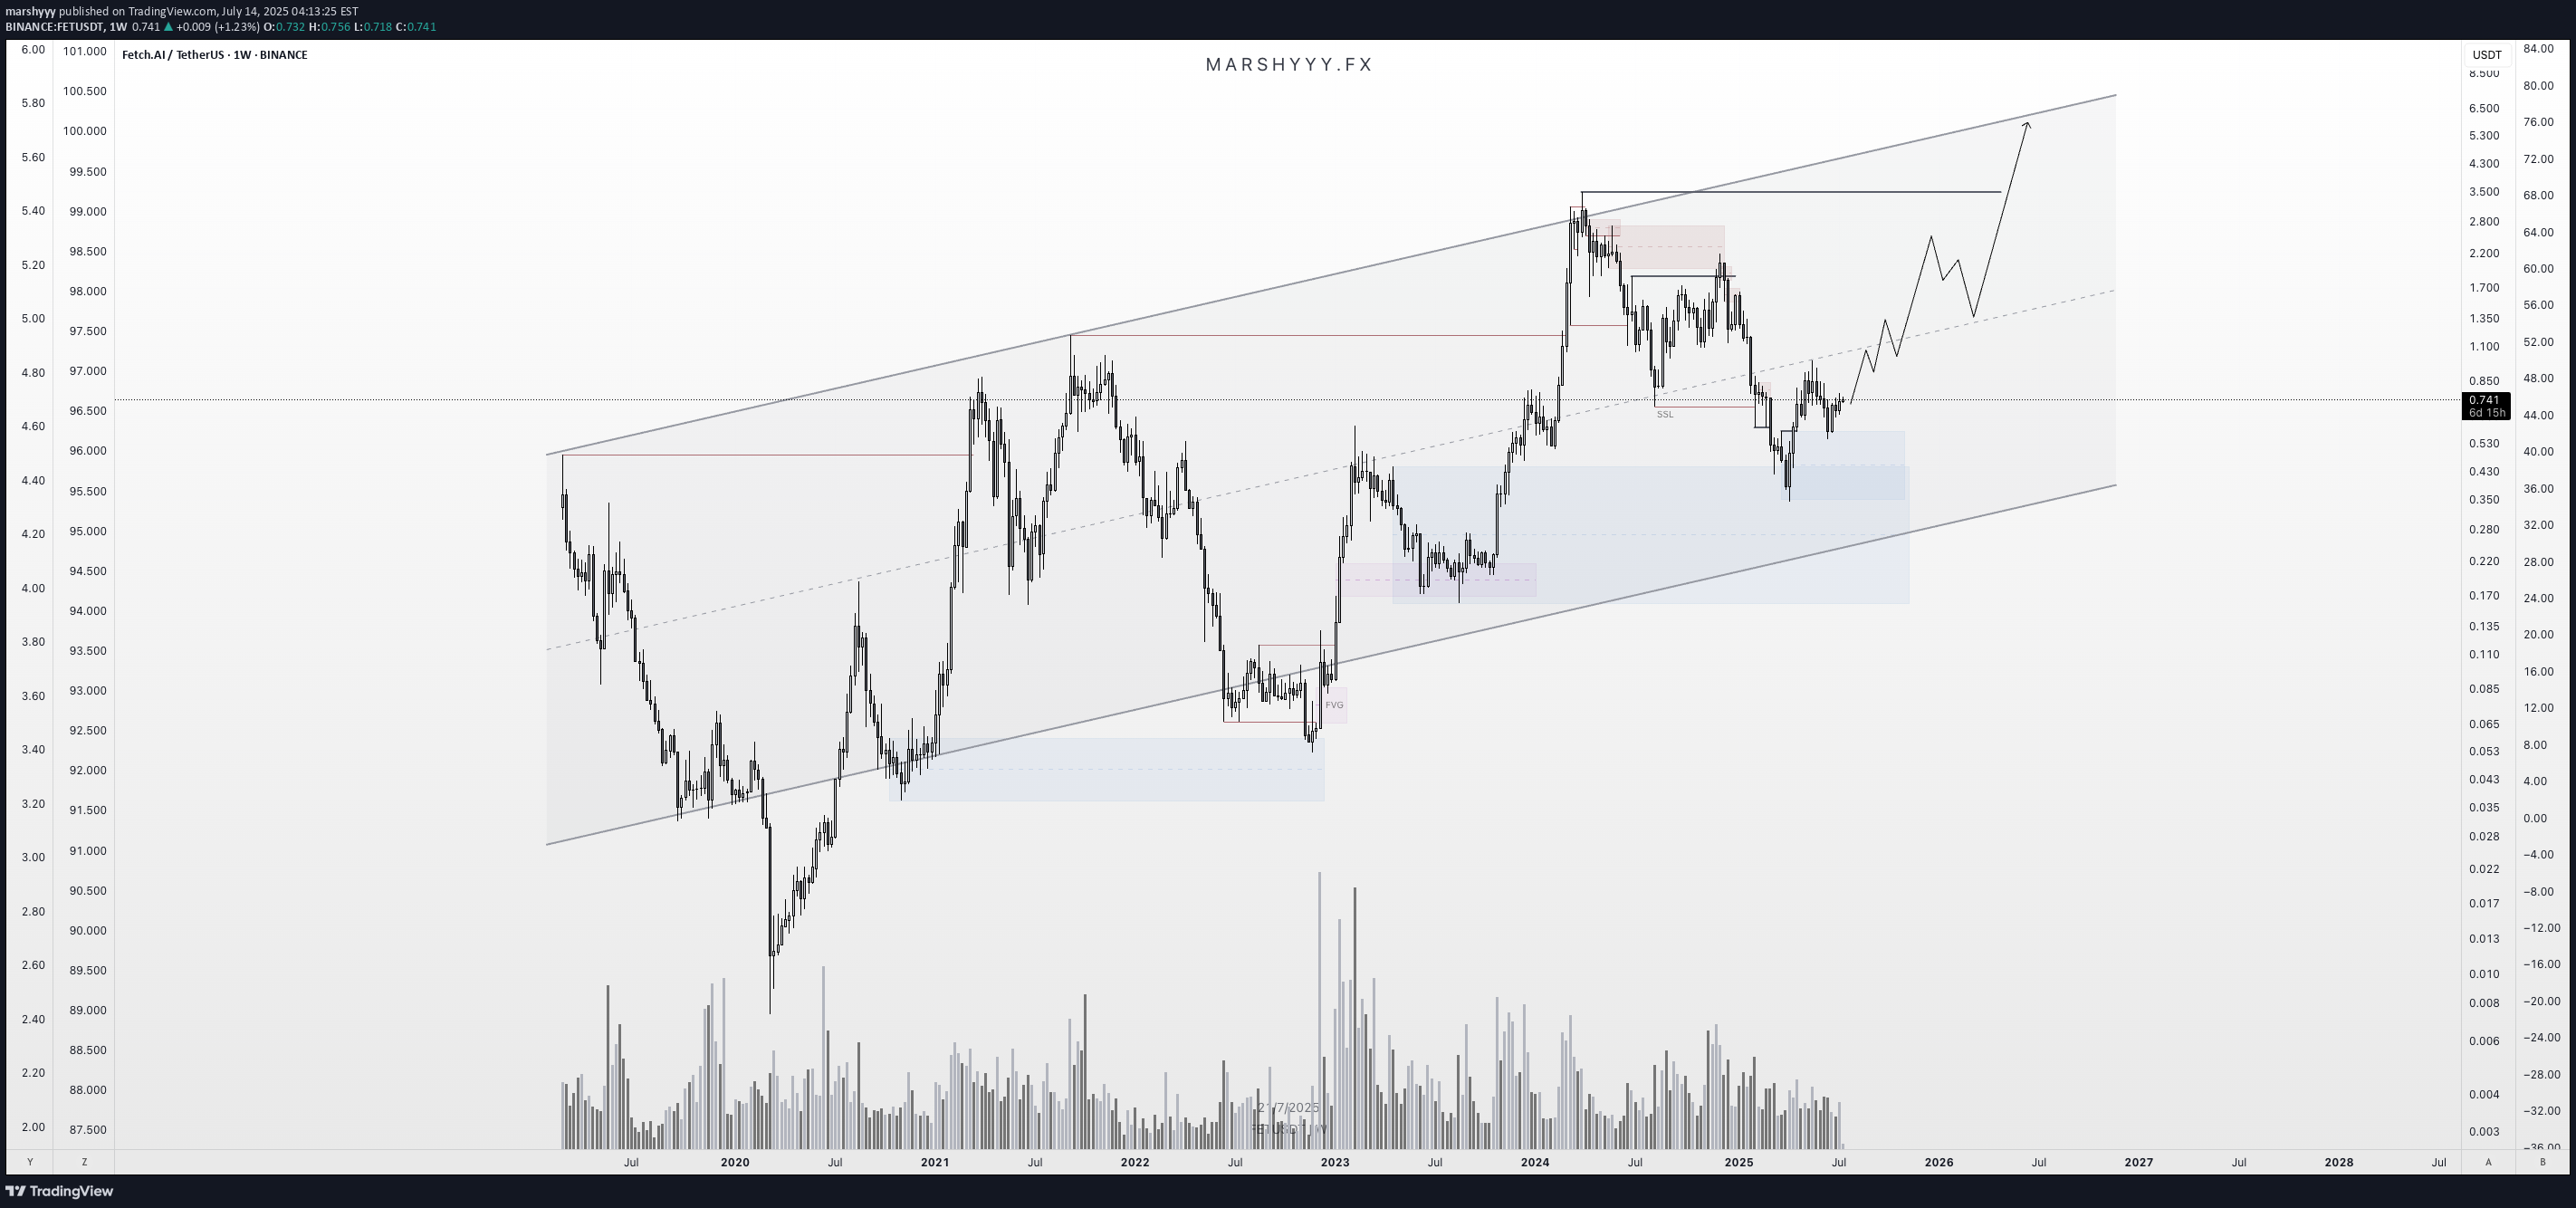
FET is looking strong here from a high time frame perspective — currently sitting around $0.739, well into the discount zone of the macro trend channel. We’ve got: ✅ Price holding monthly demand ✅ A clear swing higher low forming on the weekly and 3W ✅ Already seen the first expansion leg out of demand ✅ Now potentially loading the next move higher Zooming out, price is still trading below the midline of the long-term uptrend channel — and a move back to the upper boundary puts targets in the $6 region, aligned with a new higher high. 📈 HTF Structure Midline rejection flipped support Demand tested and respected HL printed after clean retest 370% upside just to retest the prior HH at $3.50 HTF trend structure still fully intact This setup is also supported by the broader HTF bullish bias across BTC, ETH, and majors, which adds confluence to a potential larger expansion phase for alts — especially strong narratives like AI. 🎯 Targets 🎯 $3.50 = prior high 🎯 $6.00+ = upper channel target / next HTF extension zone From current levels, risk/reward looks very clean. 1W: 3W: 3M:
marshyyy
BTC – Textbook Pullback. New ATHs. What’s Next?

Back in mid-June, I published a BTC update calling for a local correction into HTF demand while most were screaming bear market and waiting for deeper breakdowns. Price action played out exactly as forecasted. BTC swept the $100k swing low, front-ran my first demand zone by $400, and launched into a powerful reversal — just like it did back in April, where it also front-ran the key HTF demand before rallying. That move took us straight into new all-time highs (ATHs) — now trading comfortably around $118k. 🧠 What Happened? ✅ Liquidity sweep of the prior low ✅ Front-run demand zone (perfect HTF structure) ✅ Strong bullish reaction and higher high ✅ Confluence from USDT.D rejection at 5.25% ✅ Alts showing signs of strength as BTC rallies The entire setup aligned perfectly across BTC, USDT.D, TOTAL, and OTHERS.D — all of which I’ve been tracking in tandem. 🔮 What Now? With BTC now in price discovery, I expect continuation higher — but not without the possibility of a short-term pullback. 📉 A potential retest of the $108k zone isn’t off the table. This level aligns with: - Prior breakout structure - Range high retest - Local demand before continuation But even if we go straight up — I remain HTF bullish into the final phase of this cycle, supported by: - USDT.D structure still bearish - BTC.D showing signs of distribution - ETH.D and OTHERS.D gaining momentum - Altseason rotation already starting to pick up 🧭 The Macro Outlook The 4-year cycle projection still points to a Q3 2025 top — likely between August late and September based on historical cycle timing, but this could deviate. That gives us a window of 2–3 months for this final leg to unfold — and it’s already in motion. Stay focused. Stick to your plan. Ride the trend, don’t chase it. Let me know what levels you're watching next, and whether you think we get that $108k retest — or we go vertical from here. 1D: 3D: 4D: 1W: 1M: — Marshy 🔥
marshyyy
Final Shakeout Before BTC’s Last Leg Up?

BTC Update Well due update here... Since my last forecast, price pushed higher without giving the pullback I was anticipating — instead sweeping liquidity above the prior ATH. After taking that BSL, price stalled and has since been ranging, showing clear signs of bearish momentum creeping in. We're seeing bearish orderflow on the LTF and daily, and volume is thinning out up at these highs — not ideal for bulls. USDT.D is also pushing higher and showing strength, which typically leans bearish for BTC in the short term. The structure on that chart is bullish and supports the idea of a BTC pullback being likely before any continuation higher. That said, I'm still pro-trend bullish overall — as I mentioned in April — thanks to the clean bullish shift from the range lows and clear signs of accumulation. We’ve got textbook last points of support (LPS) and unmitigated demand sitting below current price, which are prime candidates for a reversal. Right now I’m eyeing two key levels: Upper demand zone / LPS — lining up with the top of the prior accumulation range. This has strong confluence as a breakout-retest zone. Lower refined weekly/2W demand — valid if we see a deeper flush or capitulation leg, though less likely in the short term. My focus is on the first level. I’ll be watching for reactions and reversal signals if price taps into it. Same logic applies to USDT.D as it approaches nearby supply zones. Overall, I see this as a healthy correction — overdue after an extended leg — and expect BTC to push higher and break ATHs once demand is retested and confirmed. Zooming out: the 4-year cycle is approaching its final stages, with data suggesting a cycle top could form around Q3/Q4 2025 — likely between August and October, if past cycles rhyme. I’ll be monitoring major assets against that timeline and will look to scale out and risk-off when the confluences begin aligning with that macro cycle window. Just think... 1 last BTC leg up... Final altseason hype to drag in latecomers... Then the cycle ends — and the trap shuts as we re-enter bear territory. Charts: 1D: 3D: 1W: Extra: 1M:
marshyyy
Bitcoin 4-Year Cycle Structure – Technical Breakdown

Bitcoin 4-Year Cycle Structure – Technical Breakdown This chart examines Bitcoin’s historical 4-year cycle behaviour, focusing on the repeating market structure observed across the last three cycles: Bull Market → Bear Market → Accumulation/Recovery → Halving → Expansion. Key Observations: 🔹 Cycle Timing Consistency Each of the past three cycles has shown a consistent duration between the halving and the final bull market peak—typically between 500–550 days. Based on that timing, the current cycle suggests we are still ~100 days away from a potential macro top. 🔹 Post-Halving Correction is Expected Corrections shortly after the halving have historically marked mid-cycle retracements, not macro tops. The current pullback is structurally aligned with the 2017 and 2021 expansions, where Bitcoin consolidated before pushing to final highs. 🔹 Altcoin Market Segments Lagging TOTAL2 (Total Market Cap excluding BTC) TOTAL3 (Excluding BTC & ETH) OTHERS (Altcoins excluding top 10 by market cap) All remain below their prior cycle all-time highs, which historically occurs before the full market cycle concludes. These segments often accelerate after BTC has established dominance, typically in the later stages of the bull market. 🔹 USDT Dominance Suggests More Upside USDT.D is still trending down, which historically reflects increasing risk appetite and capital rotation into crypto assets. Prior cycle tops have aligned with much lower dominance levels, indicating further downside risk for USDT.D, and potential upside for crypto markets. Conclusion: Despite short-term volatility, the technical structure across Bitcoin and broader market indicators suggests the cycle remains in its expansion phase. Timing models, altcoin lag, and dominance signals all point to further upside potential before a full cycle peak is in. 1W: 1M:
marshyyy
DOGE: A Reversal In Development?

Im monitoring for something like this on DOGE with the plan to DCA as it takes SSL and comes into the range low and demand. Looking a little weak here with signs on majors of weakness, i can see this going into the SSL and lower demand areas marked. Still seeing this as a large range development and looking for a HTF bullish reversal to form in this region. Although theres unmitigated demand in the discount below as marked around $0.11, i dont see this targeting that just yet and my main thesis and bias is this potential range and reversal region we are in here. 1D: 3D: 1W: 1M:
marshyyy
BTC on the verge of another accumulation range breakout

Morning all! So its time for a proper set of markups having spent the last few months breaking down the charts in video format for you all. The last BTC update I gave was on 24/03, in the 4 year cycle analysis breakdown. In that video i was expecting lower pricing into SSL and the range lows once more, forming a bottoming structure before seeing a HTF bullish reversal come through, aligning with the 4 year cycle where we have time to continue higher based on past cycle data and where we are in the current cycle. A month later and we have seen that come through wonderfully after the sweep of the range lows and its time to reanalyse now the direction is changing.... BTC has formed another accumulation range down in these discounted levels over the last couple months and there was nothing really interesting taking shape until the last couple of days thats give us some real confirmation of a trend change in this accumulation range that we can now work with. Unlike the August 2024 bottom, there isnt a massive influx of volume on the sweep event. I was able to call the bottom after such a sweep and high volume event back then just days after but in this most recent range we havent seen volume like back in August 2024, so ive had to be more cautious of further downside until we get some market shift confirmations to confirm intent and be on the safer side here whilst still holding my HTF bias of new ATHs before cycle end. As shown on the charts, ive marked up the range and stages. We have carried out the sellers climax event, forming the range low, into the automatic rally (AR) forming the range high, moving into the secondary test (ST) with a failure swing back to the lows which forms the secondary test in phase B. From there we continued to range before putting in another range low deviation in the Spring event, with tests of the range low before seeing this explosive move come through from the spring event back to the range highs. Volume also supports price action with a high influx of volume on the sellers climax low, stopping the prior trend, decreasing volume in the range into supply with a further increase in buyer volume as we deviate the lows in the spring event. We have also broke structure bullish in the range and formed a HH, with a HL yet to be formed.... **So whats next? ** It seems a lot more clear now after the last couple days, and also confirms intent behind the range and i think its safe to say we have formed a bottom here and my focus is now on the upside on BTC from here. After this range high deviation into supply, in this new HH, i wouldn't be surprised to see BTC pull back to the midpoint of the range between $84,000 - $76,500, back into demand and form a last point of support/demand in the accumulation range forming a HL, before another leg higher as shown. With how price has set up, with the demand left behind in the range and the bullish intent, my focus is on BTC forming a HL from demand before a continuation higher in line with my HTF bias that we will see new ATHs again before the cycle end. This is also supported in what im seeing on USDT.D and USDC.D where they are distributing in their ranges in supply with breakdowns in both and moving to a bearish trend. Therefore, when price corrects into these levels i will be looking to allocate risk into the market during the discount of the HL and I will be looking for my buys on DOGE and any other opportunities, where im expecting higher lows in the market before continuations higher across the board. This doesnt mean everything though as many alts are yet to catch up and flip bullish, so my focus will be on the higher quality, stronger coins such as DOGE, but i expect the rest of the market to catch up eventually as BTC runs higher from these lows. 1D: 3D: 1W: 1M:
marshyyy
Global M2 Money Supply Vs BTC

So when we look just at the Global M2 money supply, we can see its increasing and sharply. However, when you look at BTC, BTC is lagging behind, and the increase in M2 Global supply has yet to have an effect on BTC where we would expect to see a price increase as M2 money supply increases. If you compare the M2 Global money supply against S&P500 though, it tells us a different story, where the S&P is leading and BTC is lagging. Signalling to me a catch up in BTC is inevitable at this stage and its being squeezed at these levels as money flow increases. A good signs imo and no doubt BTC catches up to S&P500
Disclaimer
Any content and materials included in Sahmeto's website and official communication channels are a compilation of personal opinions and analyses and are not binding. They do not constitute any recommendation for buying, selling, entering or exiting the stock market and cryptocurrency market. Also, all news and analyses included in the website and channels are merely republished information from official and unofficial domestic and foreign sources, and it is obvious that users of the said content are responsible for following up and ensuring the authenticity and accuracy of the materials. Therefore, while disclaiming responsibility, it is declared that the responsibility for any decision-making, action, and potential profit and loss in the capital market and cryptocurrency market lies with the trader.