
FUN
FUNToken
| تریدر | نوع سیگنال | حد سود/ضرر | زمان انتشار | مشاهده پیام |
|---|---|---|---|---|
No results found. | ||||
Price Chart of FUNToken
سود 3 Months :
سیگنالهای FUNToken
Filter
Sort messages by
Trader Type
Time Frame

CryptoNuclear
آخرین سنگر FUN/USDT: آیا وقت برگشت است یا هشدار سقوط؟
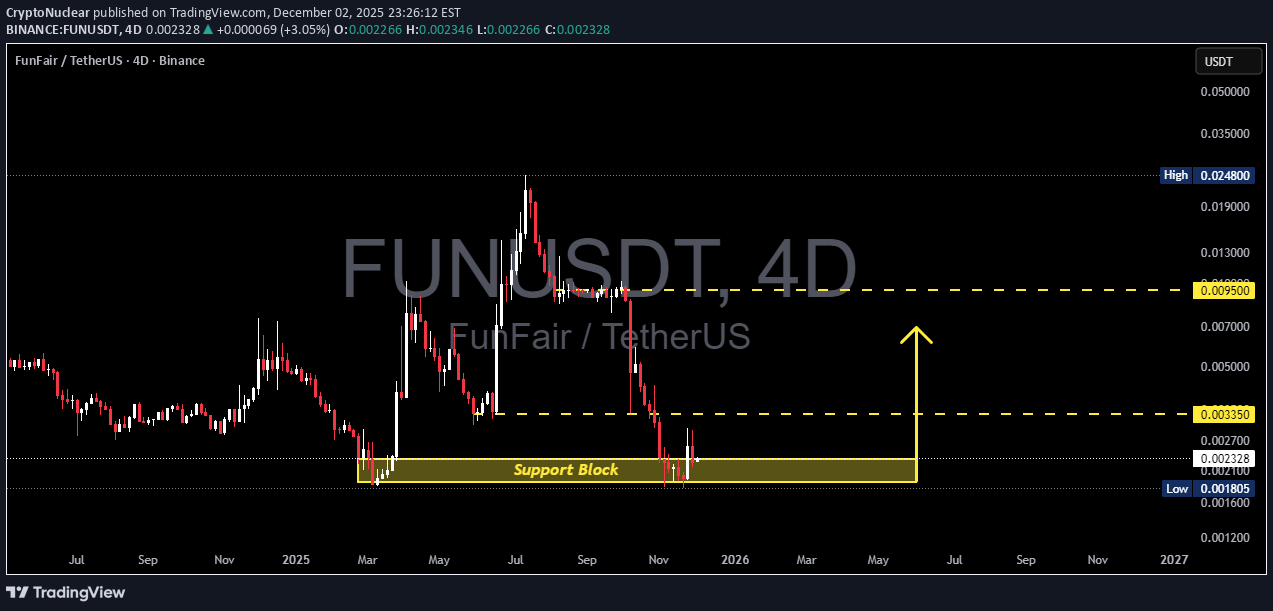
FUN/USDT has dropped back into its Last Defense Zone at 0.0023–0.0019, a major historical support block that previously triggered strong bullish impulses. Price returning to this area highlights two key dynamics: 1. Demand is still active, shown by repeated long rejection wicks whenever price tags the zone. 2. Market psychology is at an extreme, where only patient and disciplined traders can capitalize on the opportunity. The broader structure remains in a corrective downtrend, but the formation of a multi-touch support base signals the early stages of potential accumulation — a foundation that often precedes larger macro reversals. --- Bullish Scenario — Reversal From the Accumulation Block A bullish shift becomes more probable once price closes above 0.0027–0.0028 on the 4D timeframe. This breakout would signal buyers reclaiming structure and initiating a possible trend reversal. Upside Targets: Target 1: 0.00335 — minor supply / historical reaction zone Target 2: 0.00950 — major inefficiency fill Extended Target: 0.02480 — macro liquidity cluster If the reversal forms within the support block, the upside potential far outweighs the downside risk — making this one of the best asymmetric setups on the chart. --- Bearish Scenario — Breakdown From Support The bearish scenario activates if the market closes below 0.0019. Such a breakdown would confirm a structural failure and typically invites stronger selling pressure. A close below 0.0019 likely leads to: loss of key historical support entry into downside price discovery continuation toward 0.0012 or lower This zone is the hard invalidation level for any medium-term bullish bias. --- Pattern & Structure Details The chart highlights several notable technical elements: Accumulation Range forming inside 0.0023–0.0019 Repeated bullish rejection wicks — early signs of underlying demand Descending structure losing momentum (trend exhaustion) Early double-bottom behavior on support Liquidity clusters above at 0.00335 and 0.00950 Overall, the support block is the most critical zone for FUN/USDT heading into late 2025 and early 2026. #FUNUSDT #FUN #CryptoAnalysis #TechnicalAnalysis #SupportZone #ReversalPattern #BreakdownAlert #Altcoins

BandForBands
فرصت انفجاری FUN: پتانسیل سود 1000 درصدی در آستانه شکست!
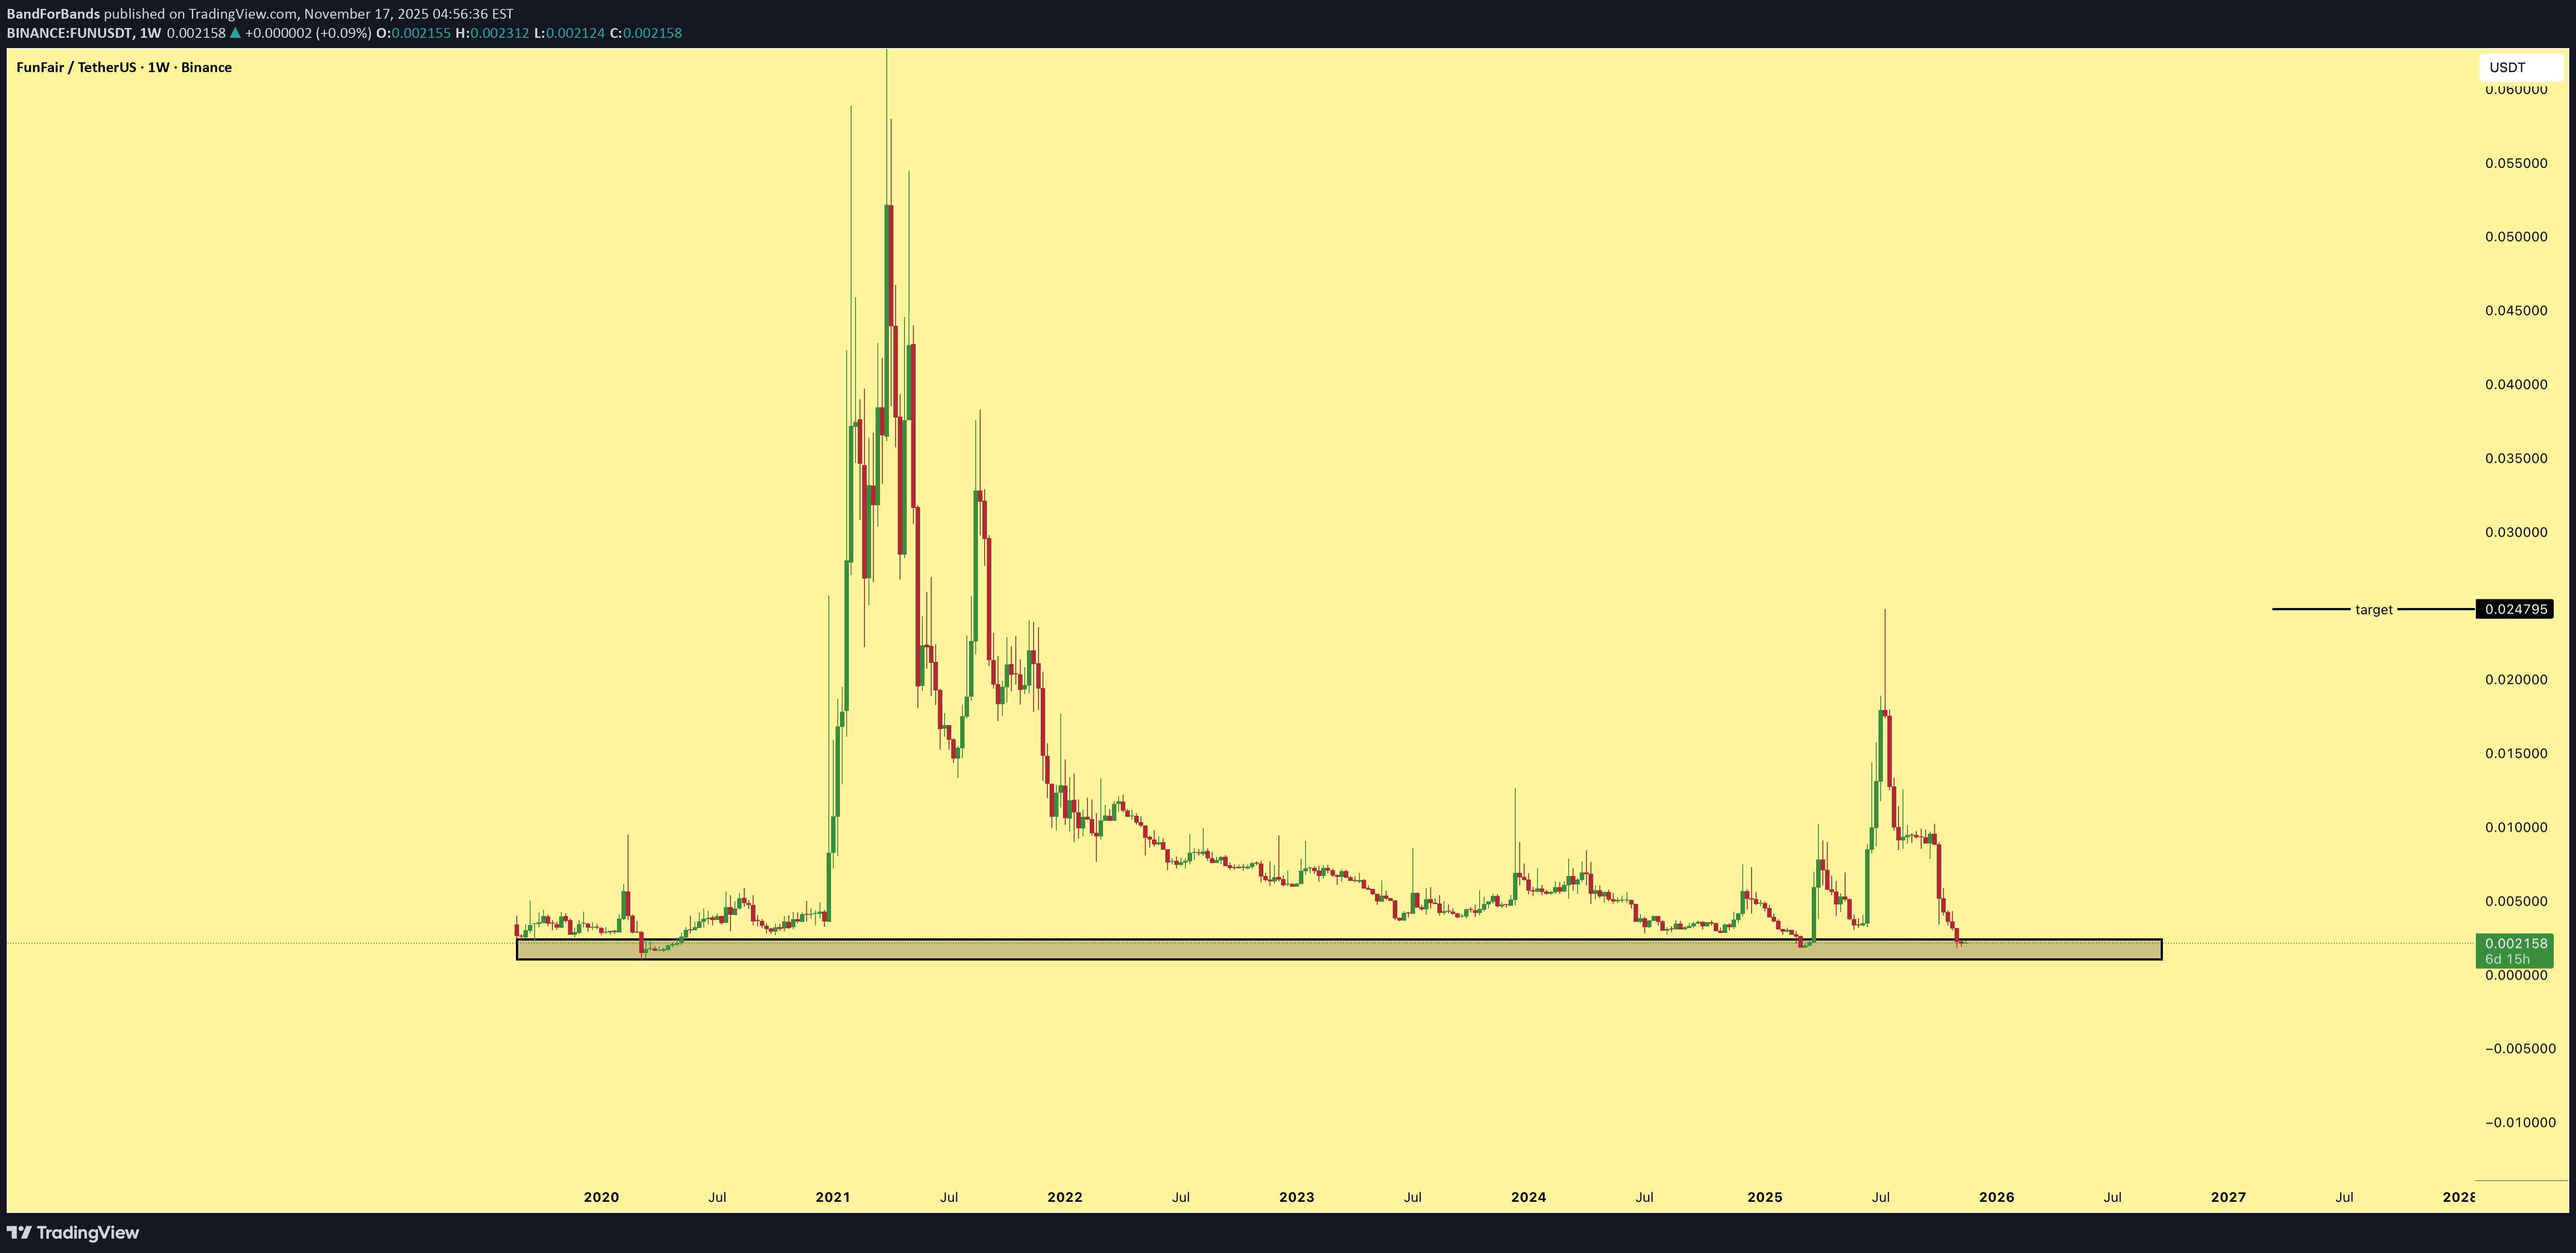
FUN has a clean high reward setup here with a potential 1000 percent gain from the current price once momentum kicks in. Structure looks tight and the breakout zone is approaching.
CryptoNuclear
FUN/USDT در بزنگاه تاریخی: آیا قیمت جهش میکند یا سقوط تازه آغاز میشود؟
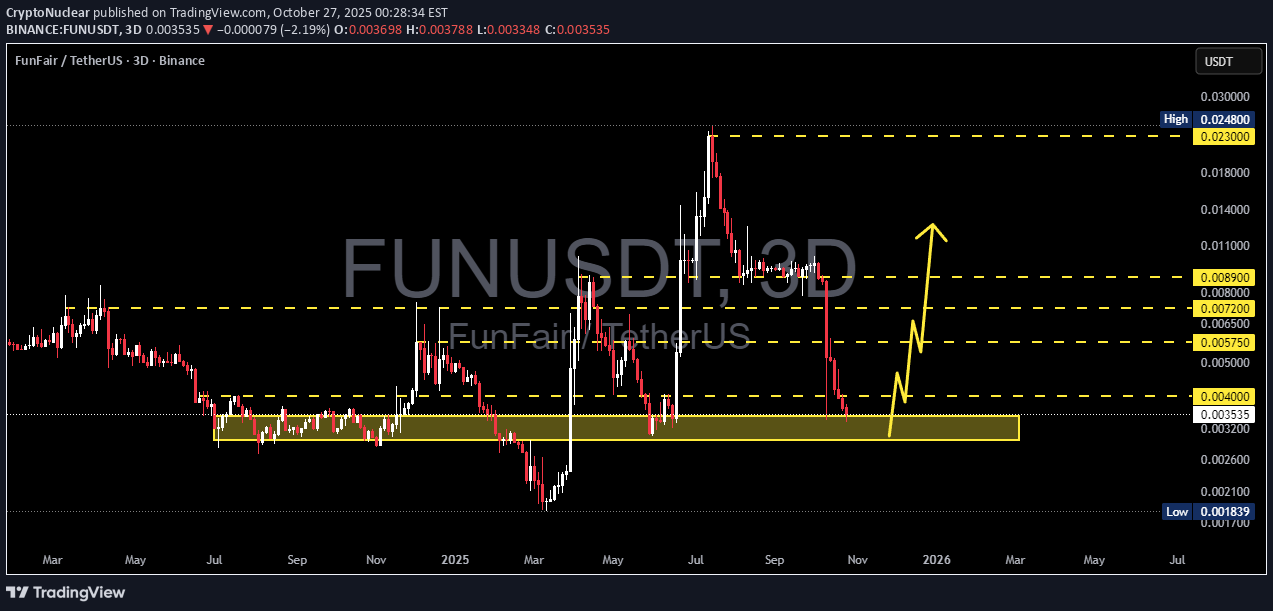
FUN has dropped back into its major historical accumulation zone between 0.00350–0.00297, a price range that previously triggered one of the strongest rallies in 2024. After a prolonged downtrend, this zone now acts as the final line of defense for bulls — a true make-or-break area that will define the mid-term market structure. Since peaking near 0.02480, the price has been under heavy selling pressure, forming a clear series of lower highs and lower lows. However, as the market approaches this key demand zone, bearish momentum appears to be slowing, hinting at potential exhaustion — a typical setup before a macro reversal. --- Pattern & Structure Primary trend: still bearish, but momentum is fading near the demand zone. Yellow zone (0.00350–0.00297): acts as long-term support / accumulation base from the last macro rally. A sideways accumulation or strong bullish candle here could signal buyer re-entry. A clean breakdown below 0.00297 would invalidate this base and confirm further downside continuation. --- Bullish Scenario If buyers defend the 0.00350–0.00297 area and a 3D candle closes above 0.0038–0.0040, a mid-term reversal could begin. Targets: Target 1: 0.00400 (short-term validation level) Target 2: 0.00575 (minor resistance) Target 3: 0.00720–0.00890 (major supply zone) Extended target: 0.02300 if momentum sustains Confirmation: Look for bullish engulfing / hammer patterns on higher timeframes with a noticeable rise in volume — these are key reversal triggers. --- Bearish Scenario If the price closes below 0.00297, the structure confirms a breakdown of the macro support. Targets: Target 1: 0.00200 Target 2: 0.00184 (multi-year low zone) Such a move would mark a capitulation phase, potentially setting the stage for a longer-term base formation at lower levels. --- Technical Insights Momentum indicators may soon show bullish divergence, supporting a potential reversal setup. 0.00400 remains a crucial resistance-to-support (RS flip) level to watch. Patience is key — early entries without confirmation can be risky in this type of setup. --- Conclusion FUN is now testing one of the most critical support zones of the year. The range between 0.00350–0.00297 represents a battlefield between accumulation and capitulation. If buyers manage to hold and reclaim 0.0040, the price could ignite a multi-week recovery phase. But if this level breaks, a slide toward 0.0020–0.00184 becomes highly probable. This is a zone where precision and confirmation matter more than emotion — wait for the chart to tell the story. --- #FUNUSDT #FunFair #CryptoAnalysis #SupportAndResistance #SupplyDemand #BreakOrBounce #CryptoMarket #TechnicalAnalysis #MarketStructure #RiskManagement

behdark
تحلیل تکنیکال FUN: پایان الگوی گاوی و نقطه احتمالی برگشت قیمت

It seems that the bullish diametric pattern on FUN is coming to an end. It appears that only a truncated and shortened wave G remains, which could complete after reaching the red-marked area. A reaction is expected within the green-marked zone. Keep in mind that the daily timeframe takes time to play out. A daily candle closing above the invalidation level will invalidate this analysis. For risk management, please don't forget stop loss and capital management When we reach the first target, save some profit and then change the stop to entry Comment if you have any questions Thank YouThe downward path of FUN was accurately predicted, but it didn’t hit our supply zone exactly
CryptoNuclear
FUN/USDT — Accumulation at Demand Zone: Rebound or Breakdown?

📖 Narrative & Full Analysis FUN/USDT is currently standing at a critical crossroads. After a strong rally that pushed the price to the recent peak at 0.0248 USDT, the market faced a sharp correction and is now testing the demand zone (0.0075 – 0.0090) — an area that previously acted as major resistance and has now flipped into support. This is the level that will define the next big move: Will buyers defend this zone and fuel a new rally? Or will sellers break through and trigger another deep leg down? The structure shows accumulation in progress. The sideways consolidation above demand indicates that the market is building momentum, awaiting confirmation for the next direction. --- 📊 Key Technical Levels 📍 Current Price: 0.009467 🟨 Demand Zone (Key Support): 0.0075 – 0.0090 🔑 Upside Resistance / Targets: 0.013887 → first breakout confirmation 0.019766 → mid-term supply zone 0.022897 – 0.024800 → retest of previous highs ⚠️ Downside Risk if Breakdown: 0.0032 → mid-term support 0.001839 → historical low --- 📈 Bullish Scenario Buyers successfully hold above the demand zone. A daily close above 0.0139 would confirm bullish momentum. If momentum builds, FUN could rally in stages: 0.0139 → 0.0197 → 0.022–0.0248. Bullish strategy: Accumulate within 0.0075 – 0.0090 Set a stop-loss below 0.0070 Scale out at resistance targets Potential Reward: From current levels, upside could reach +150% or more if the demand zone holds. --- 📉 Bearish Scenario If FUN loses the demand zone (daily close < 0.0070), support is broken. This would open a path for a deeper decline towards 0.0032 and possibly 0.0018. Bearish strategy: Aggressive traders could short a confirmed breakdown. Long-term holders should consider reducing risk or hedging if support fails. --- 🔍 Pattern & Sentiment Pattern: Base-building / accumulation at demand zone. Market Sentiment: Neutral-to-bearish in the mid-term, but with reversal potential if demand is respected. Candlestick signals to watch: Long lower wicks and strong bullish closes from demand → early signs of reversal. --- 🧭 Conclusion & Outlook FUN/USDT is at a make-or-break zone. As long as the price holds 0.0075 – 0.0090, the setup favors a rebound with upside potential of +50% to +150%. A confirmed breakdown below this zone, however, could trigger a 70–80% drop. 🚦This is a golden accumulation area for disciplined traders with tight stops. High risk, but potentially much higher reward. #FUNUSDT #FUN #Altcoins #Crypto #TechnicalAnalysis #SupportResistance #Breakout #Bullish #Bearish

Alpha-GoldFX
FUNUSDT Forming Bullish Momentum

FUNUSDT (FunFair Token) is really heating up as a breakout play, with strong bullish momentum now visible on the daily charts—making it a compelling setup for continuation traders. The pair has executed a clean breakout from both a descending channel and trendline resistance, signaling a powerful shift in trend direction. This breakout is backed by significant volume, which adds conviction to its bullish thesis—setting the stage for continued upside potential. Further emphasizing this momentum: FUN has surged above a key resistance level around 0.0173 USDT, flipping it into support. The breakout is confirmed by intense buying pressure and high-volume candles—clear signs of buyer dominance. Momentum shows no sign of slowing down. On Binance Square, analysts are noting a major shift: breakout candles and rising volume indicate that this move is just getting started. Suggested entry levels and profit targets point to a potential rally of over 140%, aligning with your outlook. To sum it up: FUNUSDT is offering a textbook momentum breakout setup—supported by strong volume, technical structure, and growing investor interest. If you’re tracking coins with explosive upside potential, this one deserves a spot at the top of your watchlist. Watch for retests of the breakout zone for possible entries, and it could be on its way to a 140%+ move. ✅ Show your support by hitting the like button and ✅ Leaving a comment below! (What is your opinion about this Coin) Your feedback and engagement keep me inspired to share more insightful market analysis with you!

MasterAnanda
Fun Token Will Continue Growing (Easy 333%+ Potential)

Fun Token produced a very strong retrace between 15-July and 5-August. Support is found at the exact same range where FUNUSDT consolidated in late June before its final advance. The last rise has been corrected by more than 100%. When 100% of an up-move is deleted, no more correction is needed. Going lower below 100% would signal the start of a bearish phase and FUNUSDT is clearly in a strong rising trend, a bull market. After 100% of a rise is removed the market is back to baseline, and this opens the doors for a new wave of growth. Can be stronger than the first one because all the weak hands were removed during the correction (retrace). Support found also matches the EMA144 price line. As soon as this level was confirmed as long-term support, FUNUSDT moved up with high volume, this is the start of the next high. Prepare for a major jump. Namaste.

AltcoinPiooners
"FunFair/USDT 4H: Potential Breakout with TP Targets"

FUNUSDT Take Profit (TP) Levels: TP1: 0.011534 USDT TP2: 0.010879 USDT TP3: 0.010419 USDT TP4: 0.008420 USDT Stop Loss (SL): Set at 1.272 Fibonacci (likely a typo or misplacement, as it seems unusually high compared to the price range; it might be intended as 0.013428 USDT or another value relative to the entry). DCA (Dollar Cost Averaging): Marked at 1.135 Fibonacci (again, possibly a typo; likely meant to be 0.012894 USDT or similar). Price Trend: The price has been in a downtrend until recently, with a noticeable upward movement around the entry point, suggesting a potential reversal or breakout. Support and Resistance: The entry zone appears near a support level, with resistance levels aligning with the TP targets. RSI AnalysisThe RSI is currently at 85.11, indicating that the asset is in the overbought territory (above 70). This suggests a strong upward momentum but also a potential for a reversal or pullback soon. Historically, the RSI has fluctuated between oversold (below 30) and overbought levels, with a recent sharp increase, supporting the price breakout. InterpretationThe trading strategy seems to be a long position with multiple take-profit levels, aiming to capitalize on a potential upward trend. The high RSI value suggests caution, as overbought conditions might lead to a correction. Monitoring for bearish reversal signals (e.g., divergence or candlestick patterns) would be prudent. The SL and DCA levels need clarification, as their current values appear inconsistent with the price scale.TP 1 FILLED +7.51% PROFITTP 1 & 2 & 3 FILLED +17.23% PROFIT

Innotrade_AJ
FUNUSDT (FunFair/TetherUS) preparing for PUMP
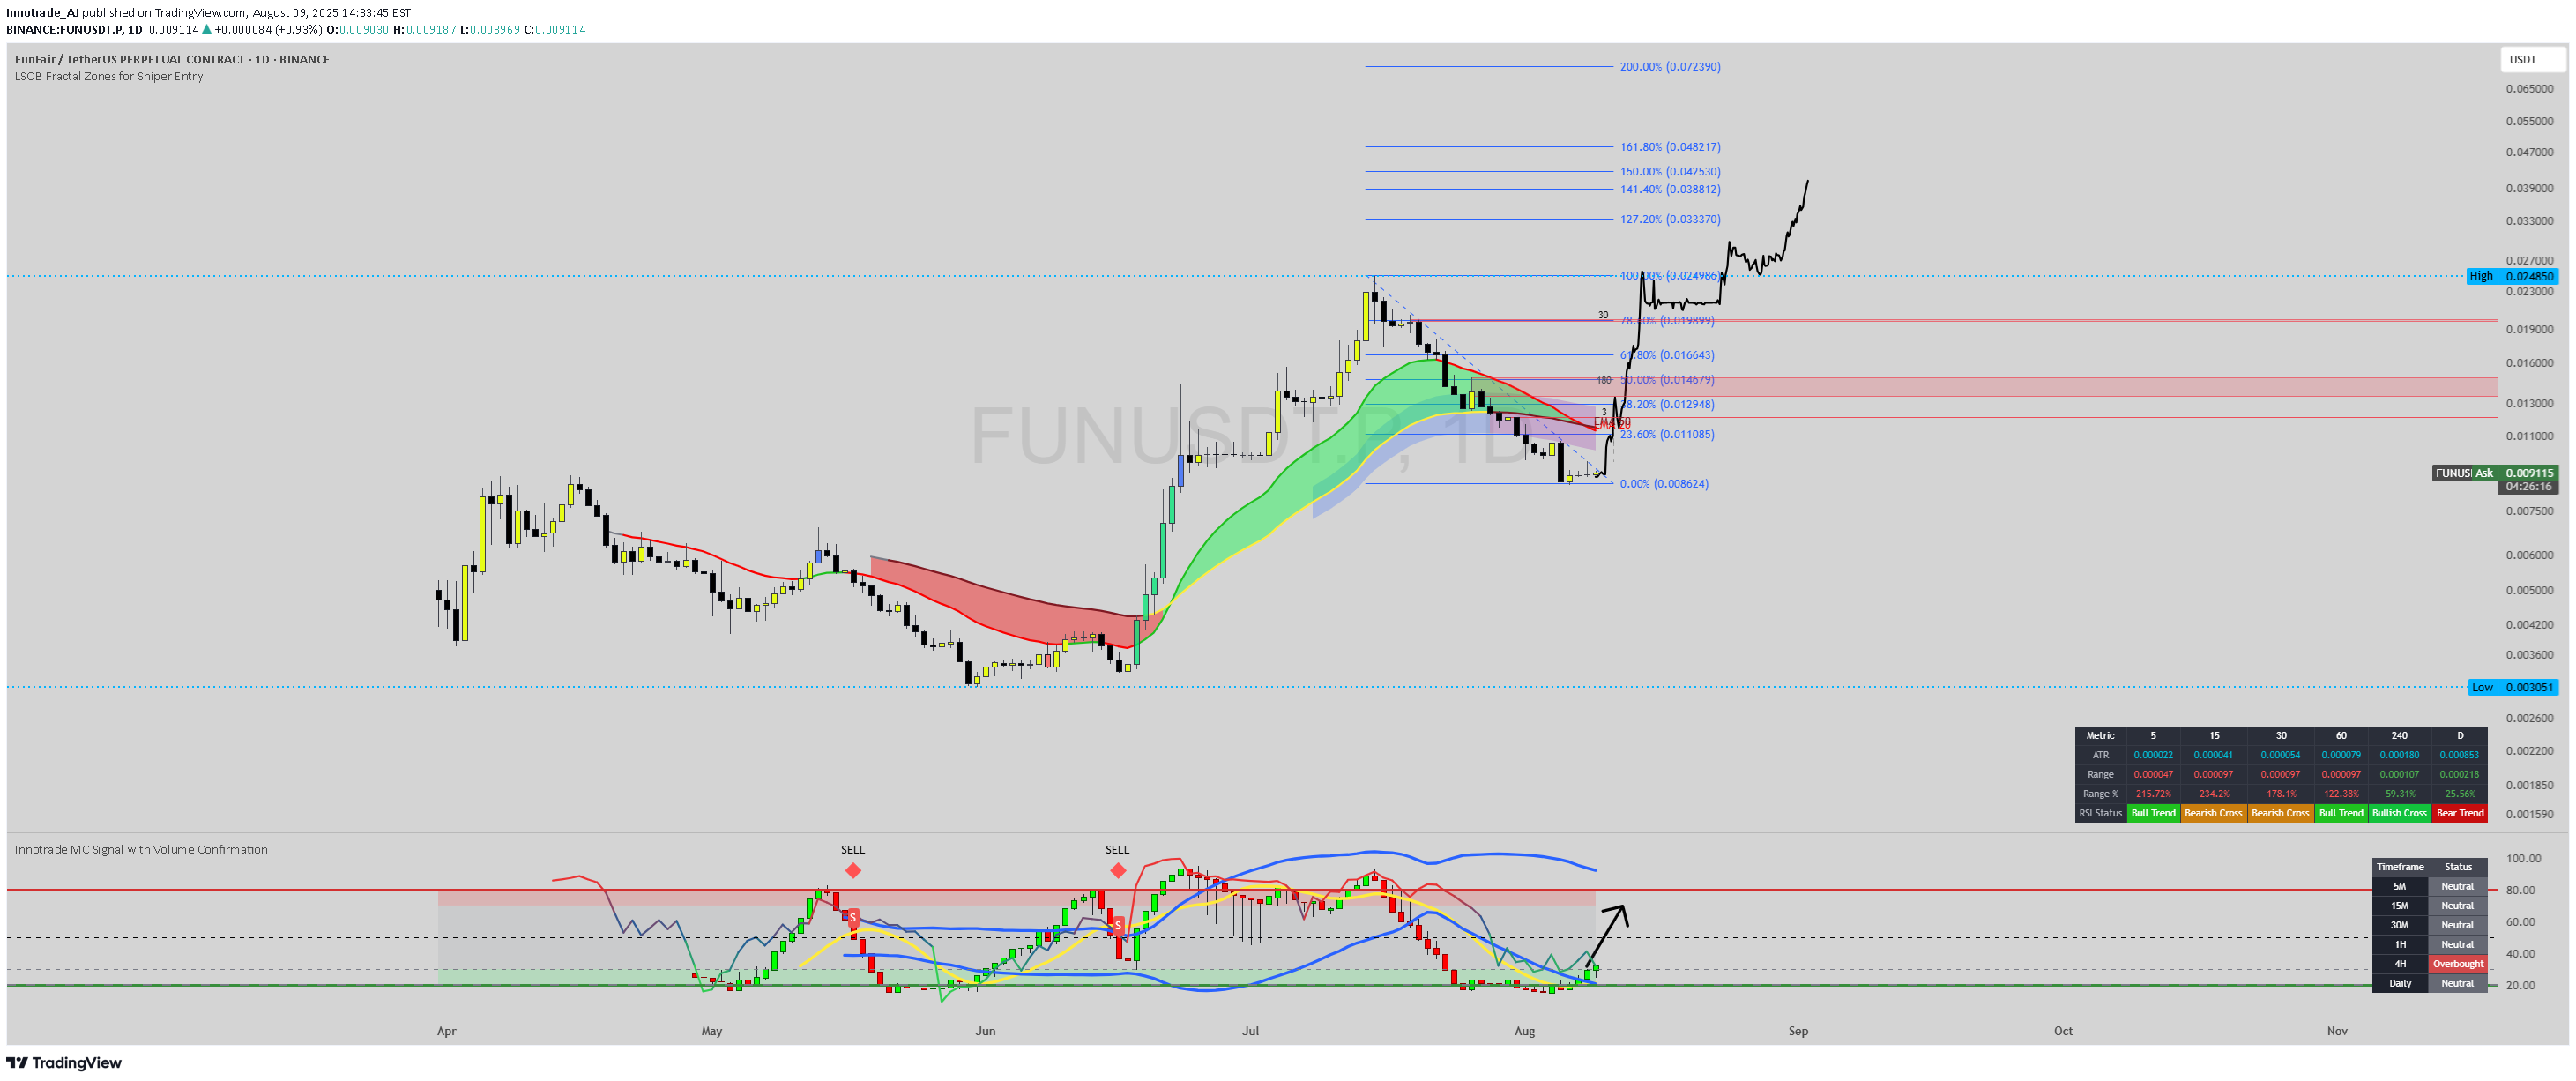
Firstly, our Algo-based indicators are used to create this analysis. Follow me so you don't miss, Boost and leave your comments if you profited with our posts, so we may continue: This daily chart for FUNUSDT (FunFair/TetherUS) suggests that a significant correction has found a floor, and the asset is now positioned for a strong bullish reversal with substantial upside potential. Market Structure Shift: The chart illustrates a classic reversal pattern. After a steep decline from the peak at approximately $0.02485, the price has entered a consolidation phase at a critical support level. The projected path, indicated by the hand-drawn pink line, represents an anticipated "Change of Character" (Choch) from bearish to bullish as the price is expected to start forming higher highs and higher lows. Other traders have also noted that FUNUSDT is showing signs of a potential bullish reversal. Support and Bottoming Formation: The price is finding strong support at the $0.008624 level, which corresponds to the 0.00% Fibonacci retracement level of the prior major uptrend. This level is acting as the definitive bottom in this analysis. The price action consolidating above this low suggests an accumulation phase is underway. Indicator Confluence: * The primary chart indicator, the LSQB Fractal Zones for Sniper Entry, shows the price holding within the green-colored band. In systems like this, fractal-based indicators identify potential reversal points.The green zone acts as a dynamic support area, signaling that the underlying trend is either bullish or attempting a bullish reversal. * The lower indicator, Innotrade MC Signal with Volume Confirmation, is showing its signal line moving up from the lower boundary (green zone), which typically represents oversold conditions. [4] A black arrow points upwards, suggesting an impending or recently triggered buy signal and a buildup of bullish momentum. This custom indicator is designed to identify high-probability reversals by blending momentum oscillators and confirming them with volume and volatility analysis. Price Projection and Targets: The drawn pink line illustrates the expected trajectory for the price, anticipating a powerful rally from the current support. The key objectives are based on Fibonacci extension levels, which are used to project potential targets in a new trend: Strategy: Position: Long (Buy) Entry: The analysis identifies the current price area around the $0.008624 - $0.009129 zone as a "sniper entry" or strategic buying opportunity. Targets: The primary targets for this bullish move are 0.024986 0.024986 0.033370, and potentially higher towards $0.048217. Conclusion: With the price stabilizing at a key Fibonacci support level, a bottoming formation in place, and bullish signals from the custom indicators, FUNUSDT presents a compelling bullish reversal setup. The current price level is highlighted as an ideal entry point to capitalize on a potential new uptrend with significant room for growth. Disclaimer: This analysis is based on the provided trading chart and is for educational purposes only. It should not be considered financial advice. Always conduct your own research and manage risk appropriately. Crypto markets are known for their volatility.
Alpha-GoldFX
FUNUSDT Forming Bullish Reversal
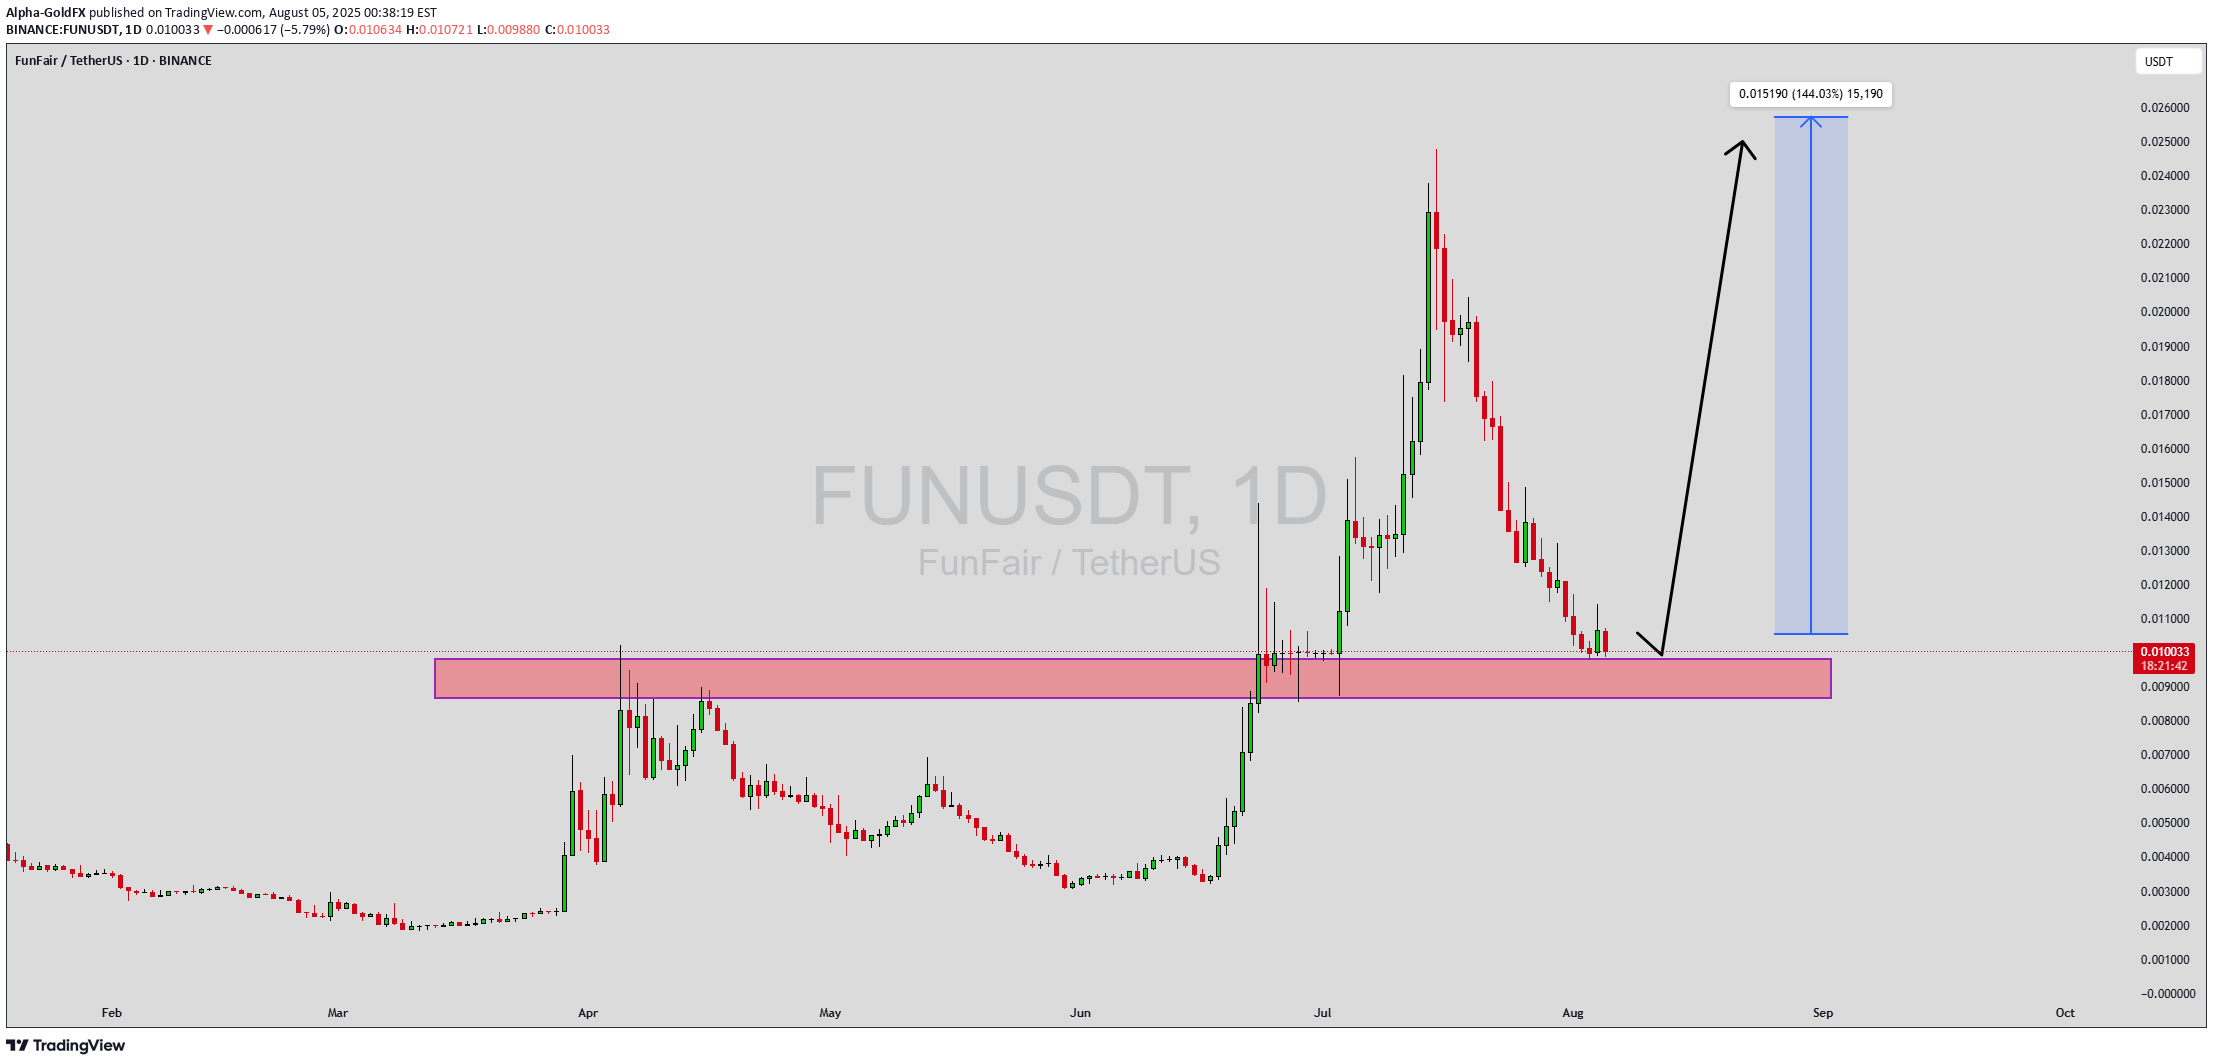
FUNUSDT is showing strong signs of a potential bullish reversal after a healthy correction phase. The price has now landed back into a historically strong support zone that previously acted as resistance. This zone, clearly marked on the chart, is being respected again, which could mark the beginning of a powerful upward move. The technical setup aligns well with a classic demand zone bounce, a favorite among swing traders and breakout investors. The current market conditions are ripe for a potential 100%+ move, with a projected upside target near \$0.025 as shown on the chart. This bullish thesis is backed by sustained trading volume, suggesting continued investor interest. FUN (FunFair) has a history of explosive price action after accumulation phases, and this setup mirrors past patterns that led to significant rallies. Fundamentally, FunFair has long served as a blockchain-based gaming and entertainment platform, and its role in the evolving crypto ecosystem keeps it on the radar of both speculative and long-term investors. The sharp retracement to a key level, followed by potential upward momentum, makes FUNUSDT an attractive high-reward opportunity for aggressive buyers aiming to capitalize on early entries. With a clean chart structure, attractive risk-reward ratio, and visible interest from traders, FUNUSDT is positioned for a potential breakout. This could be one of the more lucrative mid-cap plays on the altcoin radar right now. ✅ Show your support by hitting the like button and ✅ Leaving a comment below! (What is You opinion about this Coin) Your feedback and engagement keep me inspired to share more insightful market analysis with you!
Disclaimer
Any content and materials included in Sahmeto's website and official communication channels are a compilation of personal opinions and analyses and are not binding. They do not constitute any recommendation for buying, selling, entering or exiting the stock market and cryptocurrency market. Also, all news and analyses included in the website and channels are merely republished information from official and unofficial domestic and foreign sources, and it is obvious that users of the said content are responsible for following up and ensuring the authenticity and accuracy of the materials. Therefore, while disclaiming responsibility, it is declared that the responsibility for any decision-making, action, and potential profit and loss in the capital market and cryptocurrency market lies with the trader.