
DOGS
DOGS
| تریدر | نوع سیگنال | حد سود/ضرر | زمان انتشار | مشاهده پیام |
|---|---|---|---|---|
 CryptoAnalystSignalRank: 30933 | خرید | حد سود: تعیین نشده حد ضرر: تعیین نشده | 12 hour ago | |
 BandForBandsRank: 32041 | خرید | حد سود: تعیین نشده حد ضرر: تعیین نشده | 11/30/2025 |
Price Chart of DOGS
سود 3 Months :
خلاصه سیگنالهای DOGS
سیگنالهای DOGS
Filter
Sort messages by
Trader Type
Time Frame
CryptoAnalystSignal
#DOGS/USDT is currently strongly bullish
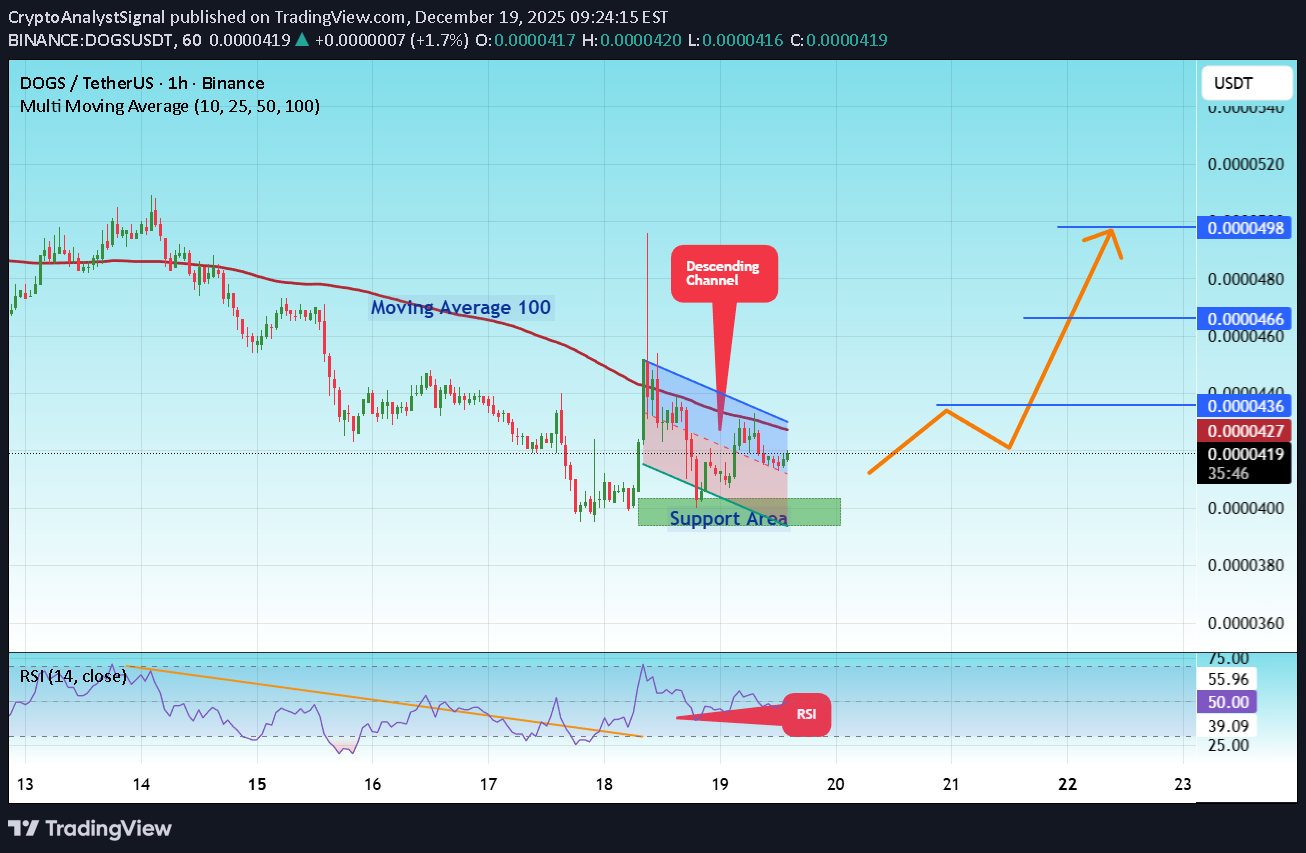
#DOGS The price is moving in a descending channel on the 1-hour timeframe. It has reached the lower boundary and is heading towards breaking above it, with a retest of the upper boundary expected. We have a downtrend on the RSI indicator, which has reached near the lower boundary, and an upward rebound is expected. There is a key support zone in green at 0.0000397. The price has bounced from this zone multiple times and is expected to bounce again. We have a trend towards consolidation above the 100-period moving average, as we are moving close to it, which supports the upward movement. Entry price: 0.0000419 First target: 0.0000436 Second target: 0.0000466 Third target: 0.0000498 Don't forget a simple principle: money management.
CryptoAnalystSignal
صعود انفجاری دوج کوین (DOGS/USDT)؟ تحلیل تکنیکال و اهداف قیمتی هیجانانگیز پیش رو!
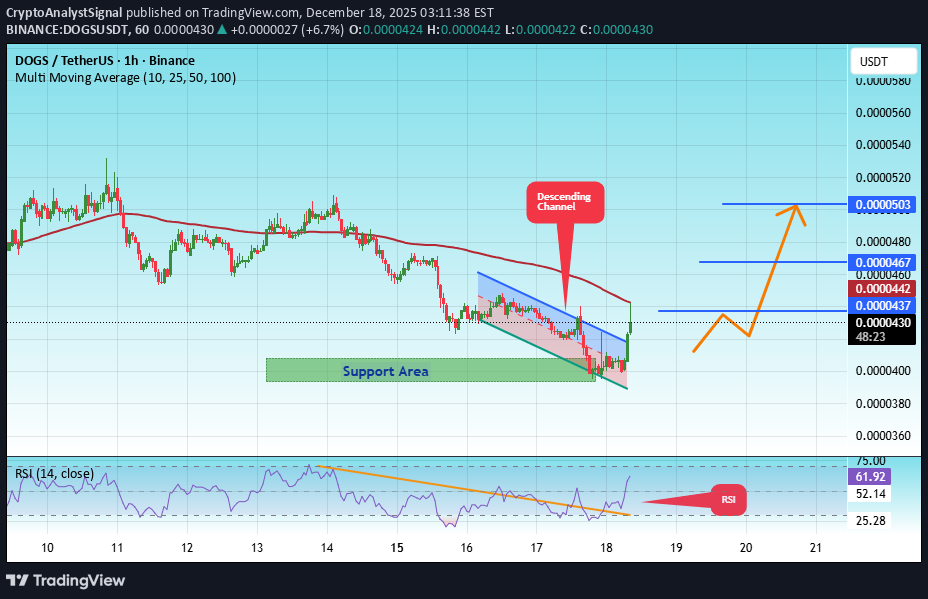
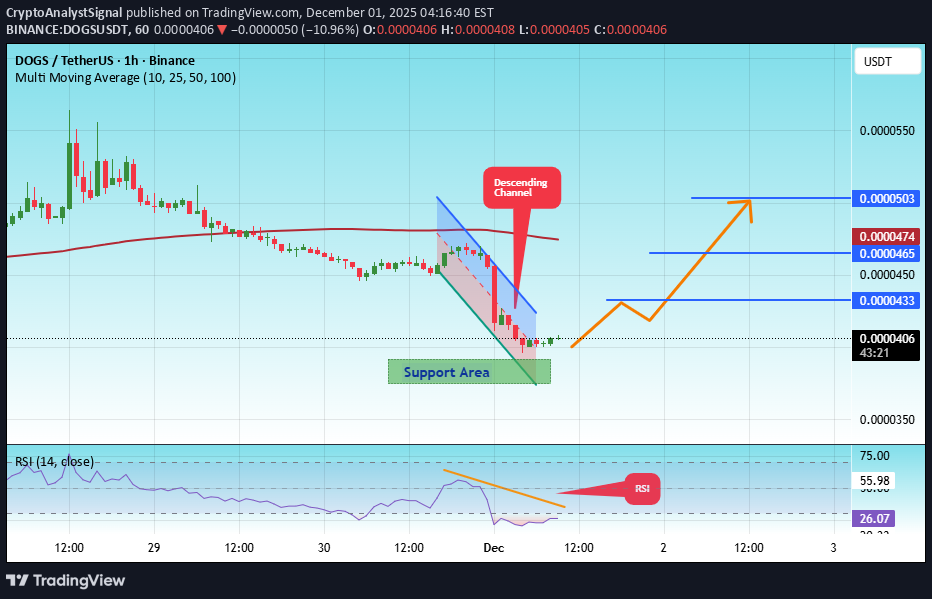
#DOGS The price is moving in a descending channel on the 1-hour timeframe. It has reached the lower boundary and is heading towards breaking above it, with a retest of the upper boundary expected. We have a downtrend on the RSI indicator, which has reached near the lower boundary, and an upward rebound is expected. There is a key support zone in green at 0.0000397. The price has bounced from this zone multiple times and is expected to bounce again. We have a trend towards consolidation above the 100-period moving average, as we are moving close to it, which supports the upward movement. Entry price: 0.0000432 First target: 0.0000437 Second target: 0.0000467 Third target: 0.0000503 Don't forget a simple principle: money management. Place your stop-loss below the support zone in green. For any questions, please leave a comment. Thank you.#DOGS First target: 0.0000437 Reached Second target: 0.0000467 Reached Third target: 0.0000503 Reached
CryptoAnalystSignal
سیگنال خرید قوی DOGS/USDT: آماده جهش از کانال نزولی!
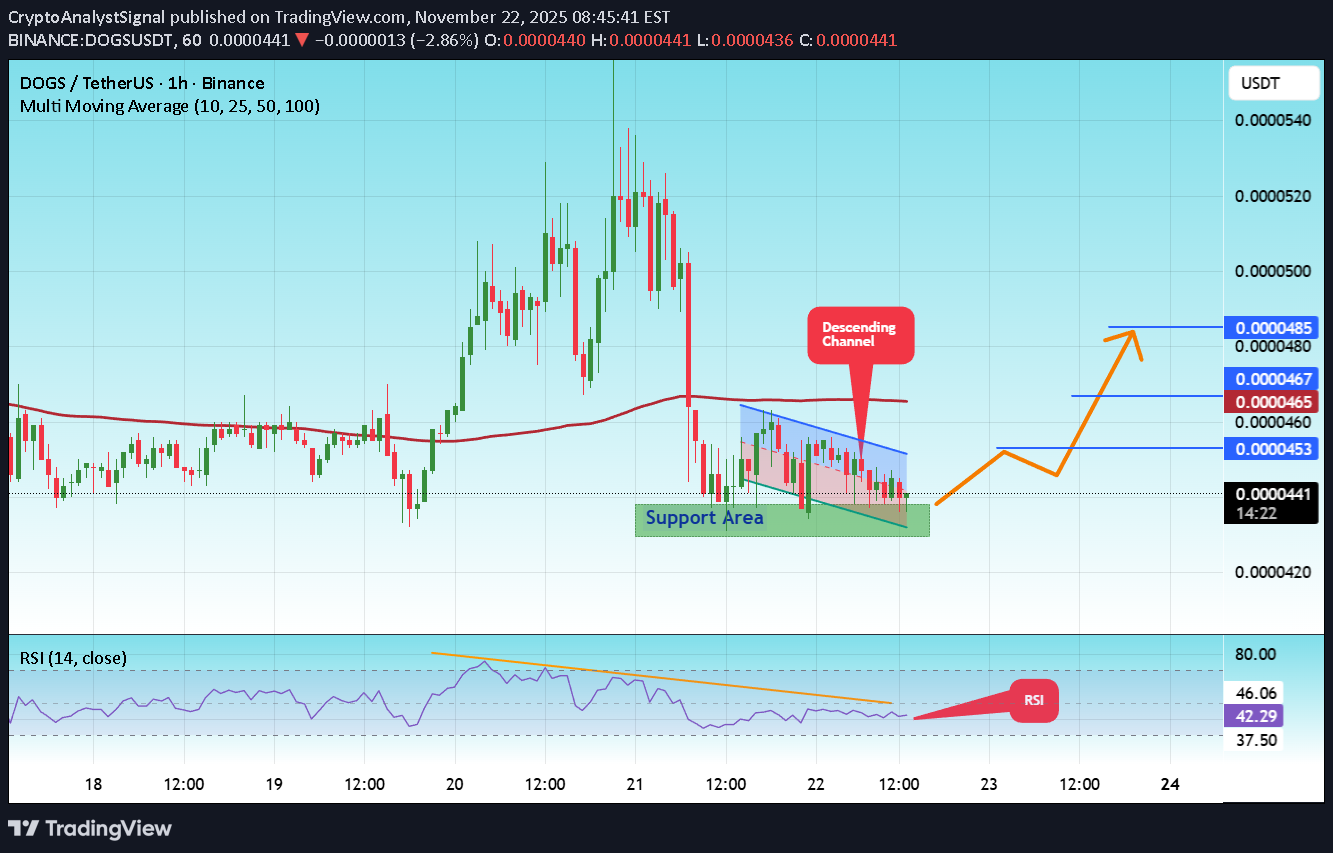
#DOGS The price is moving in a descending channel on the 1-hour timeframe. It has reached the lower boundary and is heading towards a breakout, with a retest of the upper boundary expected. We are seeing a bearish bias in the Relative Strength Index (RSI), which has reached near the lower boundary, and an upward bounce is expected. There is a key support zone in green at 0.0000444. The price has bounced from this level several times and is expected to bounce again. We are seeing a trend towards stabilizing above the 100-period moving average, which we are approaching, supporting the upward trend. Entry Price: 0.0000460 First Target: 0.0000483 Second Target: 0.0000515 Third Target: 0.0000553 Remember a simple principle: Money Management. Place your stop-loss order below the green support zone. For any questions, please leave a comment. Thank you.#DOGS First Target: 0.0000483 Reached Second Target: 0.0000515 Reached Third Target: 0.0000553 Reached

CryptoAnalystSignal
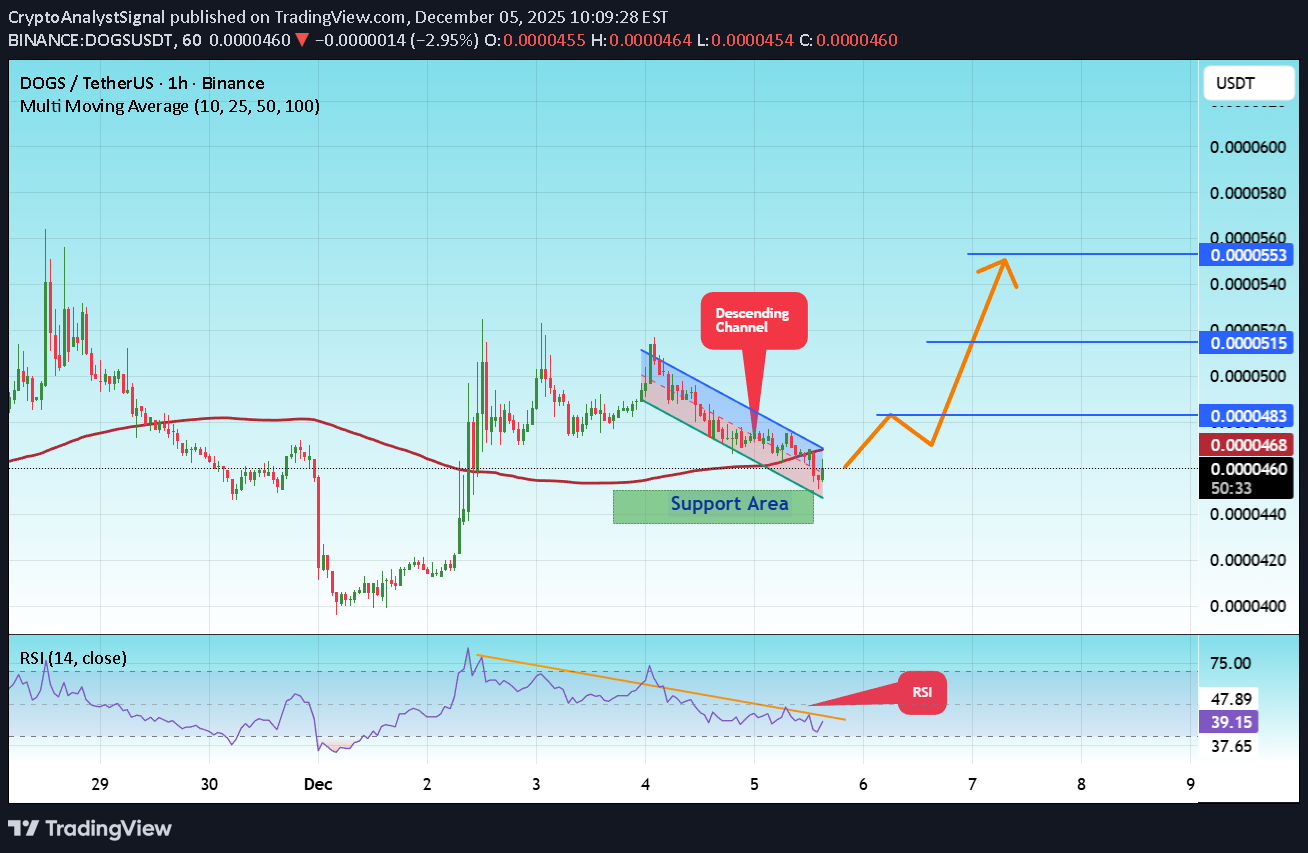
پیشبینی انفجاری دوج (DOGS/USDT): فرصت خرید در کف حمایت کلیدی!
#DOGS The price is moving in a descending channel on the 1-hour timeframe. It has reached the lower boundary and is heading towards breaking above it, with a retest of the upper boundary expected. We have a downtrend on the RSI indicator, which has reached near the lower boundary, and an upward rebound is expected. There is a key support zone in green at 0.0000381. The price has bounced from this zone multiple times and is expected to bounce again. We have a trend towards consolidation above the 100-period moving average, as we are moving close to it, which supports the upward movement. Entry price: 0.0000403 First target: 0.0000433 Second target: 0.0000465 Third target: 0.0000503 Don't forget a simple principle: money management. Place your stop-loss below the support zone in green. For any questions, please leave a comment. Thank you.#DOGS First target: 0.0000433 Reached Second target: 0.0000465 Reached Third target: 0.0000503 Reached
BandForBands

asilturk
آلتکوین DOGS: آمادهسازی برای جهشهای بزرگ یا سقوط ناگهانی؟
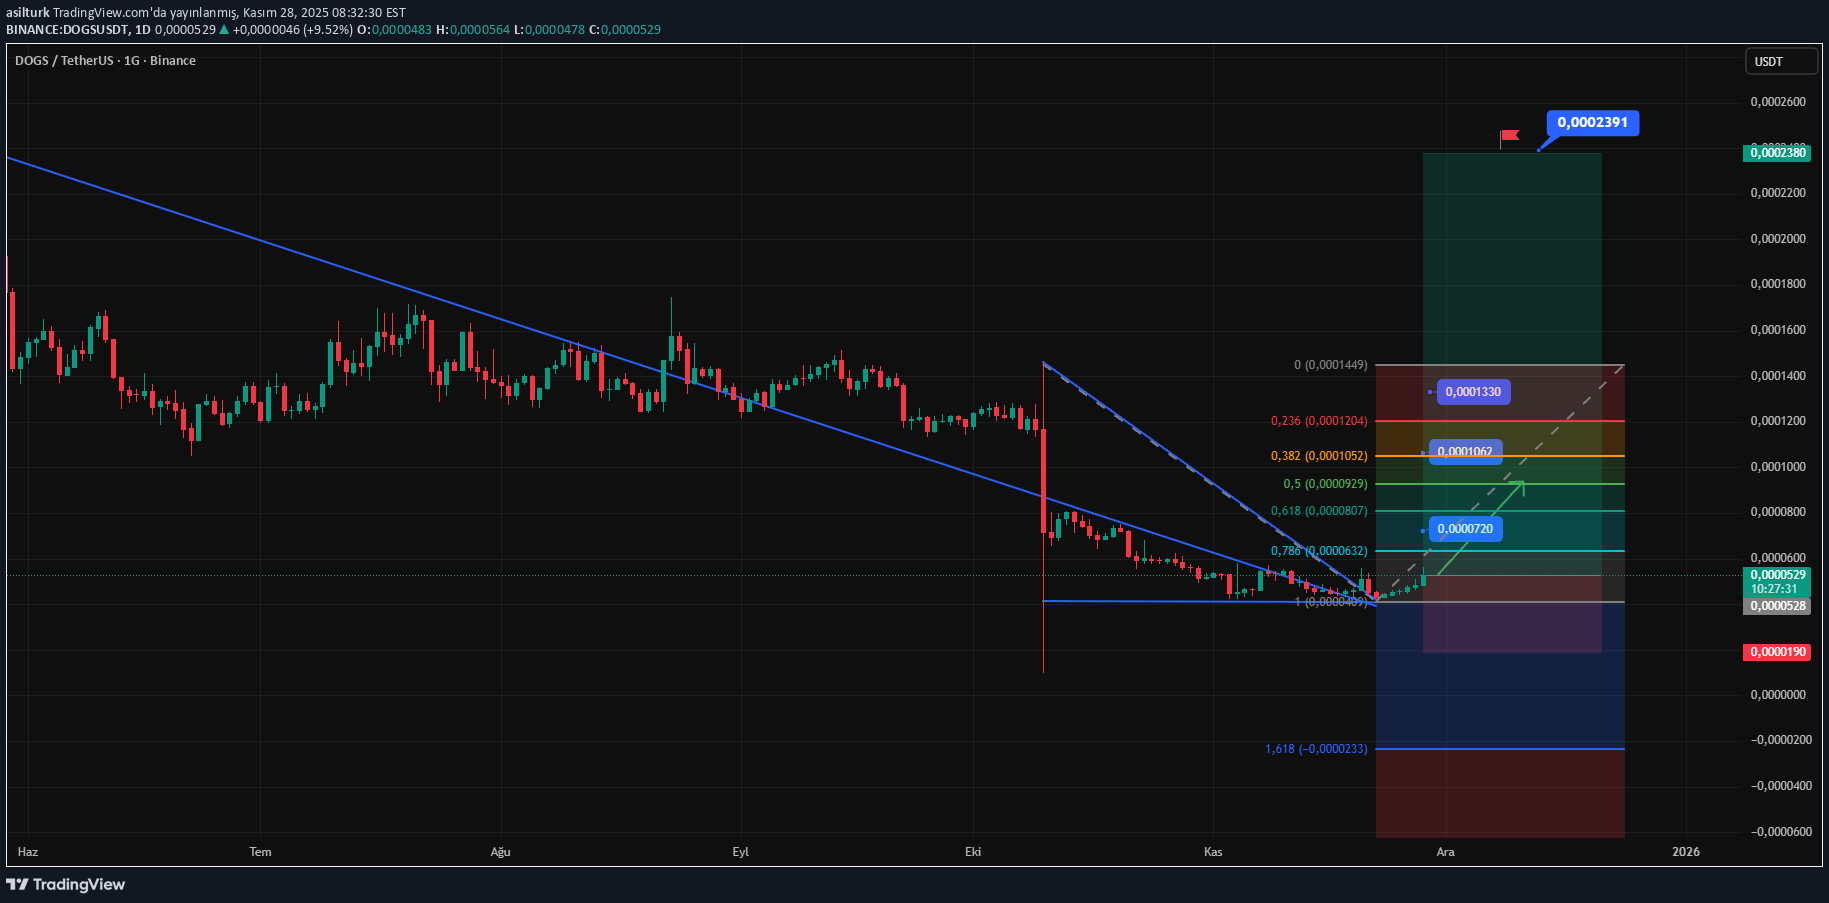
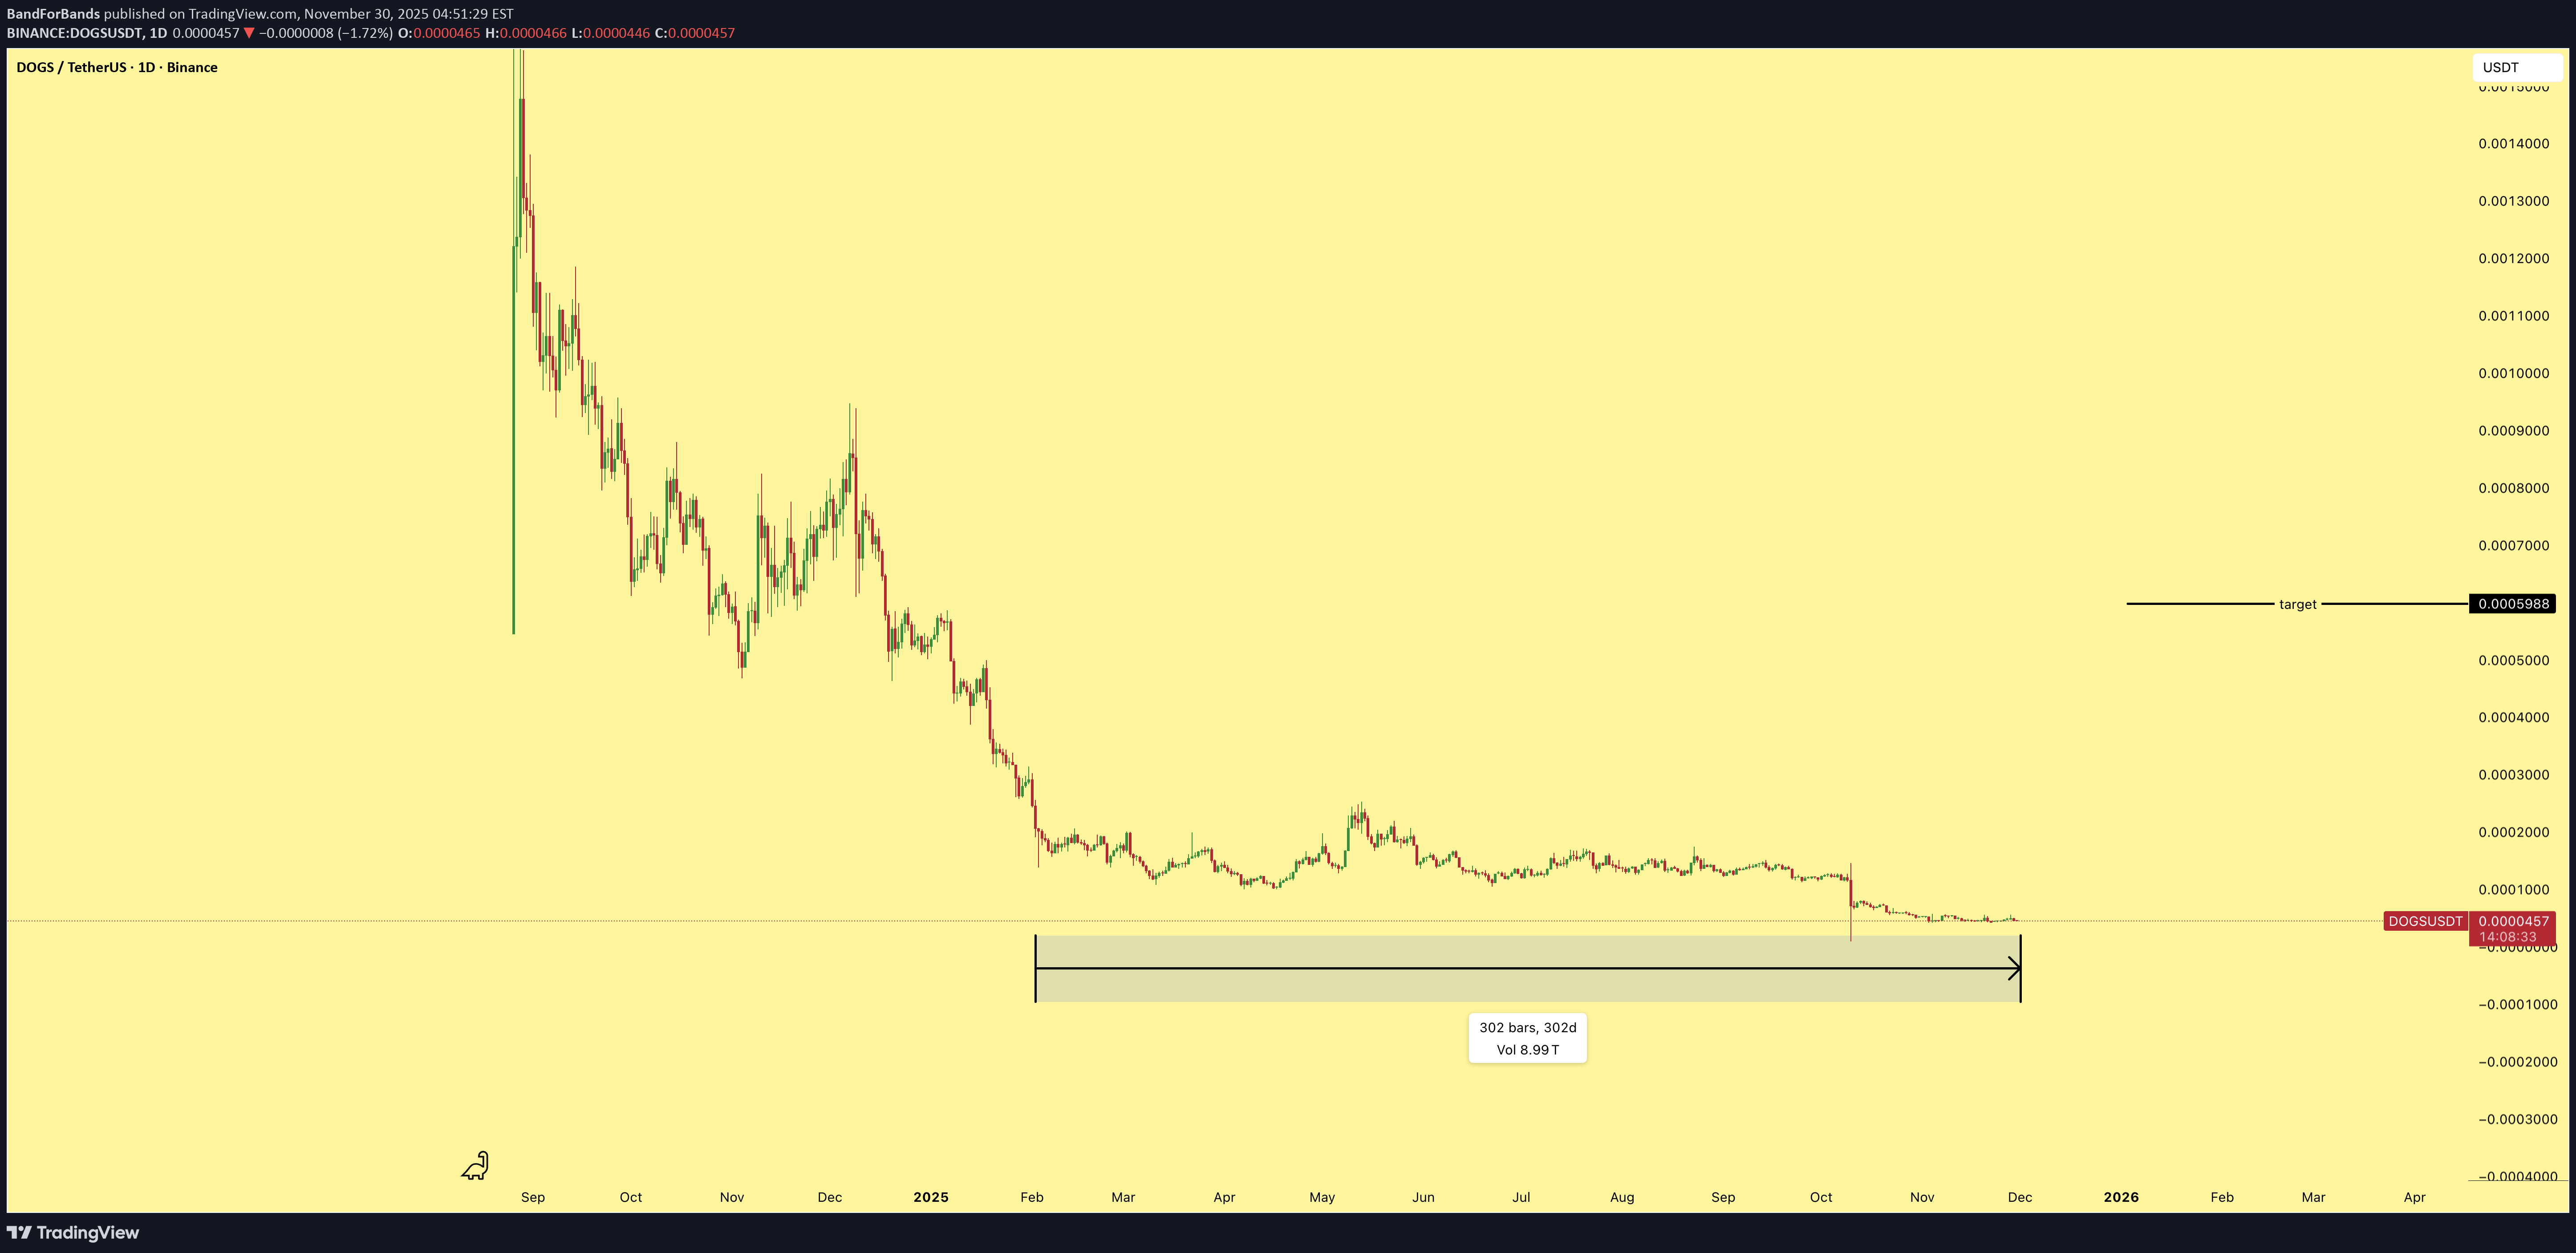
Total supply: 550 billion tokens. Circulating supply: The majority — such as 516.75 billion tokens — are already in circulation. The current price is moving $0.00005. For DOGS meme coin, which is traded with a volume of $13 million, this volume is enough for it to move more, but gradual purchases can be made for DOGS coins for indicators that complement and support it. However, since it is a meme coin, it may cause extremely high volatilities and extremely harsh and precise movements in both directions may be expected. However, my personal prediction is that it will go up. There is no formation, no price target, only cash flow... I wish you good investments.
CryptoAnalystSignal
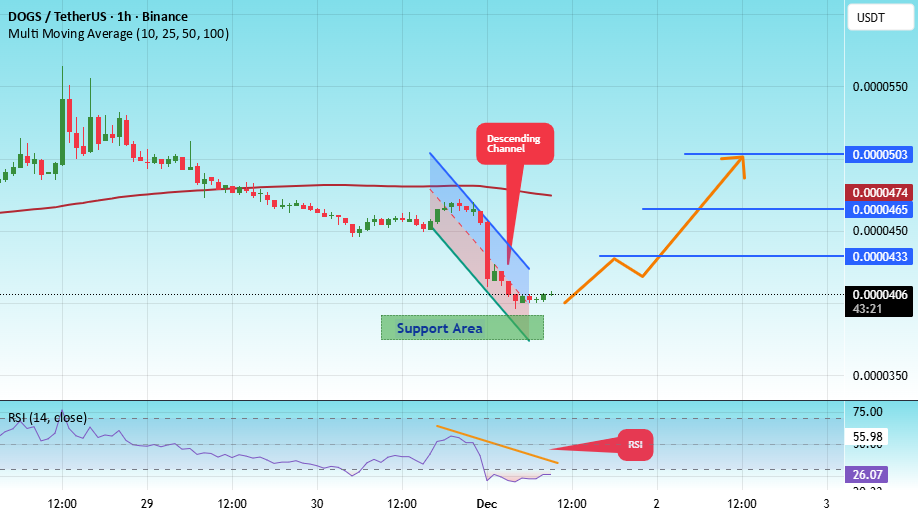
پیشبینی صعودی قوی: راز شکست کانال نزولی ارز دیجیتال DOGS/USDT!
#DOGS The price is moving in a descending channel on the 1-hour timeframe and is expected to break out and continue upwards. We have a trend to stabilize above the 100-period moving average again. We have a downtrend on the RSI indicator, which supports an upward move if it breaks above it. We have a key support zone in green that pushed the price higher at 0.0000433. Entry price: 0.0000440 First target: 0.0000453 Second target: 0.0000467 Third target: 0.0000485 For risk management, don't forget stop-loss orders and capital management. The stop-loss is below the support zone in green. Upon reaching the first target, take some profits and then change the stop-loss order to an entry order. For any questions, please comment. Thank you.#DOGS First target: 0.0000453 Reached Second target: 0.0000467 Reached Third target: 0.0000485 Reached

lubosi
راز افزایش 8 درصدی سود: ترکیب چکش هفتگی و روزانه با 3 سرباز صعودی 4 ساعته
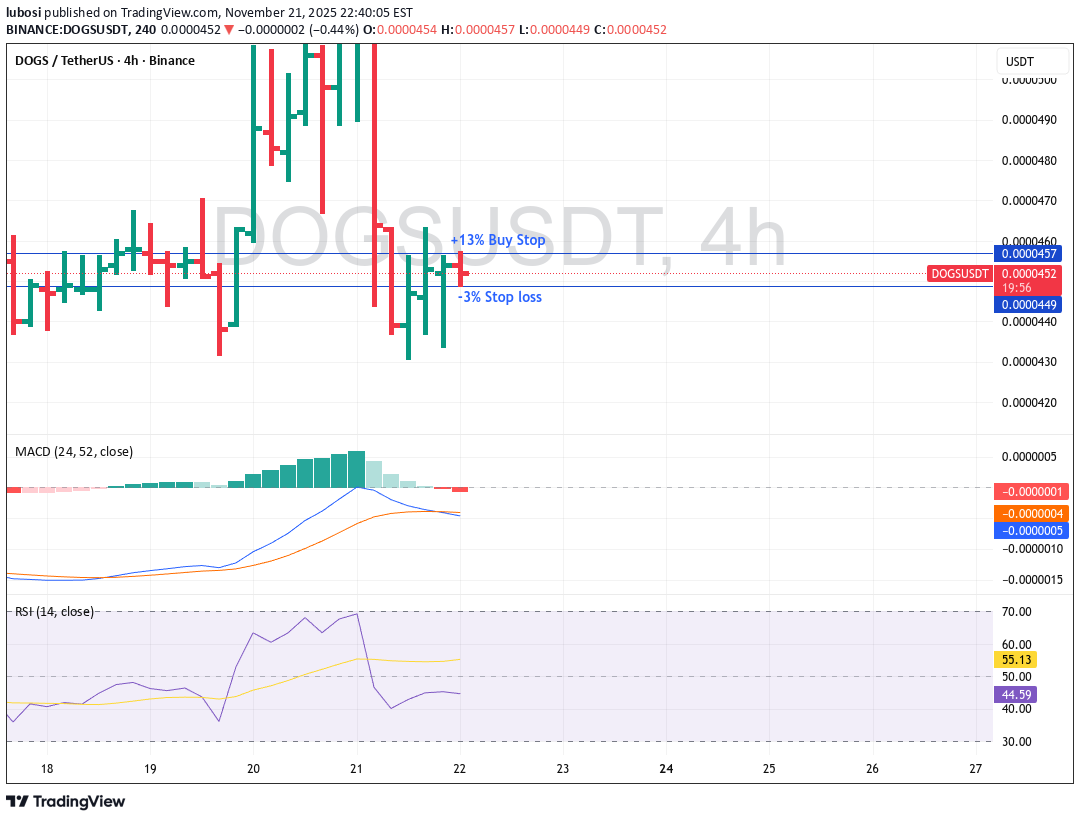
📈 Understanding Multi-Timeframe Confluence: Weekly & Daily Hammer + 4H Rising Three Soldiers (MACD Color System) Trading success comes from recognizing when multiple timeframes begin speaking the same language. Today, we dive into a high-probability bullish setup using a combination of: Candlestick patterns MACD Color Code System Weekly → Daily → 4H alignment This analysis breaks down why this configuration produces an 80% bullish probability, and how traders can approach it with precision. 🔶 The Setup We combine three powerful elements: 1️⃣ Weekly Timeframe Pattern: Hammer+ MACD Color: Light Green Interpretation: Strong higher-timeframe rejection of lows. Trend is stabilizing and preparing for a bullish continuation. 2️⃣ Daily Timeframe Pattern: Hammer MACD Color: Light Green Interpretation: Buyers are stepping back in. Daily structure supports the formation of a medium-term bottom. 3️⃣ 4H Timeframe Pattern: Rising Three Soldiers MACD Color: Light Red Interpretation: The candle pattern shows aggressive bullish drive, but MACD Light Red indicates a temporary pullback or a slowdown in momentum. This mismatch matters—but it doesn’t kill the setup. 🧠 What the Multi-Timeframe Alignment Tells Us When Weekly and Daily have strong bullish candlestick patterns and both show Light Green MACD, it creates a dominant upward bias. The 4H Rising Three Soldiers adds short-term structure confirmation, but the Light Red MACD warns that price may still be in a pullback before the next leg up. Together, this equals a powerful trend formation with a temporary pause—ideal for building positions. 📊 Probability Breakdown Using the MACD Color Probability System + Candlestick Reinforcement: Weekly Hammer+ (Light Green): +10% Daily Hammer (Light Green): +8% 4H Rising Three Soldiers (Light Red): +2% Base MACD probability (W-LG / D-LG / 4H-LR): 60% ⭐ Final Bullish Probability: 80% This level indicates a statistically meaningful bullish confluence. 🎯 How to Trade This Setup on TradingView ✔ 1. Identify Confirmation on 4H Even though the candlestick pattern is bullish, the MACD color (Light Red) signals slowing momentum. Wait for: 4H Light Red → Light Green, or A strong bullish 4H close above the prior candle high. This reduces noise and avoids early entries. ✔ 2. Build Your Position Near a Pullback Because higher timeframes are bullish, pullbacks on 4H are opportunities. Ideal entries: 38.2%–61.8% Fibonacci retracement of the Rising Three Soldiers move Breakout from the third soldier’s high Retest of rejected levels seen on the Weekly or Daily hammer wicks ✔ 3. Stop-Loss Placement Best locations: Below the 4H Rising Three Soldiers base More conservative: below the Daily Hammer low Most conservative: below the Weekly Hammer low Choose based on your risk tolerance. ✔ 4. Target Levels First target: Most recent 4H swing high Second target: Daily resistance Final target: Weekly structure high or trendline resistance Add trailing stop once price breaks out 📌 Key Takeaways Weekly + Daily bullish hammers create strong trend foundation. 4H Rising Three Soldiers shows internal momentum building. MACD Light Red on 4H adds caution—but not weakness. Combined impact results in an 80% bullish probability. Smart entry timing allows traders to ride the next push with controlled risk. Rocket boost this content to learn more ⚠️ Disclaimer Before using any strategy, indicator, or probability model shown here, always practice on a simulation / demo trading account first to understand the risks and behavior of the system. Only trade with money you can afford to lose.
lubosi
احتمال صعودی بازار ۸۰٪ شد: راز تحلیل کندل استیکها و MACD فاش شد!
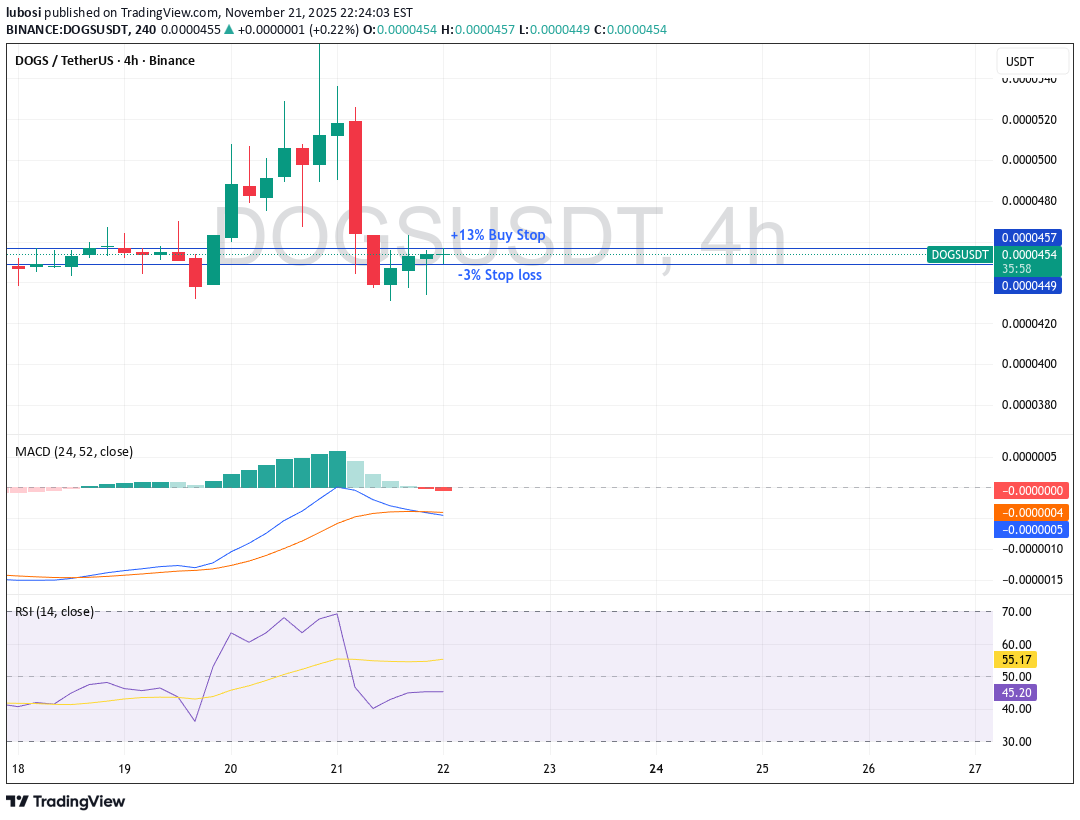
Weekly: Hammer+ → Light Green (strong weekly bullish hammer) Daily: Hammer → Light Green (bullish daily hammer) 4H: Rising Three Soldiers+ → Light Red (bullish candlestick pattern, but 4H MACD is a short-term pullback) Step 1 — base MACD color probability Row Weekly Light Green / Daily Light Green / 4H Light Red → Low–Moderate (55–65%). Use the midpoint for calculation: Base MACD probability = 60%. (Arithmetic check: 55 + 65 = 120; midpoint = 120 ÷ 2 = 60.) Step 2 — adjust for candlestick patterns (how strong each pattern is on its timeframe) Weekly Hammer+ (strong weekly bullish hammer) → +10% (weekly patterns carry heavy weight). Daily Hammer (daily bullish hammer) → +8% (meaningful daily confirmation). 4H Rising Three Soldiers but MACD = Light Red → the candle is bullish, but the MACD color is a short-term pullback, so we give a small +2% (pattern helps, but momentum mismatch reduces its effect). Step 3 — digit-by-digit arithmetic (exact) Start with base: 60 Add Weekly hammer+: 60 + 10 = 70 Add Daily hammer: 70 + 8 = 78 Add 4H rising three soldiers (small bump): 78 + 2 = 80 Final result = 80% Final answer ➡️ Estimated Bullish Probability: 80% Quick interpretation / trade guidance Weekly + Daily both show bullish hammers → strong higher-timeframe bias is up. 4H shows a bullish candle pattern (Rising Three Soldiers) but MACD is Light Red — that indicates a short-term pullback or consolidation. The candlestick pattern reduces the risk of immediate reversal but the MACD color suggests waiting for a 4H flip to green for the cleanest entry. Practical entries: scale in on strength, or wait for 4H Light Red → Light Green flip (or a strong bullish 4H close). Use a stop below the 4H structure; consider a larger position if 4H confirms. Rocket boost this content to learn more. Warning!! Trading is risky please use a simulation trading account before you trade with real money
Disclaimer
Any content and materials included in Sahmeto's website and official communication channels are a compilation of personal opinions and analyses and are not binding. They do not constitute any recommendation for buying, selling, entering or exiting the stock market and cryptocurrency market. Also, all news and analyses included in the website and channels are merely republished information from official and unofficial domestic and foreign sources, and it is obvious that users of the said content are responsible for following up and ensuring the authenticity and accuracy of the materials. Therefore, while disclaiming responsibility, it is declared that the responsibility for any decision-making, action, and potential profit and loss in the capital market and cryptocurrency market lies with the trader.