Technical analysis by lubosi about Symbol DOGS: Buy recommendation (11/22/2025)

lubosi
راز افزایش 8 درصدی سود: ترکیب چکش هفتگی و روزانه با 3 سرباز صعودی 4 ساعته
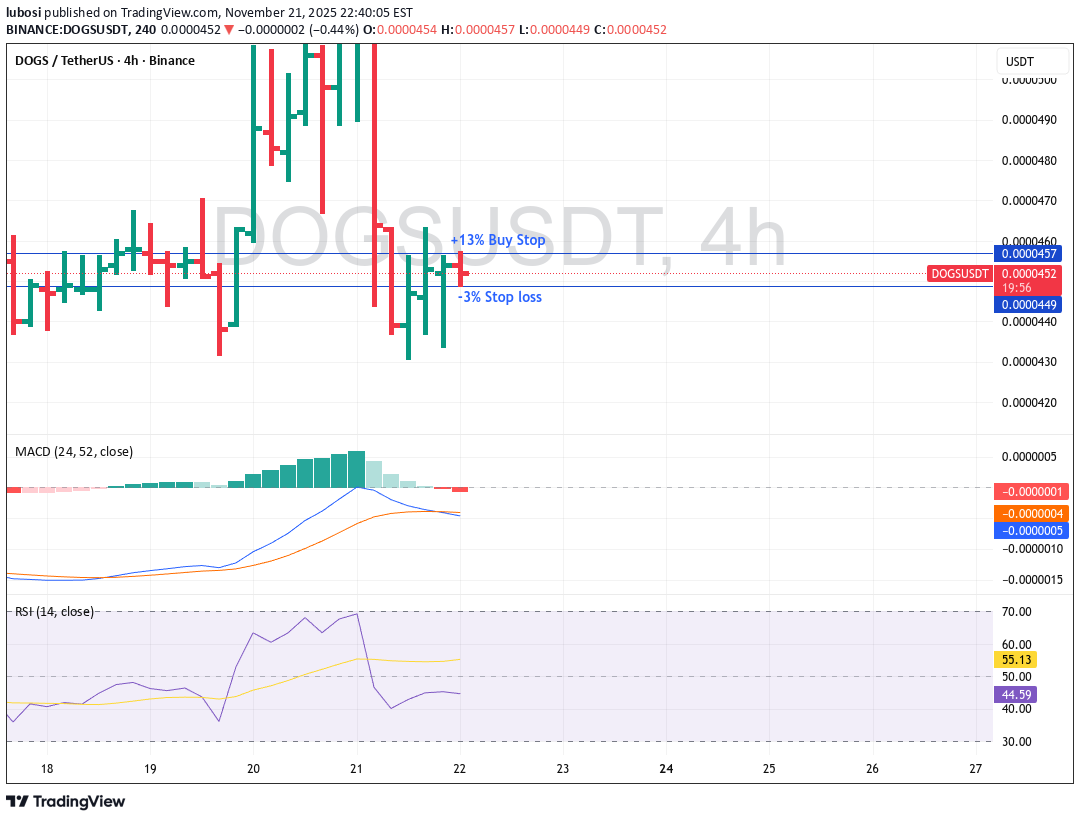
📈 Understanding Multi-Timeframe Confluence: Weekly & Daily Hammer + 4H Rising Three Soldiers (MACD Color System) Trading success comes from recognizing when multiple timeframes begin speaking the same language. Today, we dive into a high-probability bullish setup using a combination of: Candlestick patterns MACD Color Code System Weekly → Daily → 4H alignment This analysis breaks down why this configuration produces an 80% bullish probability, and how traders can approach it with precision. 🔶 The Setup We combine three powerful elements: 1️⃣ Weekly Timeframe Pattern: Hammer+ MACD Color: Light Green Interpretation: Strong higher-timeframe rejection of lows. Trend is stabilizing and preparing for a bullish continuation. 2️⃣ Daily Timeframe Pattern: Hammer MACD Color: Light Green Interpretation: Buyers are stepping back in. Daily structure supports the formation of a medium-term bottom. 3️⃣ 4H Timeframe Pattern: Rising Three Soldiers MACD Color: Light Red Interpretation: The candle pattern shows aggressive bullish drive, but MACD Light Red indicates a temporary pullback or a slowdown in momentum. This mismatch matters—but it doesn’t kill the setup. 🧠 What the Multi-Timeframe Alignment Tells Us When Weekly and Daily have strong bullish candlestick patterns and both show Light Green MACD, it creates a dominant upward bias. The 4H Rising Three Soldiers adds short-term structure confirmation, but the Light Red MACD warns that price may still be in a pullback before the next leg up. Together, this equals a powerful trend formation with a temporary pause—ideal for building positions. 📊 Probability Breakdown Using the MACD Color Probability System + Candlestick Reinforcement: Weekly Hammer+ (Light Green): +10% Daily Hammer (Light Green): +8% 4H Rising Three Soldiers (Light Red): +2% Base MACD probability (W-LG / D-LG / 4H-LR): 60% ⭐ Final Bullish Probability: 80% This level indicates a statistically meaningful bullish confluence. 🎯 How to Trade This Setup on TradingView ✔ 1. Identify Confirmation on 4H Even though the candlestick pattern is bullish, the MACD color (Light Red) signals slowing momentum. Wait for: 4H Light Red → Light Green, or A strong bullish 4H close above the prior candle high. This reduces noise and avoids early entries. ✔ 2. Build Your Position Near a Pullback Because higher timeframes are bullish, pullbacks on 4H are opportunities. Ideal entries: 38.2%–61.8% Fibonacci retracement of the Rising Three Soldiers move Breakout from the third soldier’s high Retest of rejected levels seen on the Weekly or Daily hammer wicks ✔ 3. Stop-Loss Placement Best locations: Below the 4H Rising Three Soldiers base More conservative: below the Daily Hammer low Most conservative: below the Weekly Hammer low Choose based on your risk tolerance. ✔ 4. Target Levels First target: Most recent 4H swing high Second target: Daily resistance Final target: Weekly structure high or trendline resistance Add trailing stop once price breaks out 📌 Key Takeaways Weekly + Daily bullish hammers create strong trend foundation. 4H Rising Three Soldiers shows internal momentum building. MACD Light Red on 4H adds caution—but not weakness. Combined impact results in an 80% bullish probability. Smart entry timing allows traders to ride the next push with controlled risk. Rocket boost this content to learn more ⚠️ Disclaimer Before using any strategy, indicator, or probability model shown here, always practice on a simulation / demo trading account first to understand the risks and behavior of the system. Only trade with money you can afford to lose.