
lubosi
@t_lubosi

What symbols does the trader recommend buying?
Purchase History
پیام های تریدر
Filter
lubosi
چرا اتریوم برنده است؟ استراتژی پولسازی خلاف جریان بازار!
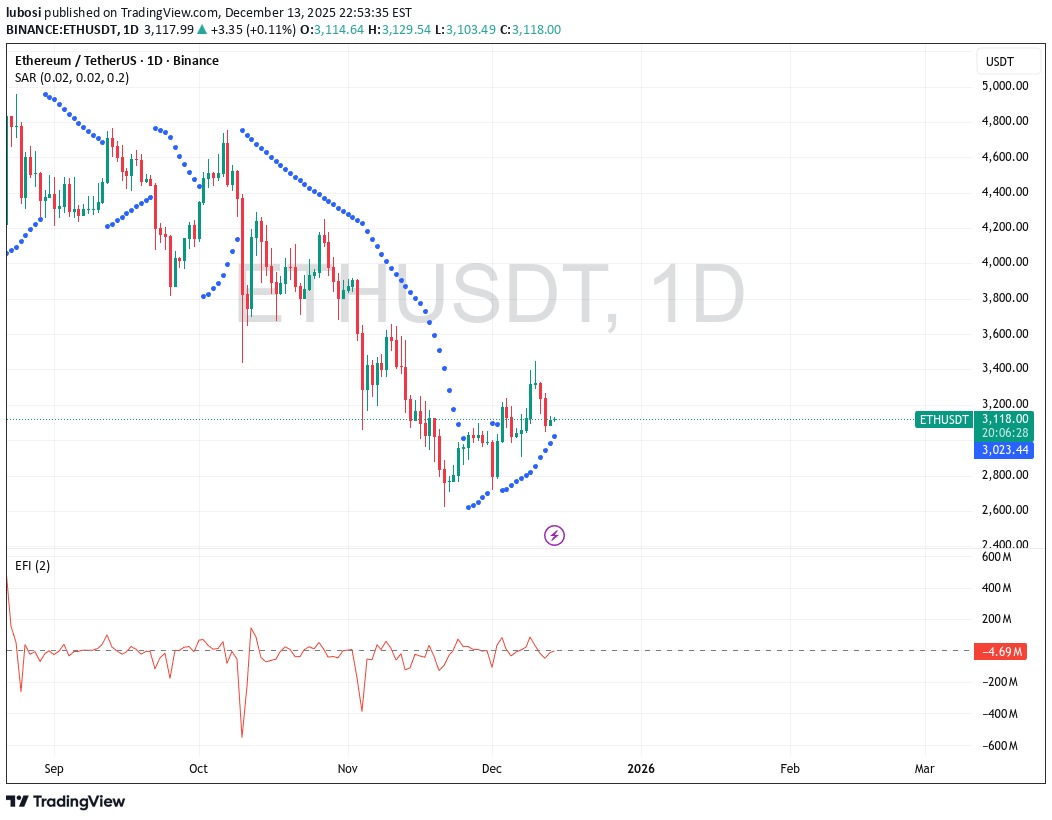
My trading tools for accessing the markets are getting old. Tools like a old laptop is where you have challenges like power supply which is low as i write this to you. I have kept coming back to the markets to learn how to trade the right way. I didn't want to reach this level where i go against the crowd but its necessary especially if you want to make money in the markets You have to go against the crowd that is the mast have The crowd will steer you wrong even if you are going the right way and so as an independent thinker you Have to trade with the mindset of going against the crowd. Because the force index is still negative you can still add to your current trading position Rocket boost this content to learn more. Disclaimer: Trading is risky please learn risk management and profit taking strategies.Also use a simulation trading account before you trade with real money
lubosi
Bitcoin The #1 Crypto Is Trending Up
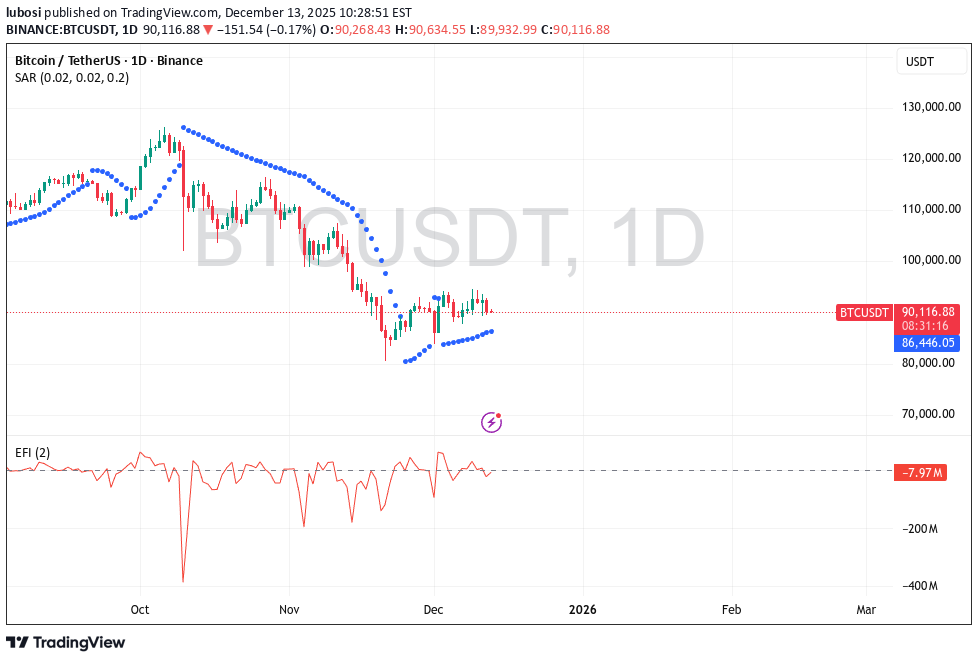
Am looking at this chart and its hard to believe that i have found a way to Buy Bitcoin. This is the New Low Swing Below is the indicator called the force index. Which is in negative territory when the price action on the force index is in negative territory then thats your buy signal Here are 3 other cryptos trending up: ETHUSDT ADAUSDT PEPEUSDT Something happened this past week but the Bitcoin price has found a bottom and this is the time to enter your position in this huge opportunity. Bitcoin is building momentum. So is gold GC1! , silver SI1! and HG1! copper. This is the time you have been waiting for to protect your wealth. Even as i learn the last parabolic system in my trading education am proud to share my insights with you so thank you following me and believing in me. I have made so many trading mistakes and i will keep putting the references below so that you learn from my trading analysis mistakes. Because without those mistakes i would not have mastered a trading system. Keep learning as you go on your trading journey. You can do it. Rocket boost this content to learn more. Disclaimer:Trading is risky please use a simulation trading account before you trade with real money.
lubosi
The #1 Reason Apple is in A Buy Position Still...
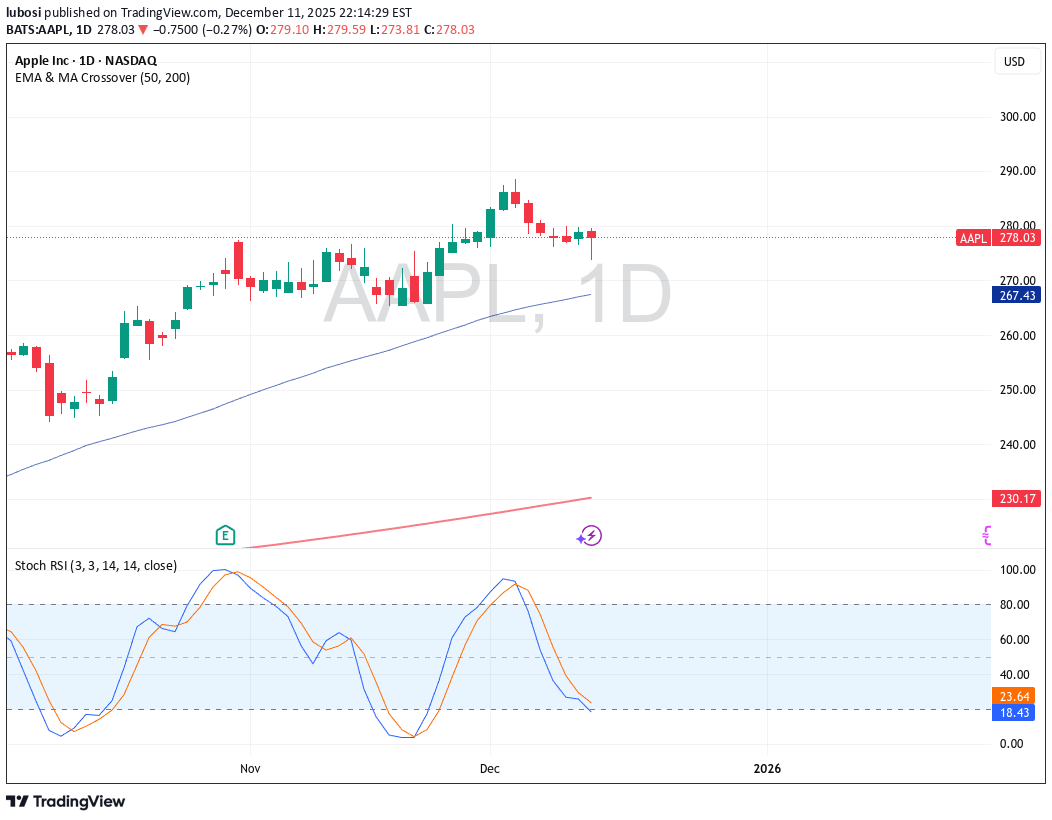
Apple is still very much a very good stock to buy my entry was yesterday...And i was very scared of this entry Because i thought it will gap up. This is what didn't happen. Even though am humbled to witness that there is still time to catch Apple. This is because if you look below you will notice that the momentum in the trade is yet to reverse itself or crossover . So this is an early entry Thats why i got whipsawed..Even though am still positive in the position If my eyes where glued to the screen during the market open i would have sold my position out of fear. This is why you have to trust your trading system no matter what. Maybe i trust my trading system to the point that i don't have to look at the screen for at-least 24 hours. If you can position your mind in the place where you don't have to look at your screen for at-least 24 hours then you know that you have found a powerful trading system. So remember the point is that on this price action we are waiting for a reversal on the momentum it hasn't yet happened so if you enter now.You will be trading a position So expect to get whipsawed and calculate you risk management accordingly. Trade safe. Rocket Boost this content to learn more Disclaimer: Trading is risky please learn risk management and profit taking strategies. Also feel free to use a simulation trading account before you trade with real money
lubosi
Te 2 Biggest Problems When Buying Stock Options
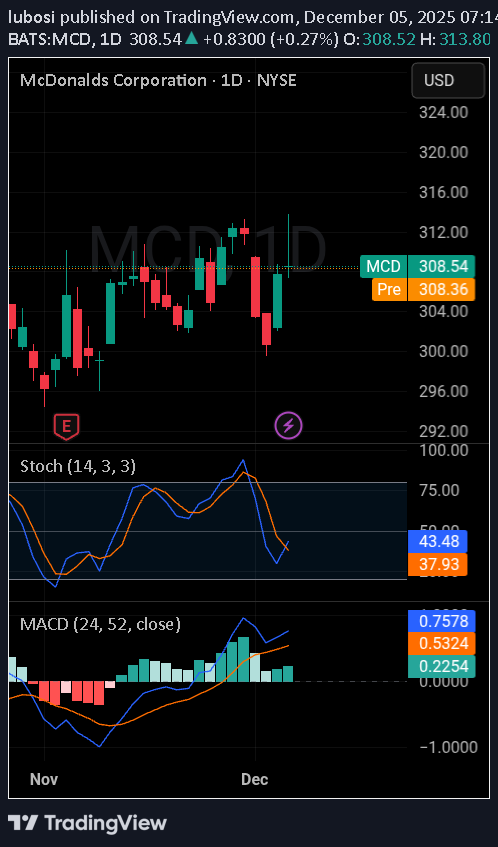
My body is in pain. Because I have been exercising. Also I did yard work. Determining the whether is not easy. Just when you think it's raining. It doesn't rain. When you think it won't rain. Then it rains. Look at this chart. The stochastic has crossed. The %k above the %d Below the 50 level. The MACD Histogram is green. This green is on the weekly time. Finally the 4h entry. The sentiment analysis is green. This shows you that buying pressure. The pressure is building. This gives you a good support. You will need support. This support will help your broker. How? You see the problems are these: ⚠️ Buying on a breakout ⚠️ Brokers poor execution during a breakout. This is what you are avoiding. When you enter on 4hour time frame sentiment. Will you ever be right when predicting the weather? Will you ever be right when predicting the market sentiment analysis? These are some questions to 🤔 about. Rocket boost 🚀 this content to learn more. Disclaimer ⚠️ Trading is risky please learn about risk management and profit taking strategies. Also feel free to use a simulation trading account before you use real money.
lubosi
راز افزایش 8 درصدی سود: ترکیب چکش هفتگی و روزانه با 3 سرباز صعودی 4 ساعته
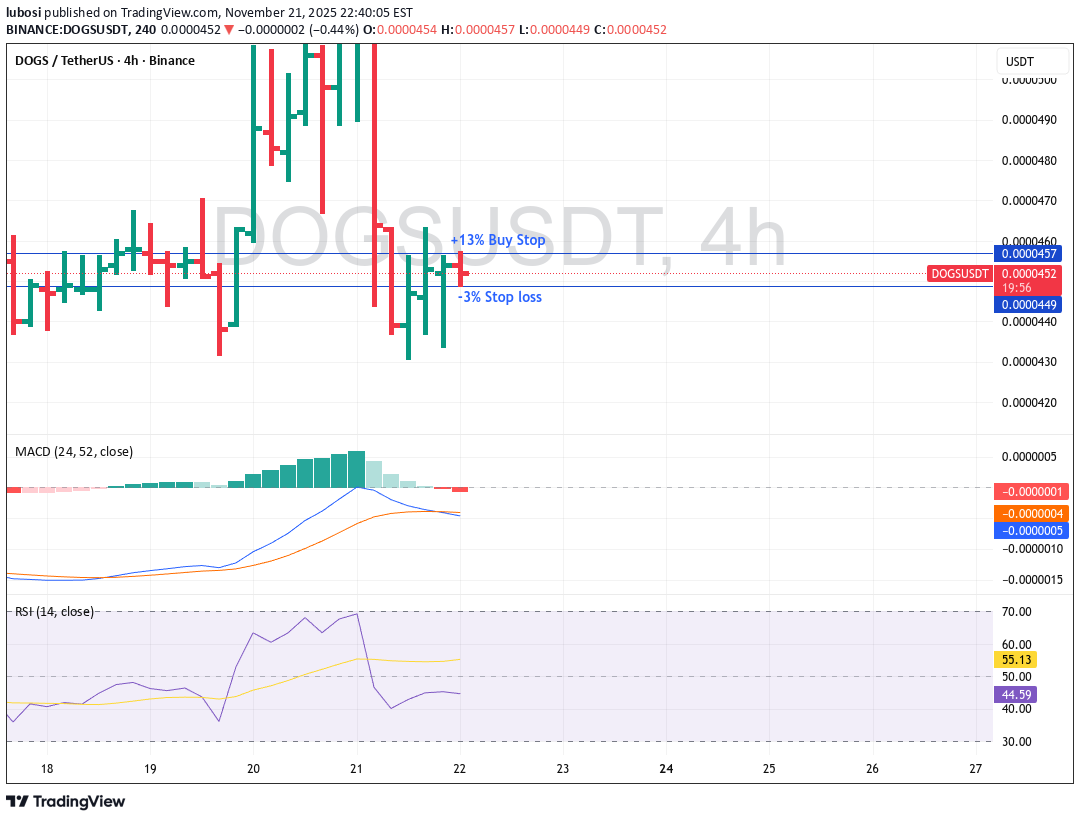
📈 Understanding Multi-Timeframe Confluence: Weekly & Daily Hammer + 4H Rising Three Soldiers (MACD Color System) Trading success comes from recognizing when multiple timeframes begin speaking the same language. Today, we dive into a high-probability bullish setup using a combination of: Candlestick patterns MACD Color Code System Weekly → Daily → 4H alignment This analysis breaks down why this configuration produces an 80% bullish probability, and how traders can approach it with precision. 🔶 The Setup We combine three powerful elements: 1️⃣ Weekly Timeframe Pattern: Hammer+ MACD Color: Light Green Interpretation: Strong higher-timeframe rejection of lows. Trend is stabilizing and preparing for a bullish continuation. 2️⃣ Daily Timeframe Pattern: Hammer MACD Color: Light Green Interpretation: Buyers are stepping back in. Daily structure supports the formation of a medium-term bottom. 3️⃣ 4H Timeframe Pattern: Rising Three Soldiers MACD Color: Light Red Interpretation: The candle pattern shows aggressive bullish drive, but MACD Light Red indicates a temporary pullback or a slowdown in momentum. This mismatch matters—but it doesn’t kill the setup. 🧠 What the Multi-Timeframe Alignment Tells Us When Weekly and Daily have strong bullish candlestick patterns and both show Light Green MACD, it creates a dominant upward bias. The 4H Rising Three Soldiers adds short-term structure confirmation, but the Light Red MACD warns that price may still be in a pullback before the next leg up. Together, this equals a powerful trend formation with a temporary pause—ideal for building positions. 📊 Probability Breakdown Using the MACD Color Probability System + Candlestick Reinforcement: Weekly Hammer+ (Light Green): +10% Daily Hammer (Light Green): +8% 4H Rising Three Soldiers (Light Red): +2% Base MACD probability (W-LG / D-LG / 4H-LR): 60% ⭐ Final Bullish Probability: 80% This level indicates a statistically meaningful bullish confluence. 🎯 How to Trade This Setup on TradingView ✔ 1. Identify Confirmation on 4H Even though the candlestick pattern is bullish, the MACD color (Light Red) signals slowing momentum. Wait for: 4H Light Red → Light Green, or A strong bullish 4H close above the prior candle high. This reduces noise and avoids early entries. ✔ 2. Build Your Position Near a Pullback Because higher timeframes are bullish, pullbacks on 4H are opportunities. Ideal entries: 38.2%–61.8% Fibonacci retracement of the Rising Three Soldiers move Breakout from the third soldier’s high Retest of rejected levels seen on the Weekly or Daily hammer wicks ✔ 3. Stop-Loss Placement Best locations: Below the 4H Rising Three Soldiers base More conservative: below the Daily Hammer low Most conservative: below the Weekly Hammer low Choose based on your risk tolerance. ✔ 4. Target Levels First target: Most recent 4H swing high Second target: Daily resistance Final target: Weekly structure high or trendline resistance Add trailing stop once price breaks out 📌 Key Takeaways Weekly + Daily bullish hammers create strong trend foundation. 4H Rising Three Soldiers shows internal momentum building. MACD Light Red on 4H adds caution—but not weakness. Combined impact results in an 80% bullish probability. Smart entry timing allows traders to ride the next push with controlled risk. Rocket boost this content to learn more ⚠️ Disclaimer Before using any strategy, indicator, or probability model shown here, always practice on a simulation / demo trading account first to understand the risks and behavior of the system. Only trade with money you can afford to lose.
lubosi
احتمال صعودی بازار ۸۰٪ شد: راز تحلیل کندل استیکها و MACD فاش شد!
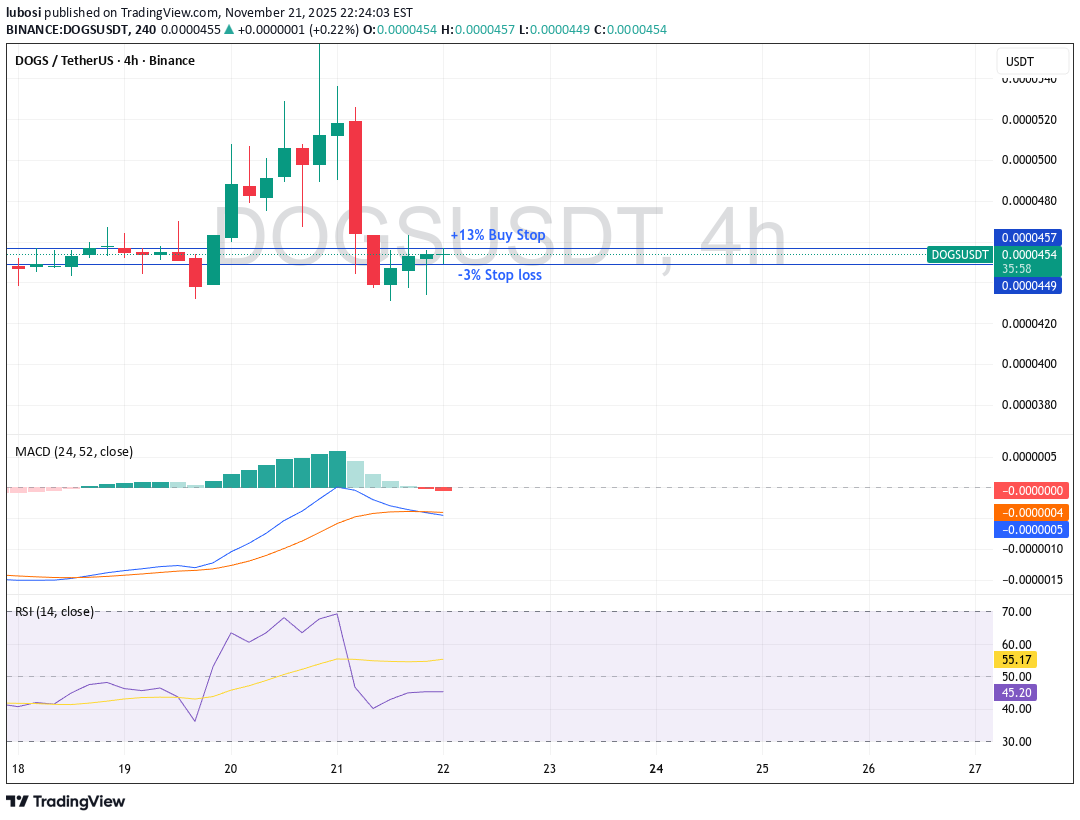
Weekly: Hammer+ → Light Green (strong weekly bullish hammer) Daily: Hammer → Light Green (bullish daily hammer) 4H: Rising Three Soldiers+ → Light Red (bullish candlestick pattern, but 4H MACD is a short-term pullback) Step 1 — base MACD color probability Row Weekly Light Green / Daily Light Green / 4H Light Red → Low–Moderate (55–65%). Use the midpoint for calculation: Base MACD probability = 60%. (Arithmetic check: 55 + 65 = 120; midpoint = 120 ÷ 2 = 60.) Step 2 — adjust for candlestick patterns (how strong each pattern is on its timeframe) Weekly Hammer+ (strong weekly bullish hammer) → +10% (weekly patterns carry heavy weight). Daily Hammer (daily bullish hammer) → +8% (meaningful daily confirmation). 4H Rising Three Soldiers but MACD = Light Red → the candle is bullish, but the MACD color is a short-term pullback, so we give a small +2% (pattern helps, but momentum mismatch reduces its effect). Step 3 — digit-by-digit arithmetic (exact) Start with base: 60 Add Weekly hammer+: 60 + 10 = 70 Add Daily hammer: 70 + 8 = 78 Add 4H rising three soldiers (small bump): 78 + 2 = 80 Final result = 80% Final answer ➡️ Estimated Bullish Probability: 80% Quick interpretation / trade guidance Weekly + Daily both show bullish hammers → strong higher-timeframe bias is up. 4H shows a bullish candle pattern (Rising Three Soldiers) but MACD is Light Red — that indicates a short-term pullback or consolidation. The candlestick pattern reduces the risk of immediate reversal but the MACD color suggests waiting for a 4H flip to green for the cleanest entry. Practical entries: scale in on strength, or wait for 4H Light Red → Light Green flip (or a strong bullish 4H close). Use a stop below the 4H structure; consider a larger position if 4H confirms. Rocket boost this content to learn more. Warning!! Trading is risky please use a simulation trading account before you trade with real money
lubosi
سقوط 12 درصدی سهام متا: فرصت خرید است یا دام جدید؟ (درسهای مدیریت ریسک)
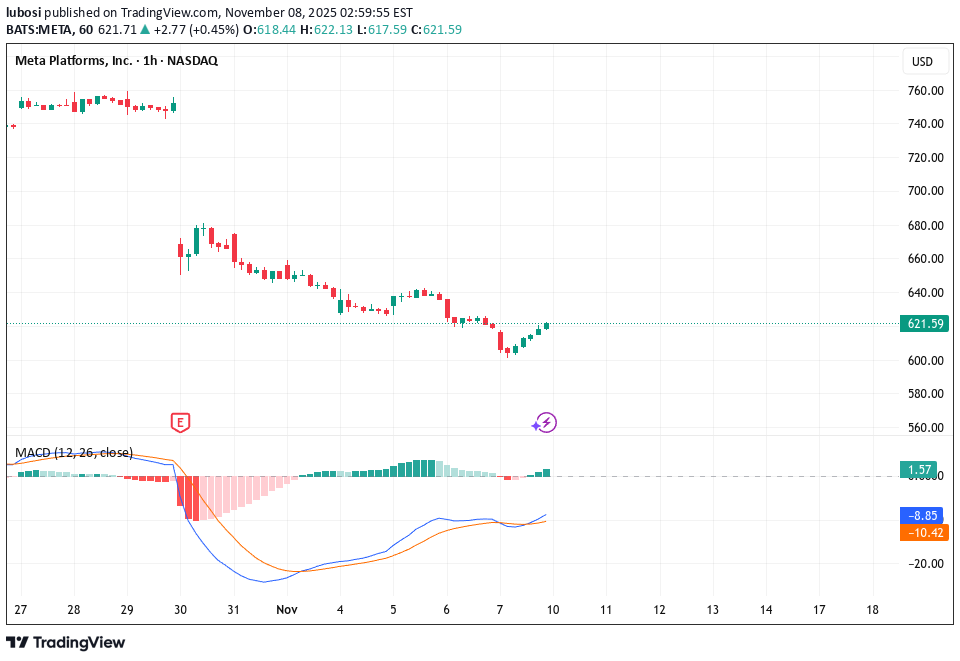
Am so humbled because i believe i have learned how to find the best opportunities to trade. But i have to tell you that these trading ideas are not a promise for you to make money The reason i have to tell you this is because the spirit of becoming a trader comes with a lot of humility. You will notice the "gurus" marketing to you."How to make $$$" this is a trap dont fall for it. It has taken me 8 years!! to master trading and let me tell you am still learning Let me tell you why am still learning its called risk management every time the economy is doing bad the banks decide to increase the cost of borrowing capital. This means if you where used to risking only lets say -10% after the banks increase the price of borrowing you may have to adjust your emotions to be ready to risk -20% per trade. Thats the reason why you have to be humble no matter what you are going through. As you begin your trading journey. It wont be easy, Another thing that will keep you humble is dealing with lagging indicators. This will mean sometimes you will have to hold your position during consolidation periods. or flat markets. developing your own trading skill will be the key to your trading journey but learning from other traders and not to copy them will help you as well. am always scared to share my ideas because i dont know if you will understand and if you will use the proper risk management strategies. One time i spoke with a friend of mine and every time i spoke to him about trading i left with a bad feeling...this is why i dont tell people about trading anymore. If they ask i always try to change the topic to business such as becoming a marketeer on the streets or market place. I usually say this. "Am like a marketeer the only difference is that am using a computer." I dont give stock tips or what to buy...nothing!! i just say that and leave them hanging in the air. i want to protect my trading mindset and am not going to allow anyone inside this mind including you the only thing i can safely show you is the MACD indicator its my safety net. its not my main tool but it shows you that the buyers are stepping. This price action you are seeing on this hourly chart is called the morning star pattern. This crash is an opportunity to buy this stock at a discount. Full disclosure am not participating in this buying of META This idea is just a personal analysis of the price action. Trade safe. Rocket boost this content to learn more. Disclaimer: Trading is risky please learn risk management and profit taking strategies. Also feel free to use a simulation trading account before you trade with real money.
lubosi
سقوط بیت کوین ۲۰۲۵: این فرصتی است که منتظرش بودید!
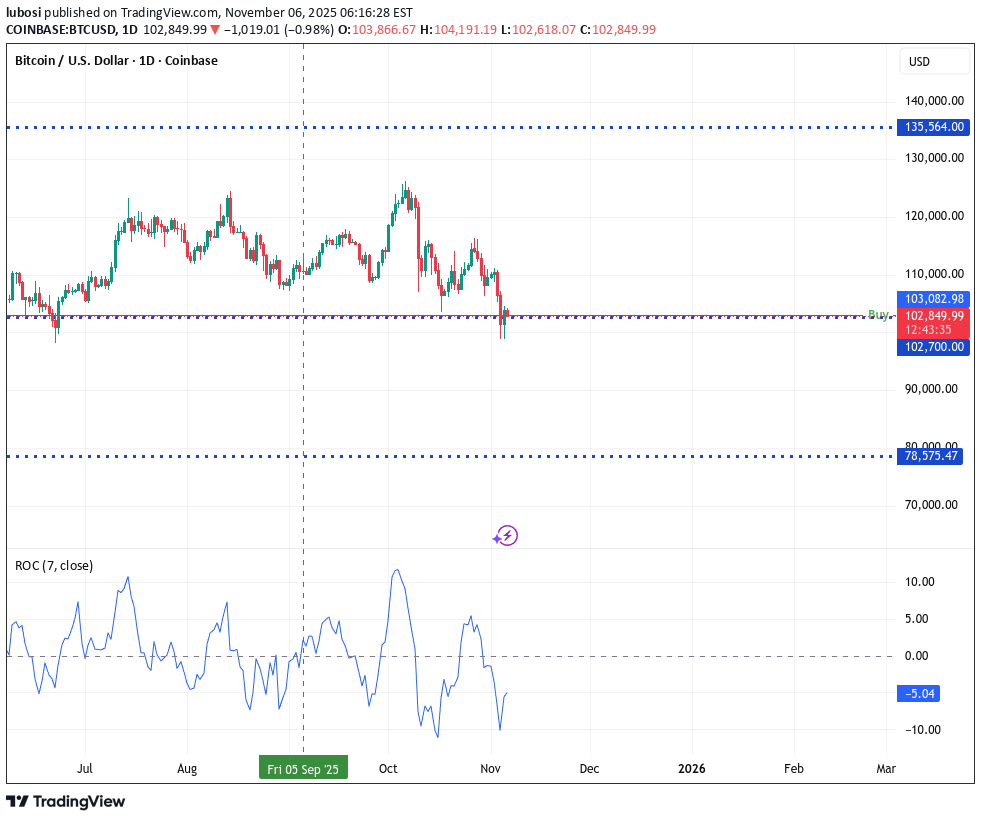
Look at the Rate of Change...do you notice the shift in momentum? This means buyers are coming in to scope the price of Bitcoin.. Listen to me Bitcoin is not going to zero.. This is the type of crash that you have been looking for. This is the time to start buying up as much bitcoin as possible. You will be actually getting Bitcoin at a discount. The momentum indicator below is your key to understanding market psychology This is not time to get negative and listen to main stream media this is your chance to prove to yourself that you understand "The bottom" of the market. I have a confession... the rocket booster strategy is based on a false crowd psychology It means because everyone knows about it the strategy no longer works.. Does this mean you give up on trading? No of course not. But what i want you to get from the rocket booster strategy is the behaviour of the WRONG Crowd. Also understand that the price action has to show you a new high or new low depending on whether you are buying or selling. Rocket boost this content to learn more. Disclaimer:Trading is risky please use risk management and profit taking strategies. And use a simulation trading account before you trade with real money
lubosi
هشدار خرید طلا: استراتژی "راکت بوستر" برای سرمایهگذاری قبل از بحران بزرگ!
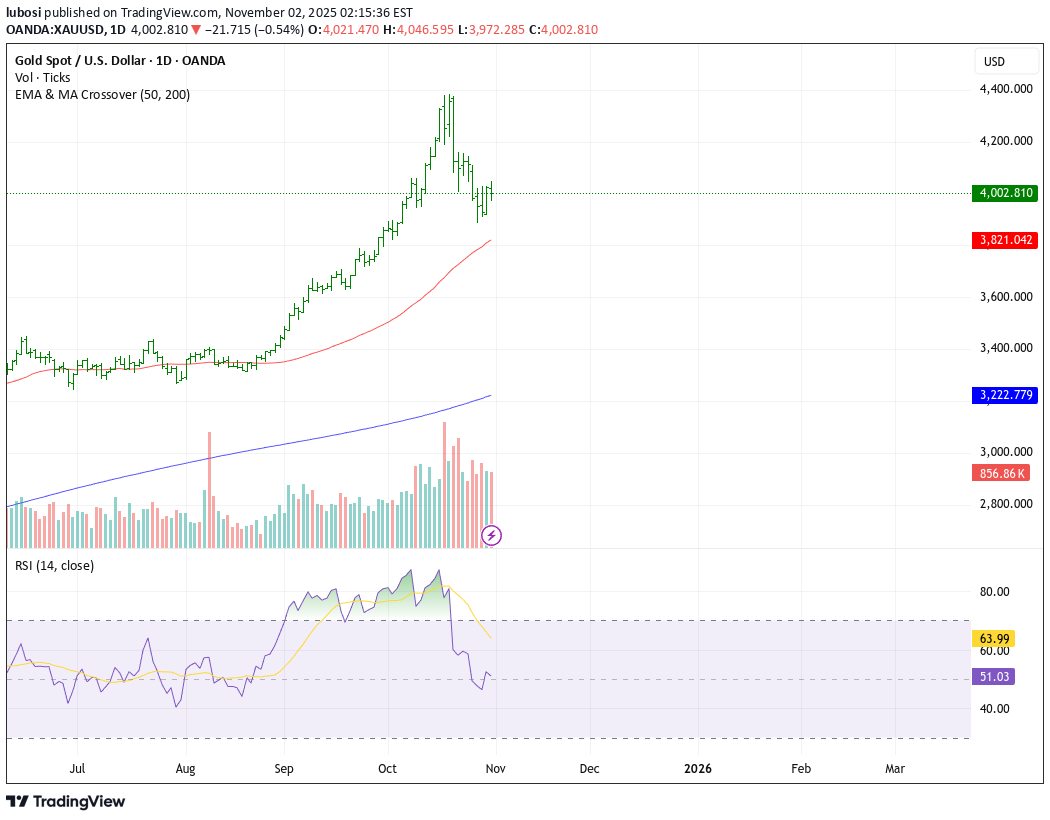
So i sat in this restaurant very quiet and i was not alone. Along side some beautiful waitress but she was rude to all customers she had the script down to a memory saying, "The price total is..." She mentions the exact same total almost like she knew what the guys would order. "I want a shawama...and.." "How much is the drink?" "Okay give me water", i said. I reduced my total order to cost by 20% just by ordering water instead of the soft drink which included the common price she kept giving other customers. I felt like i won the price war. Water and shawama The best combination. I looked at my smart phone screen. Checking the price of Gold. Then it hit me... "GOLD!!" I have to buy gold. The economy is going to shambles...you need to prepare this next global crisis is going to be massive. Make sure you stick to your strategy As for me its Buying Gold I have been buying gold for a while on the simulation trading account for practise...and now is the time i think i have mastered how to buy Gold. Using the rocket booster strategy What is the rocket booster strategy? : 1-The price should be above the 50 EMA 2-The price should be above the 200 EMA 3-The price should gap up You will see this gap up in momentum using the RSI indicator below this price action pattern Trade safe. Rocket boost this content to learn more. Disclaimer: Trading is risky please learn about risk management and profit taking strategies,. Also feel free to use a simulation trading account before you trade with real money.
lubosi
تقاطع طلایی بیتکوین: آیا طلای جهانی وارد فاز صعودی قدرتمندی میشود؟
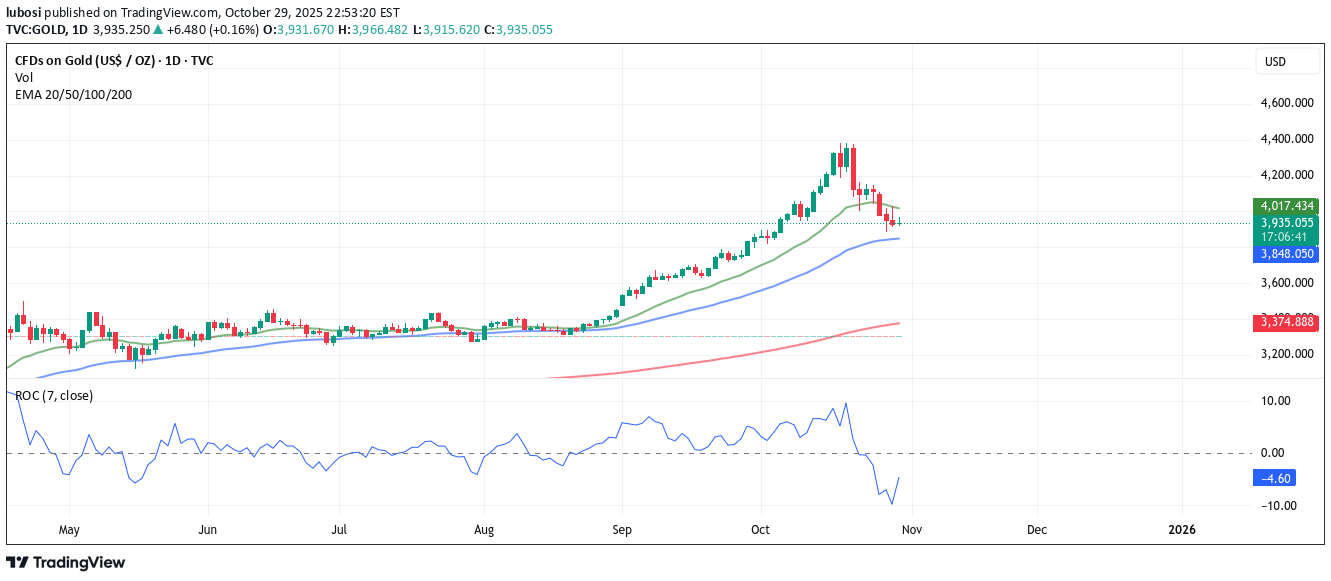
Gold Finds Strong Support: Golden Cross Signals Uptrend Ahead Gold prices have recently shown signs of renewed strength, finding solid support as a powerful technical pattern — the Golden Cross — has formed on the charts. This bullish signal is often viewed as the beginning of a potential long-term uptrend, attracting both institutional and retail traders seeking confirmation that momentum is shifting upward. Understanding the Golden Cross A Golden Cross occurs when the 50-day moving average crosses above the 200-day moving average. This technical event indicates that short-term momentum is overtaking long-term trends — a classic sign that buyers are regaining control after a period of consolidation or decline. In the case of gold (XAU/USD), this crossover reflects growing optimism amid global economic uncertainty, weakening currencies, and steady demand from central banks for bullion. The 50-day moving average has now pushed above the 200-day line, confirming bullish sentiment and technical support. Support Levels Holding Firm Gold recently tested and bounced from a critical support zone near $3,930 per ounce, showing that buyers are stepping in aggressively at lower levels. The price has since built a series of higher lows, reinforcing the structure of an emerging uptrend. Moreover, volume has been increasing during rallies — a healthy sign that institutional traders are participating in the move. Momentum indicators such as the MACD have also turned positive, aligning with the bullish crossover and strengthening the case for continued gains. Why This Matters for Traders and Investors The Golden Cross is not just a chart pattern — it reflects a psychological shift. When it appears, traders often interpret it as confirmation that a previous downtrend has reversed. Historically, gold has tended to rally strongly in the months following a confirmed Golden Cross. Beyond the technical picture, fundamental tailwinds support the move: Geopolitical uncertainty continues to drive safe-haven demand. Central bank purchases remain strong, particularly from emerging economies diversifying away from the U.S. dollar. Inflation concerns and lower real yields make non-yielding assets like gold more attractive. Outlook With gold prices holding above the key $3,930 support zone and the Golden Cross now confirmed, the technical outlook points toward further upside potential. A sustained move above $4,000 could open the door to retesting all-time highs and possibly breaking into a new bullish phase. As long as the moving averages remain aligned in bullish formation, pullbacks may be viewed as buying opportunities rather than signs of weakness. In summary: Gold has found strong support at $3,930 and is now guided higher by the momentum of a Golden Cross — a signal that both technical traders and long-term investors are watching closely. The precious metal’s trend is turning golden once again.
Disclaimer
Any content and materials included in Sahmeto's website and official communication channels are a compilation of personal opinions and analyses and are not binding. They do not constitute any recommendation for buying, selling, entering or exiting the stock market and cryptocurrency market. Also, all news and analyses included in the website and channels are merely republished information from official and unofficial domestic and foreign sources, and it is obvious that users of the said content are responsible for following up and ensuring the authenticity and accuracy of the materials. Therefore, while disclaiming responsibility, it is declared that the responsibility for any decision-making, action, and potential profit and loss in the capital market and cryptocurrency market lies with the trader.