
COMP
Compound
| تریدر | نوع سیگنال | حد سود/ضرر | زمان انتشار | مشاهده پیام |
|---|---|---|---|---|
 behdarkRank: 31397 | خرید | حد سود: تعیین نشده حد ضرر: تعیین نشده | 2 hour ago | |
 mastercrypto2020Rank: 31990 | خرید | حد سود: تعیین نشده حد ضرر: تعیین نشده | 12/22/2025 |
Price Chart of Compound
سود 3 Months :
سیگنالهای Compound
Filter
Sort messages by
Trader Type
Time Frame
behdark
COMP Analysis (4H)
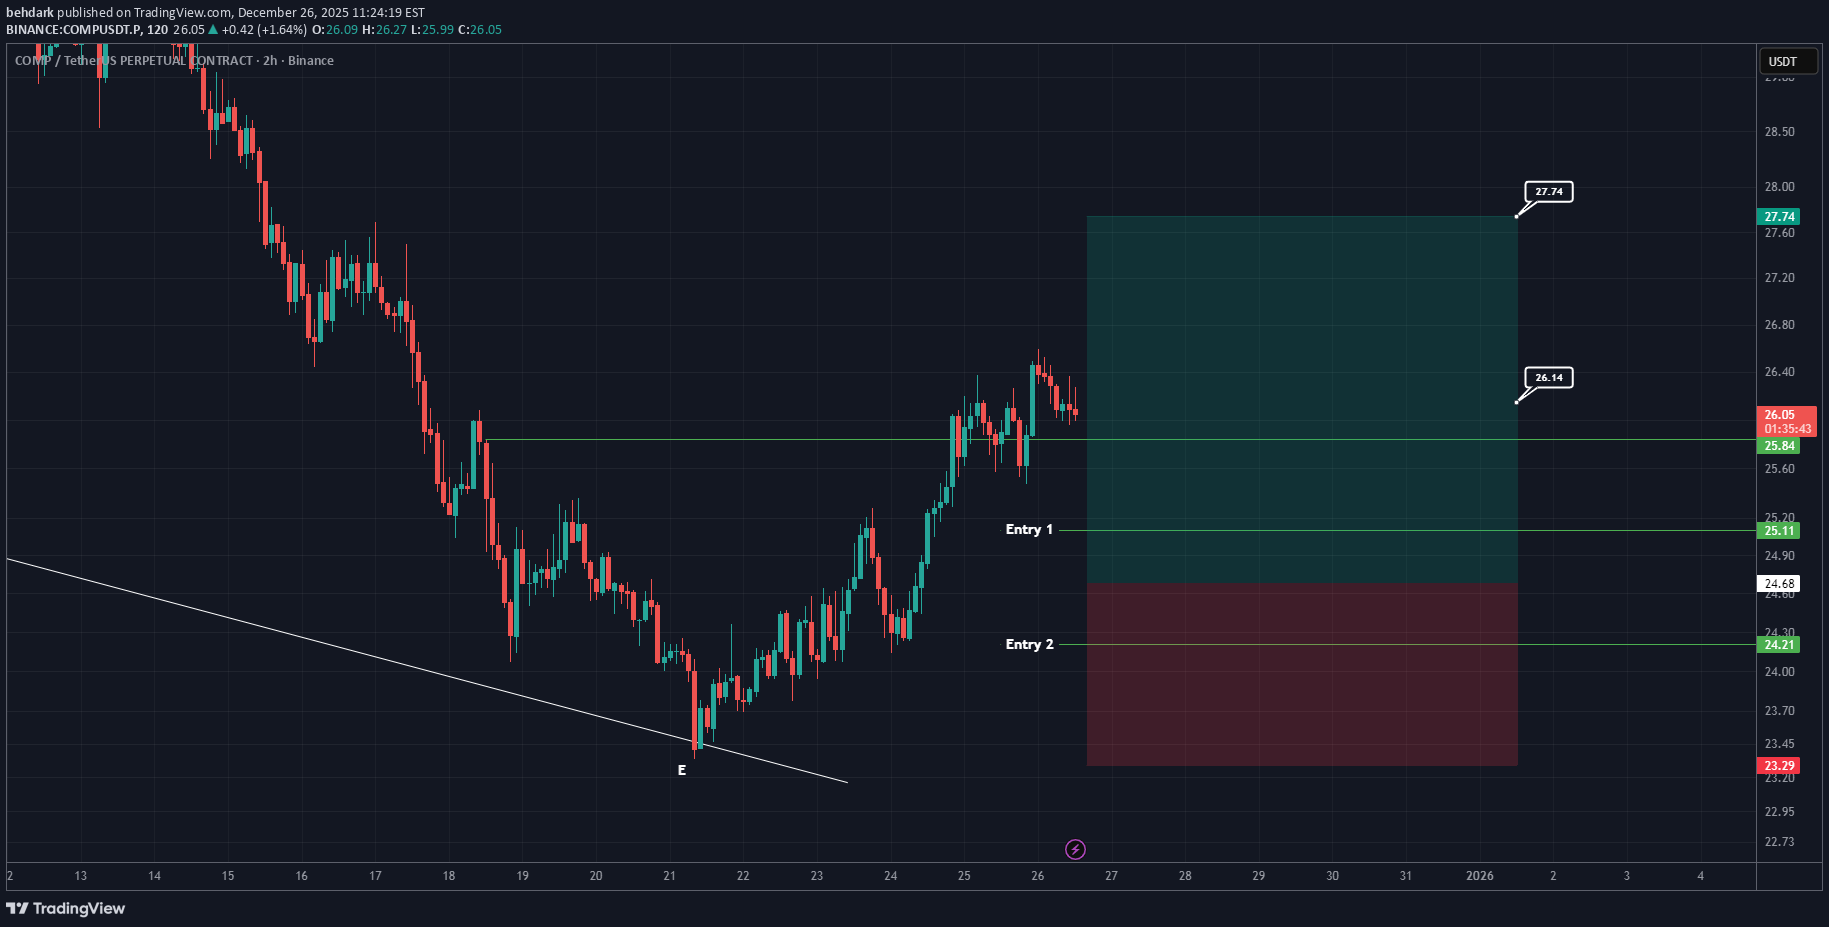
It seems that wave E of the corrective diamond pattern has completed, and COMP is about to enter the bullish wave F of this pattern. If the price reaches our entry points, we can enter the position using DCA. The targets are marked on the chart. A daily candle closing below the invalidation level will invalidate this analysis. For risk management, please don't forget stop loss and capital management When we reach the first target, save some profit and then change the stop to entry Comment if you have any questions Thank You

COMP Testing Descending Channel Support After Breakdown
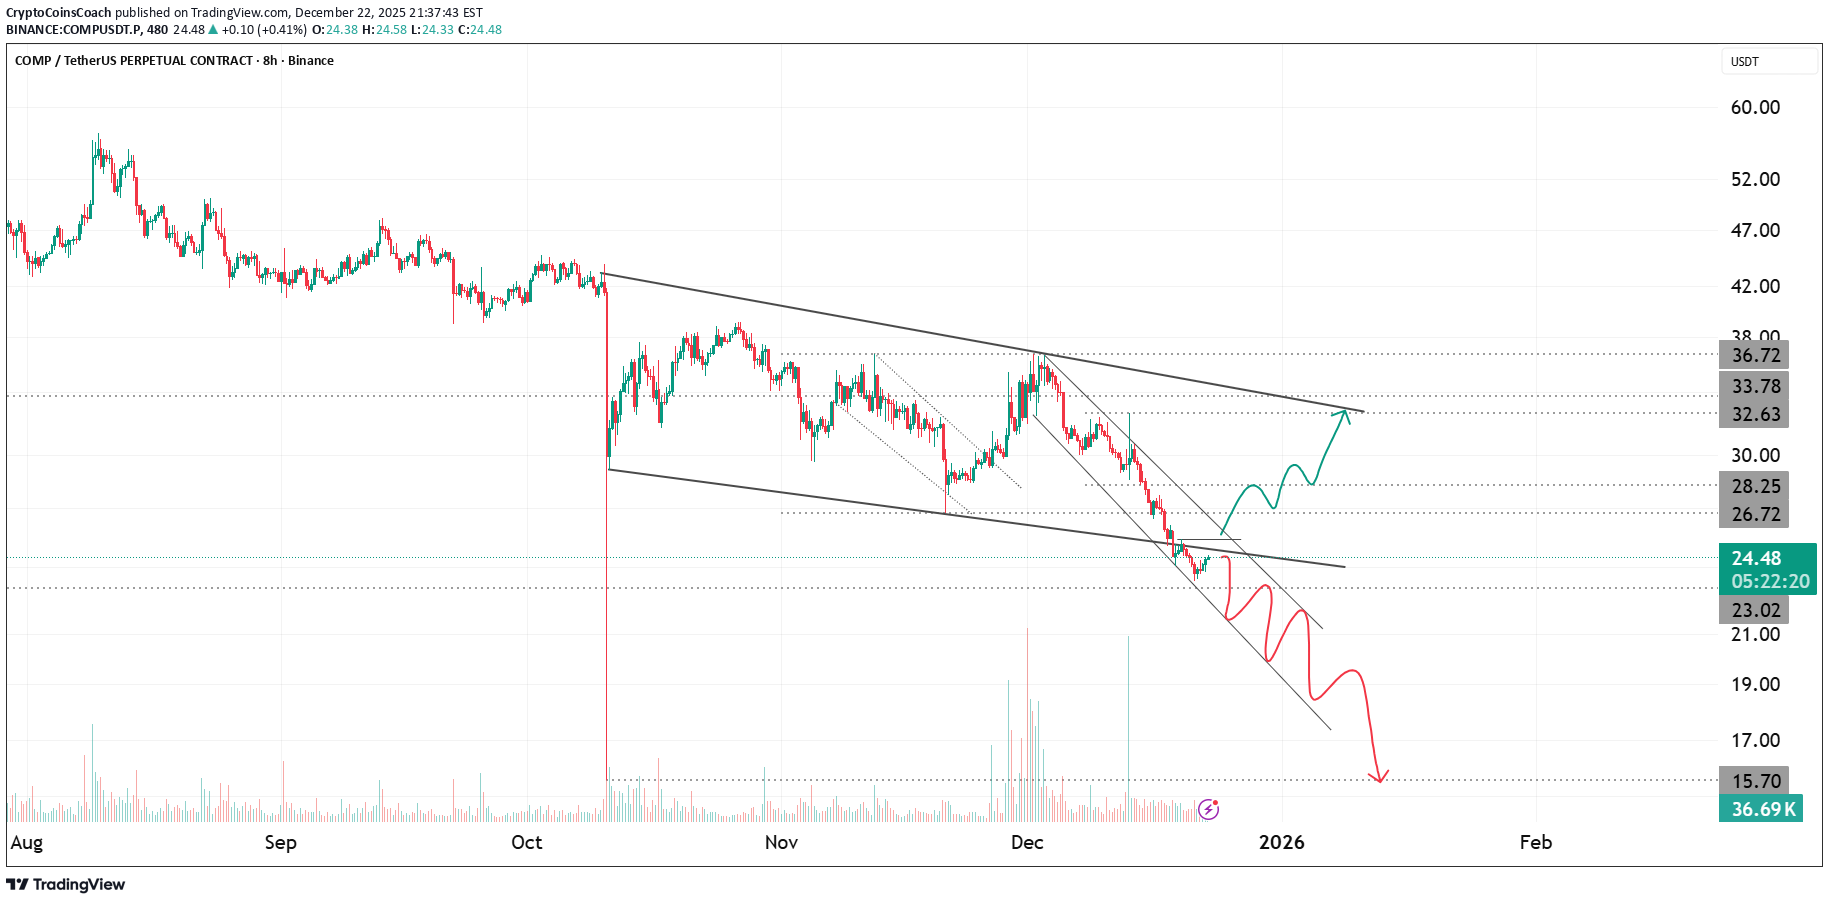
COMP has been trading inside a well-defined descending channel for several months, reflecting sustained bearish market structure. Price recently moved toward the lower boundary of this channel and is now hovering near a key support zone after a sharp sell-off. The recent move shows price reacting near channel support, but the structure remains weak as long as COMP stays below the broken internal trendlines. A short-term relief bounce is possible if buyers manage to defend this zone and push price back toward the mid-channel area around the upper twenties to low thirties. However, failure to reclaim lost structure keeps the downside risk active. A clean continuation below current support would expose the lower demand zone near the mid-teens, aligning with the broader bearish trend. This setup is driven by descending channel behavior, post-breakdown consolidation, and weak recovery attempts. Directional conviction should only be taken after a clear reclaim or rejection of the current support area.
mastercrypto2020
comp usdt long signal
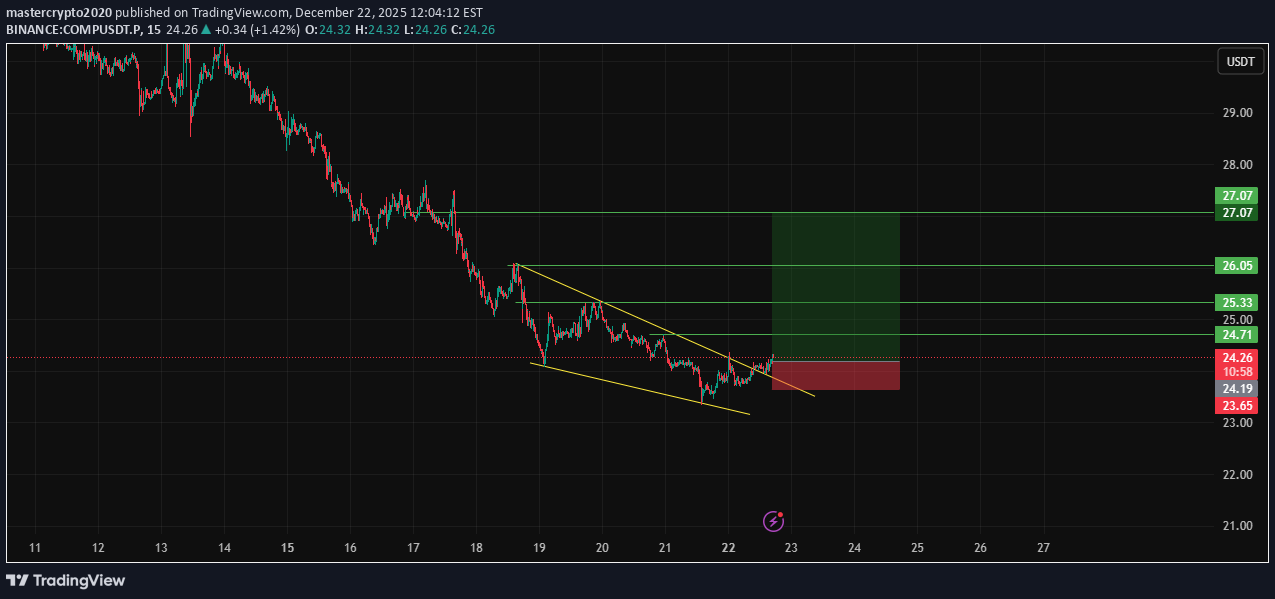
📢 Official Trade Signal – COMP/USDT 📈 Position Type: LONG 💰 Entry Price: 24.20 (Limit Order) 🎯 Take-Profit Targets (Partial Exits): • TP1: 24.71 • TP2: 25.33 • TP3: 26.00 • TP4: 27.00 • TP5: — • TP6: — 🛑 Stop-Loss: 23.60 📊 Timeframe: 15m ⚖️ Risk/Reward Ratio: TBD 💥 Suggested Leverage: 10– 5× 🧠 Technical Analysis Summary COMP/USDT shows bullish momentum near the 24.20 support level. The 15m chart indicates strong buying interest and accumulation, signaling a potential upward move toward our TP levels. Partial take-profits align with key liquidity zones: 24.71 → 25.33 → 26.00 → 27.00 Breaking TP1 (24.71) increases probability of reaching higher targets. ⚙️ Trade Management Rules ✔ Take partial profit at TP1 ✔ Move SL to Break-Even once TP1 hits ✔ Trail SL as price moves toward higher targets ✔ Avoid re-entry if SL is hit ✔ Confirm bullish structure before entering 📌 TradingView Hashtags #COMPUSDT #COMP #CryptoSignal #LongSetup #TradingView #FuturesTrading #Altcoins #TechnicalAnalysis

wolffxtrader
comp
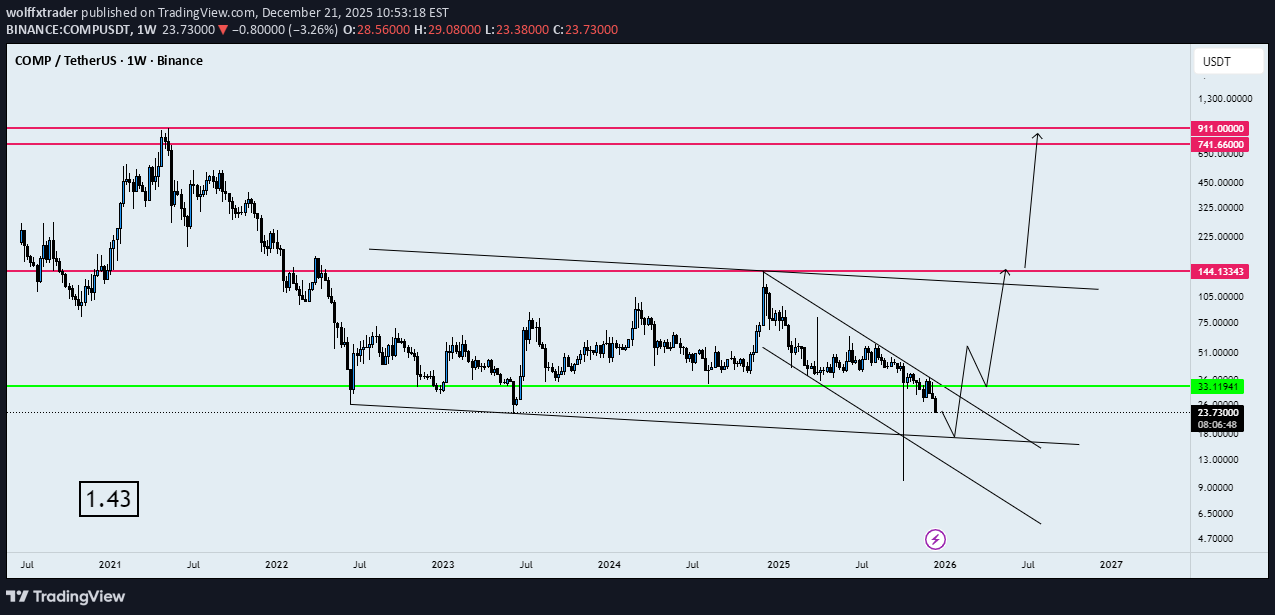
hello traders how are you today? as you can see price started a big correction and i think bulls are coming back and i want to buy at the correction. be safe enjoy.

Silvio_TraderskyZahvat
آیا کامپ (COMP) آماده جهش بزرگ است؟ استراتژی ورود مطمئن برای سرمایهگذاران
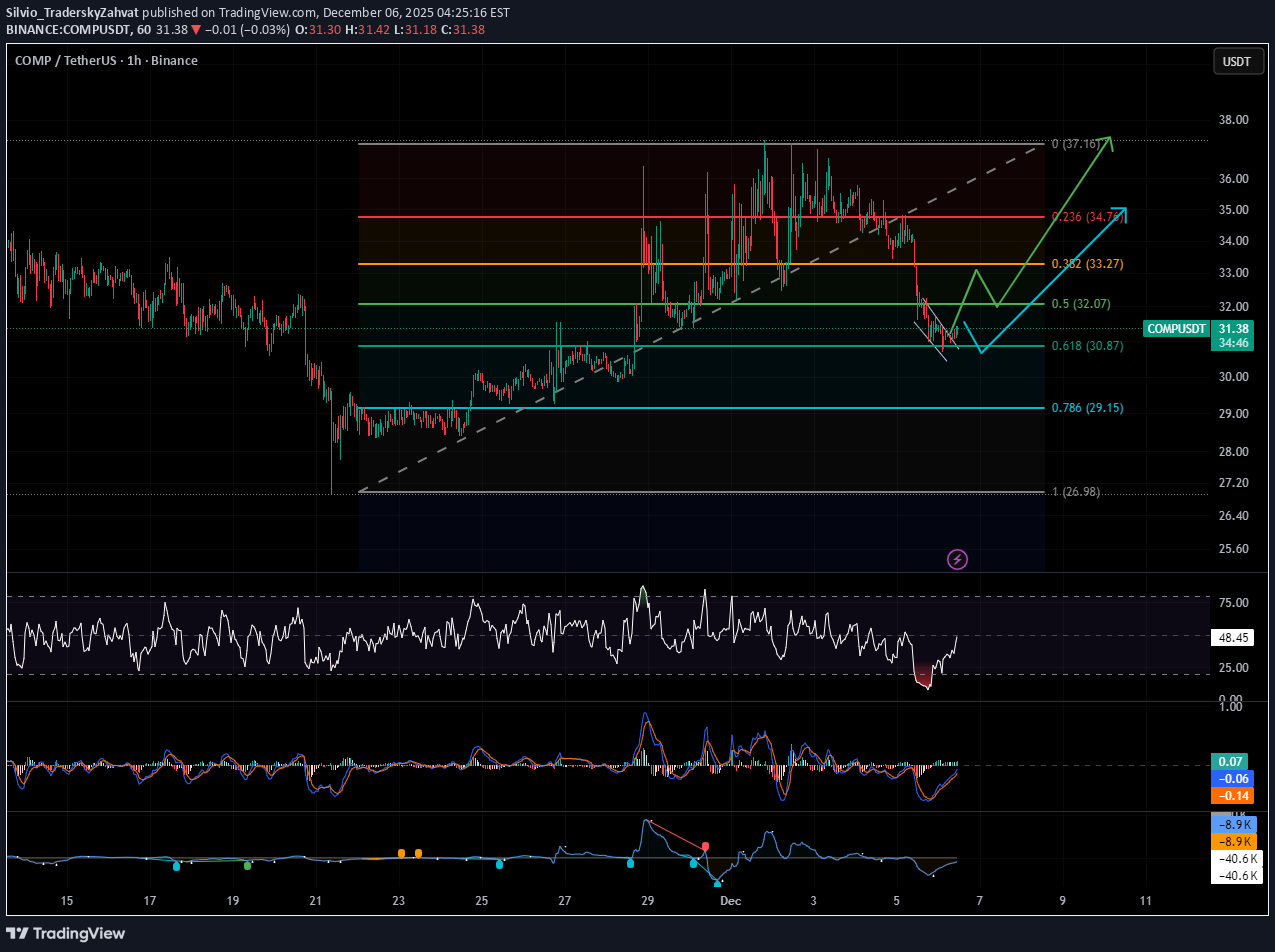
COMP is developing bullish divergences on the 1H TF. However, a safer approach is to wait for a confirmed breakout and close above the 0.5 Fib zone, followed by an entry with a properly placed stop

tradecitypro
سیگنال خرید بزرگ COMP در TradeCityPro: آیا زمان ورود به بازار فرارسیده است؟
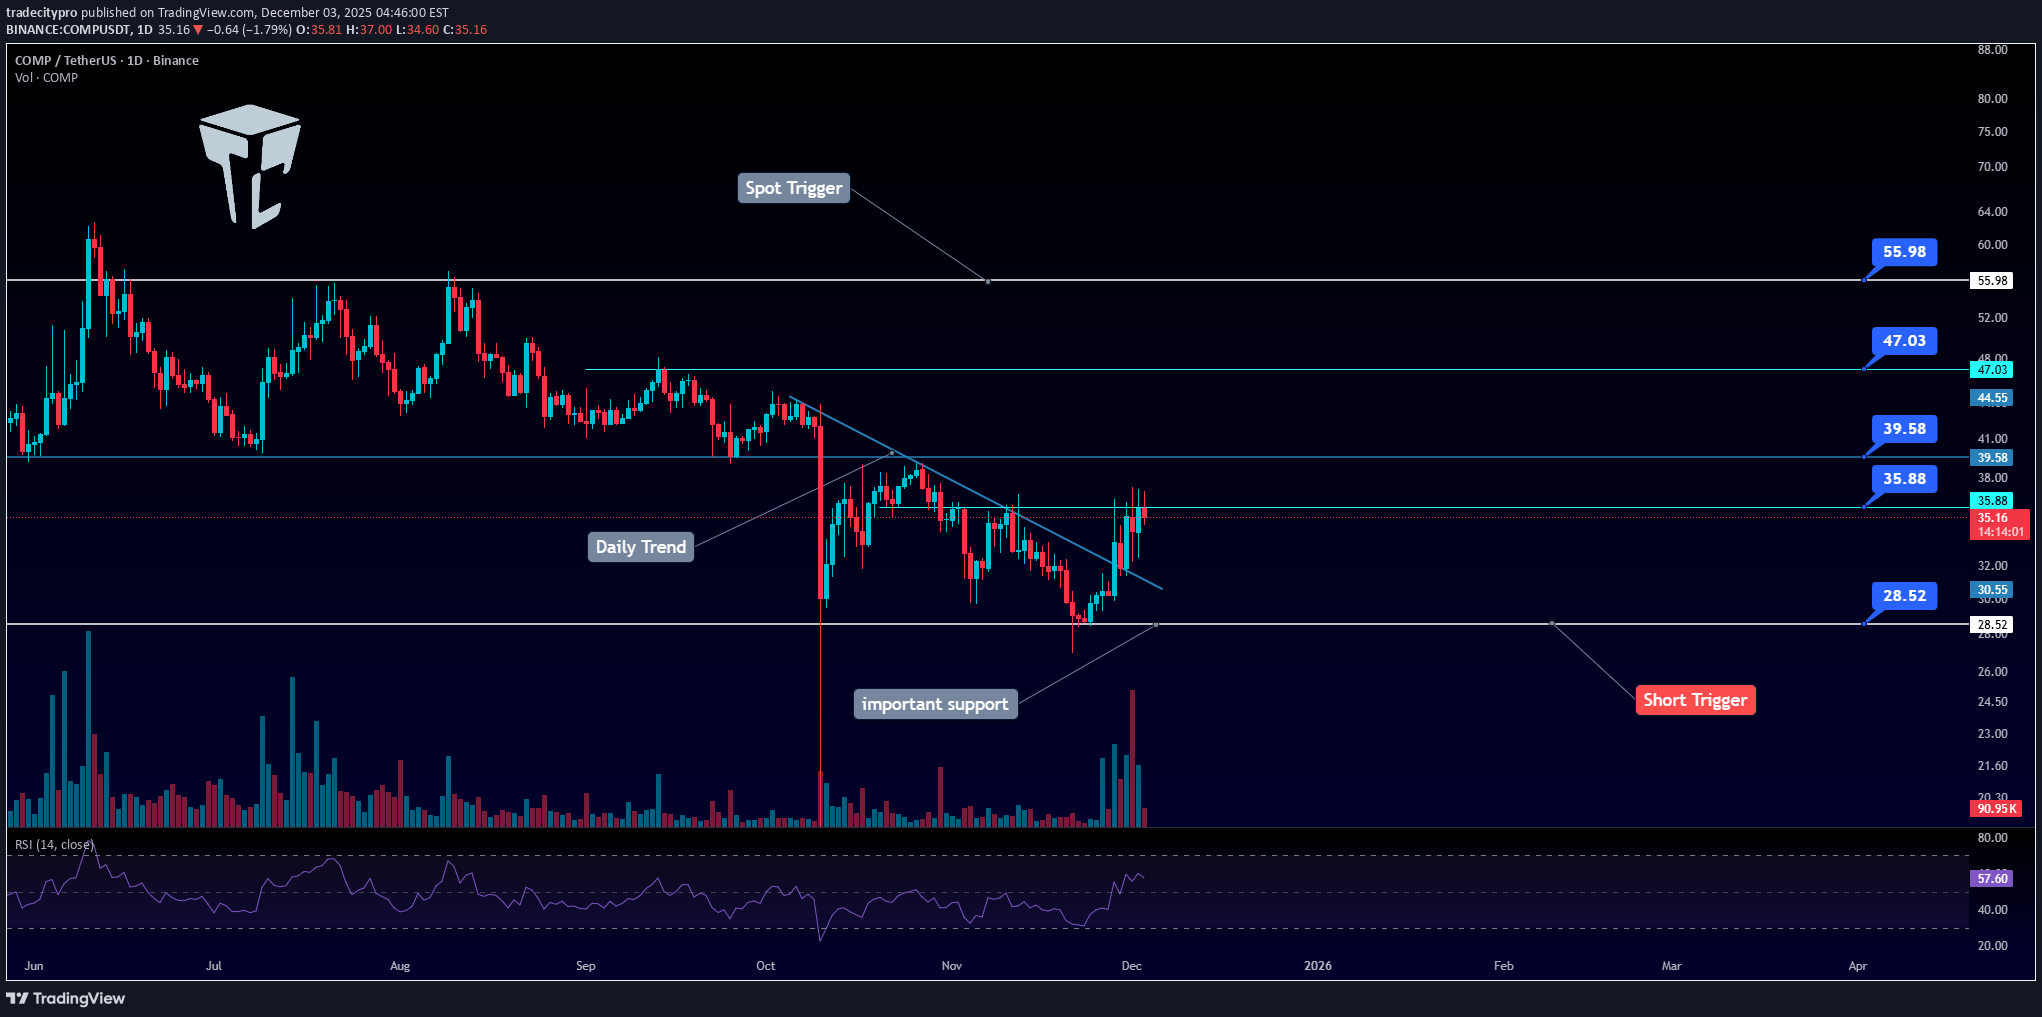
👋 Welcome to TradeCityPro! Let’s dive into the analysis of COMP, one of the active DeFi tokens that has recently been seeing a noticeable increase in its 24-hour trading volume — making it worth paying attention to. 🌐 Bitcoin Overview Before we begin, let me remind you once again that at your request, we’ve moved the Bitcoin analysis section to a dedicated daily report — allowing us to analyze Bitcoin’s trend, dominance, and overall market sentiment in greater depth each day. On the daily timeframe, after the sharp decline that broke $39.58, the price dropped toward the major support at $28.52. Price was supported from that level, and despite several attempts to break below it, the zone held strong — leading to a bounce and eventually a breakout of the daily trendline. Currently, price is sitting just below the trendline trigger. Since this trendline break is part of a reversal structure, we still need confirmation. A break above $39.58 would provide a clear long trigger and open the way for bullish continuation. However, if you have entered a position anywhere within this range, it’s best to place your stop-loss below the $28.52 support zone, and manage your risk accordingly. 📝 Final Thoughts Stay calm, trade wisely, and let's capture the market's best opportunities! This analysis reflects our opinions and is not financial advice. Share your thoughts in the comments, and don’t forget to share this analysis with your friends! ❤️

minno91
آیا کامپ (COMPUSDT) در راه جهش است؟ راز مقاومت این ارز دیجیتال!
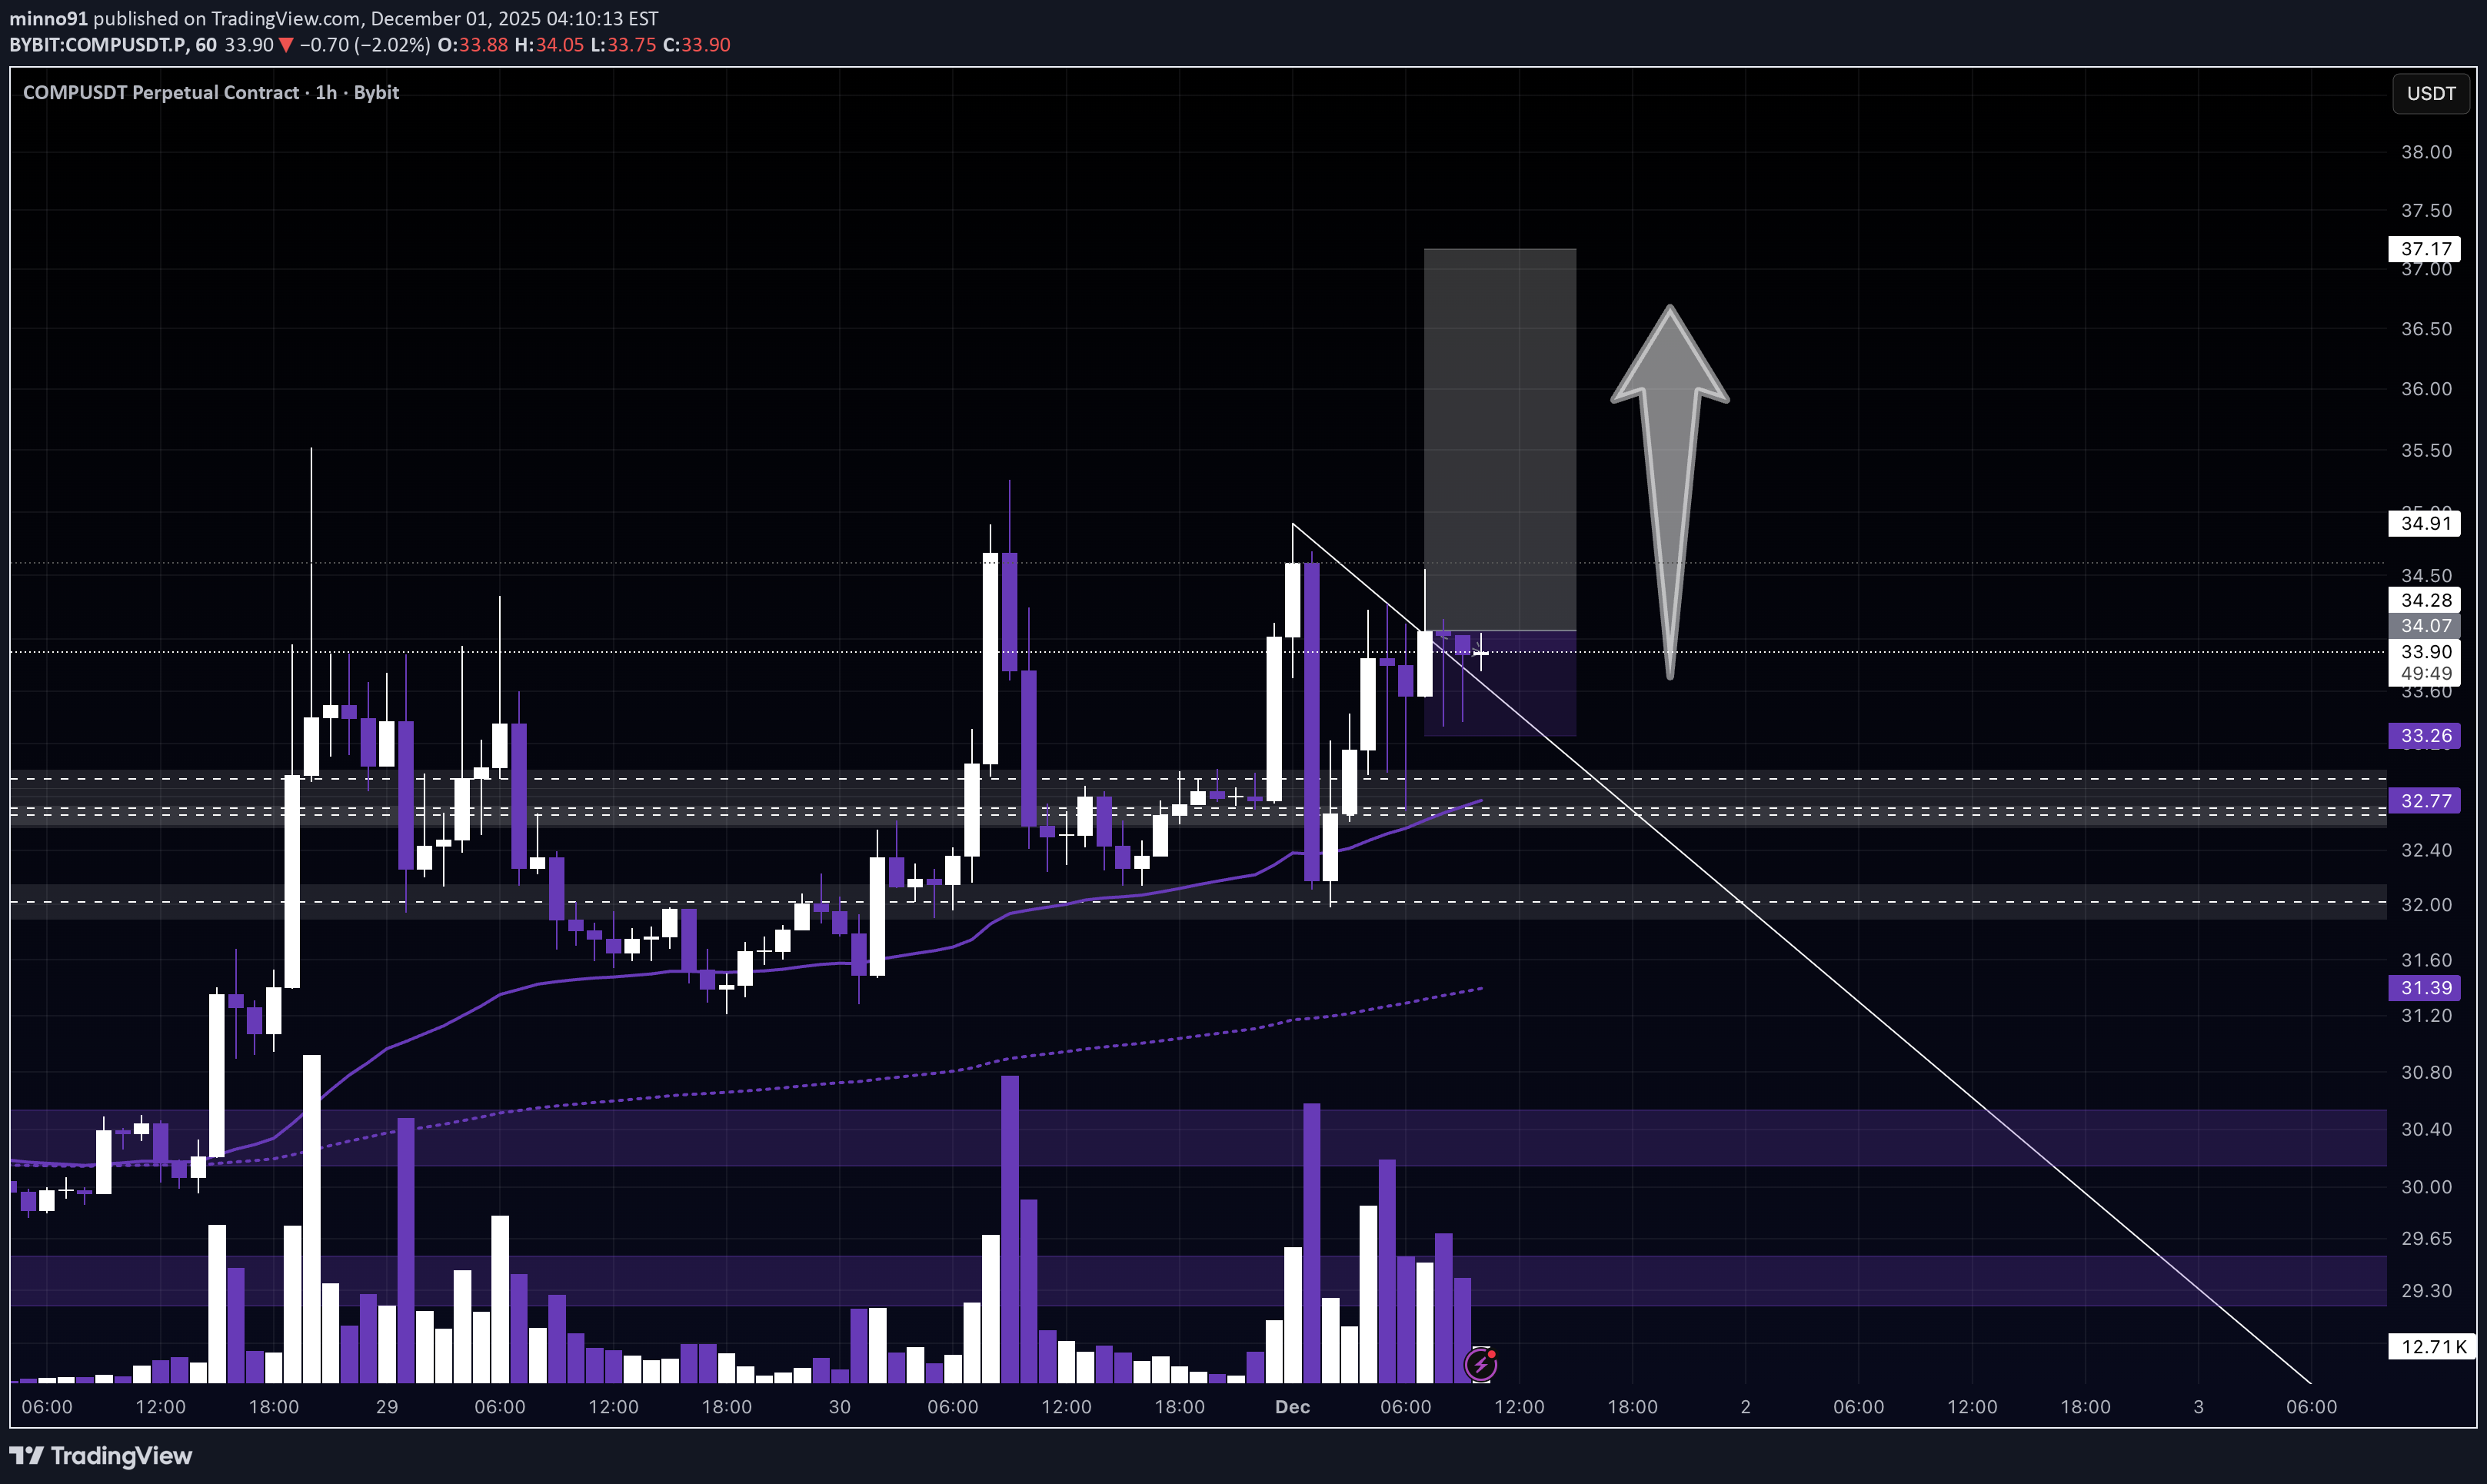
Alright guys, we had a major liquidation party this morning — half the market got slapped, carpets pulled, stop-losses harvested… the usual crypto breakfast. But COMPUSDT? This thing is holding like a champion. Barely flinched. Didn’t panic. Didn’t cry. Just stood there like: “Is that all you got?” What do I expect? A potential Bitcoin bounce today, and if BTC decides to stop being dramatic for 5 minutes, COMPUSDT could easily catch a nice follow-up pump. BUT — (there’s always a ‘but’ in crypto) We never know for sure. Ever. So the only thing 100% guaranteed today is: 👉 Risk management ON POINT. 👉 Keep your capital safe. 👉 Don’t get caught in another round of liquidation Olympics. 😄 Good luck traders, stay safe and may COMP behave better than the rest of the market today! 🚀💜PUMP came - moving my SL to BEBE

FortuneAI
کامپ (COMP) آماده بازگشت قدرتمند؛ تحلیل تکنیکال صعودی و شانسهای بزرگ پیش رو!
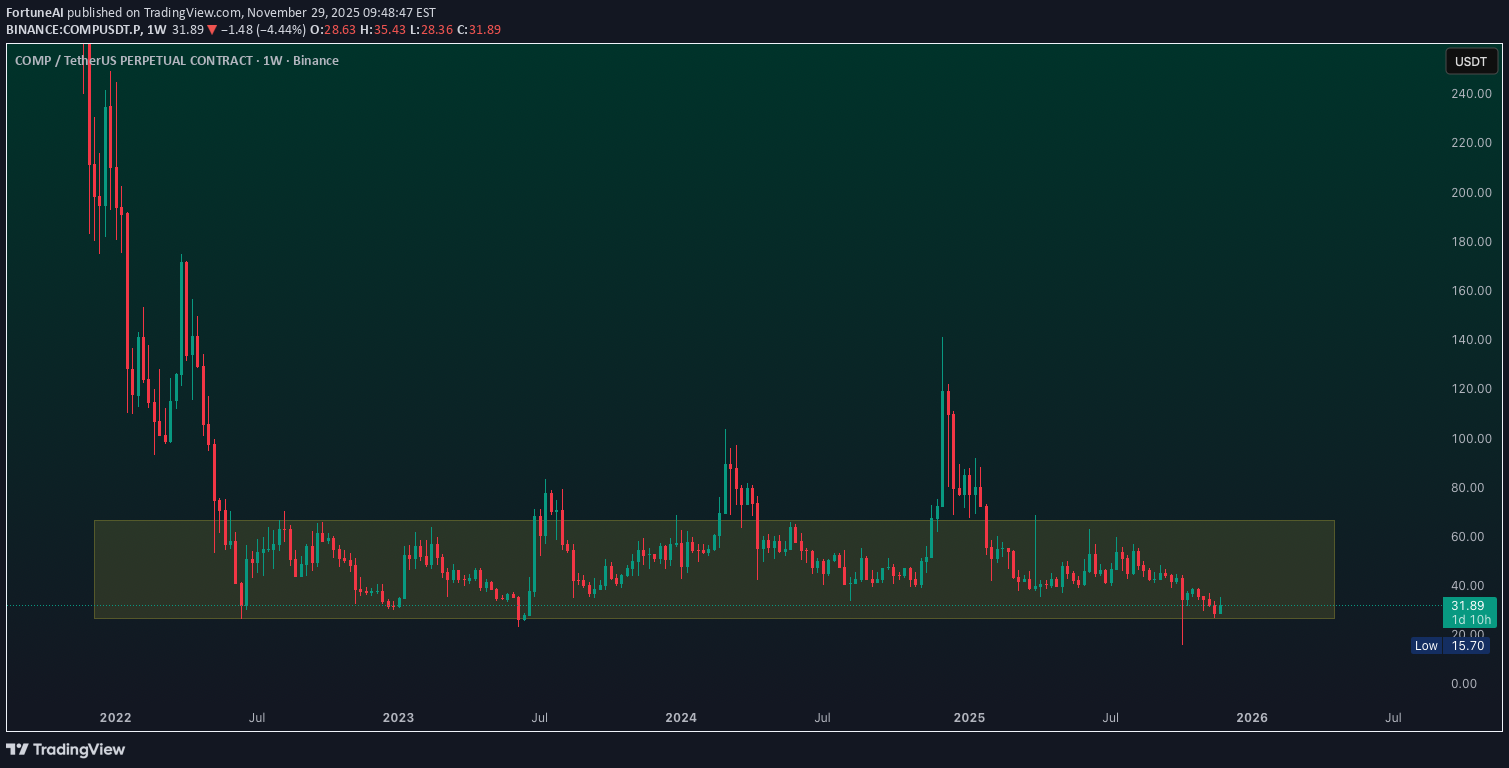
COMP showing strong Bullish Technicals after years of Accumulation on HTF. COMP’s fixed 10M supply (9.67M circulating) leaves limited new emissions. COMP’s price hinges on executing growth initiatives (RWA adoption, emission reforms) while navigating institutional sell pressure. While not a direct catalyst, COMP benefits from narrative-driven flows into governance tokens perceived as undervalued. Use Proper Risk ManagementCOMP LOOKS STRONGER THAN WHOLE MARKET

Bithereum_io
تحلیل تکنیکال COMP: آیا کف قیمت برای خرید نزدیک است؟ اهداف صعودی جذاب تا ۶۲ دلار!
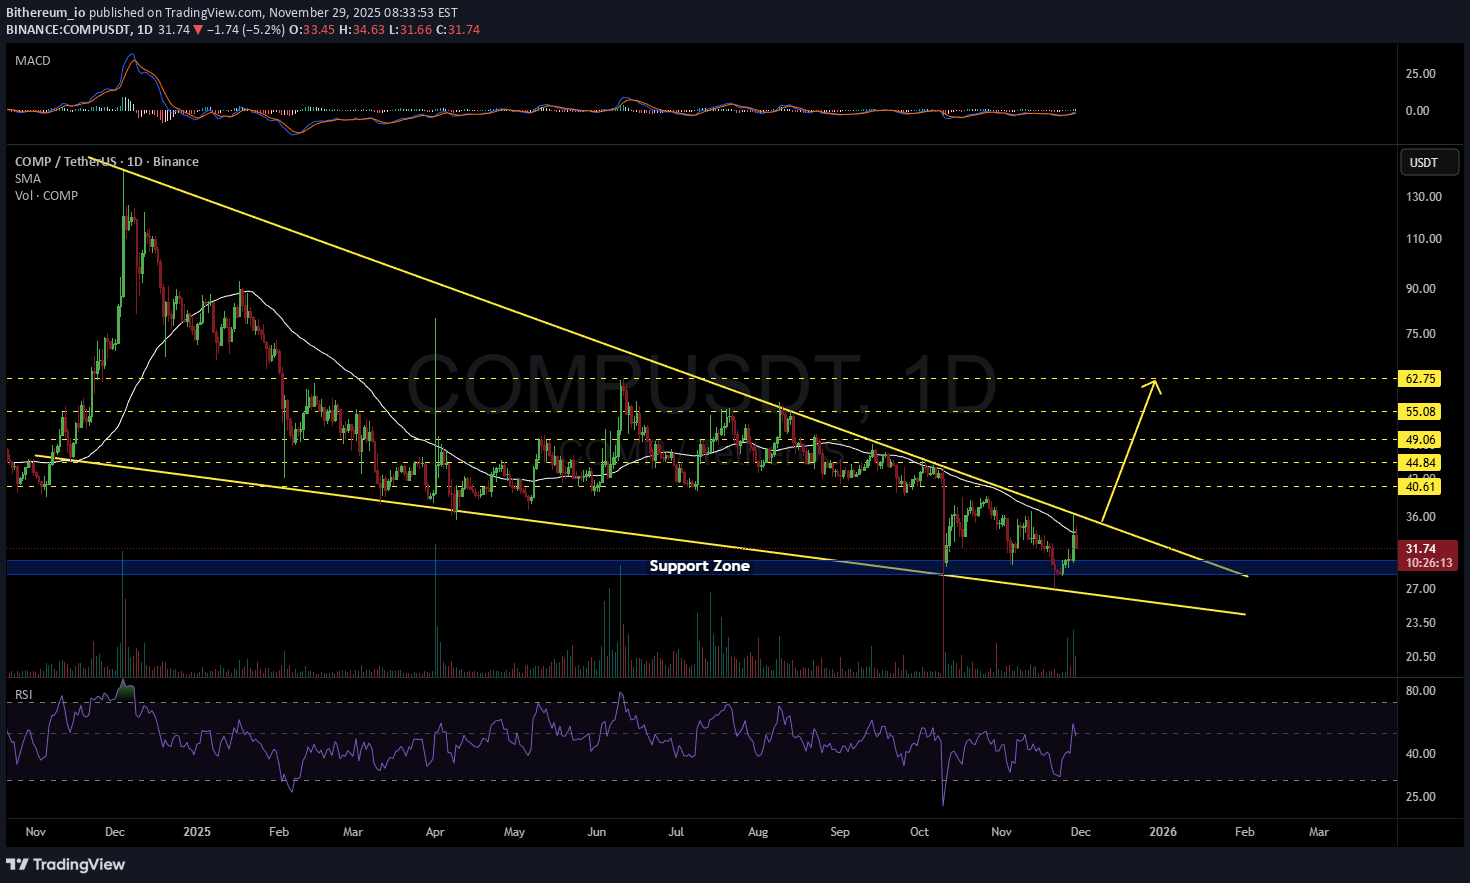
#COMP is moving inside a falling wedge pattern on the daily chart. Its first breakout attempt was rejected at the wedge resistance, and the second attempt was rejected at the daily SMA50. Consider buying a small bag near the support zone. If price breaks above both the wedge resistance and the SMA50, the potential upside targets are: 🎯 $40.61 🎯 $44.84 🎯 $49.06 🎯 $55.08 🎯 $62.75 ❌ Invalidation: a daily candle closing below the wedge support. ⚠️ Always remember to use a tight stop-loss and maintain proper risk management.
wolffxtrader
صعود بزرگ در راه است: زمان خرید در اصلاح قیمت فرا رسید!
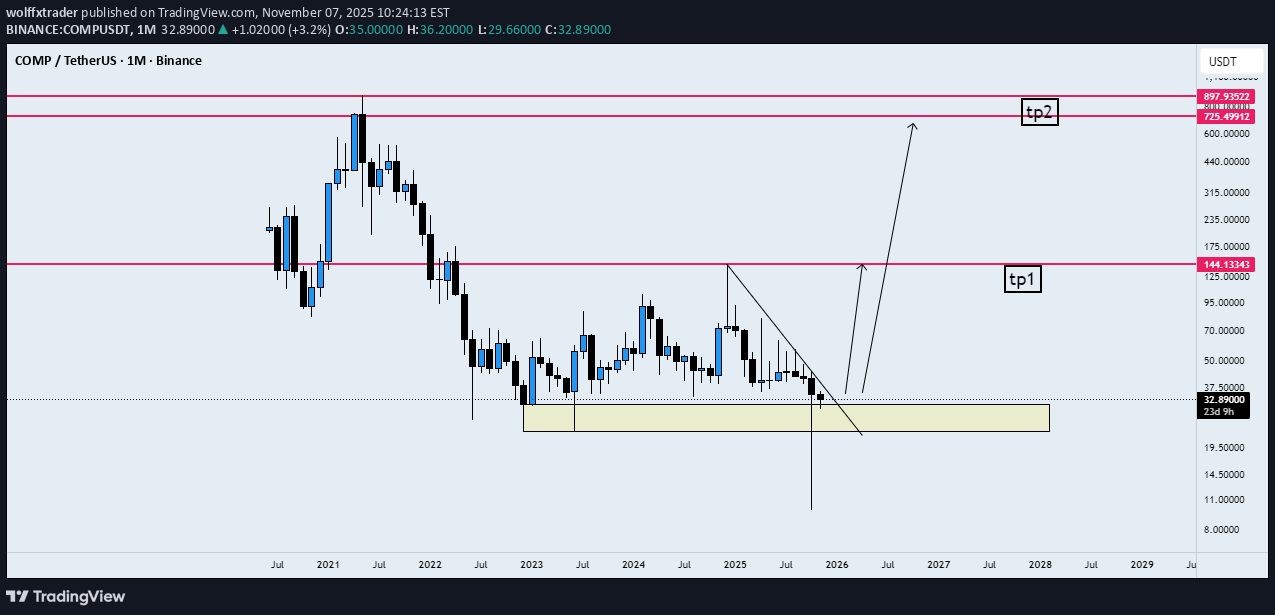
hello traders how are you today? as you can see price started a huge spike and i think bulls are coming back and i want to buy at the correction be safe enjoy.
Disclaimer
Any content and materials included in Sahmeto's website and official communication channels are a compilation of personal opinions and analyses and are not binding. They do not constitute any recommendation for buying, selling, entering or exiting the stock market and cryptocurrency market. Also, all news and analyses included in the website and channels are merely republished information from official and unofficial domestic and foreign sources, and it is obvious that users of the said content are responsible for following up and ensuring the authenticity and accuracy of the materials. Therefore, while disclaiming responsibility, it is declared that the responsibility for any decision-making, action, and potential profit and loss in the capital market and cryptocurrency market lies with the trader.