
BMT
Bubblemaps
| تریدر | نوع سیگنال | حد سود/ضرر | زمان انتشار | مشاهده پیام |
|---|---|---|---|---|
خرید | حد سود: تعیین نشده حد ضرر: تعیین نشده | 11/23/2025 |
Price Chart of Bubblemaps
سود 3 Months :
سیگنالهای Bubblemaps
Filter
Sort messages by
Trader Type
Time Frame

Strateg_
BMT: راز رشد 400 درصدی و تحلیل تکنیکال کلیدی قیمت!
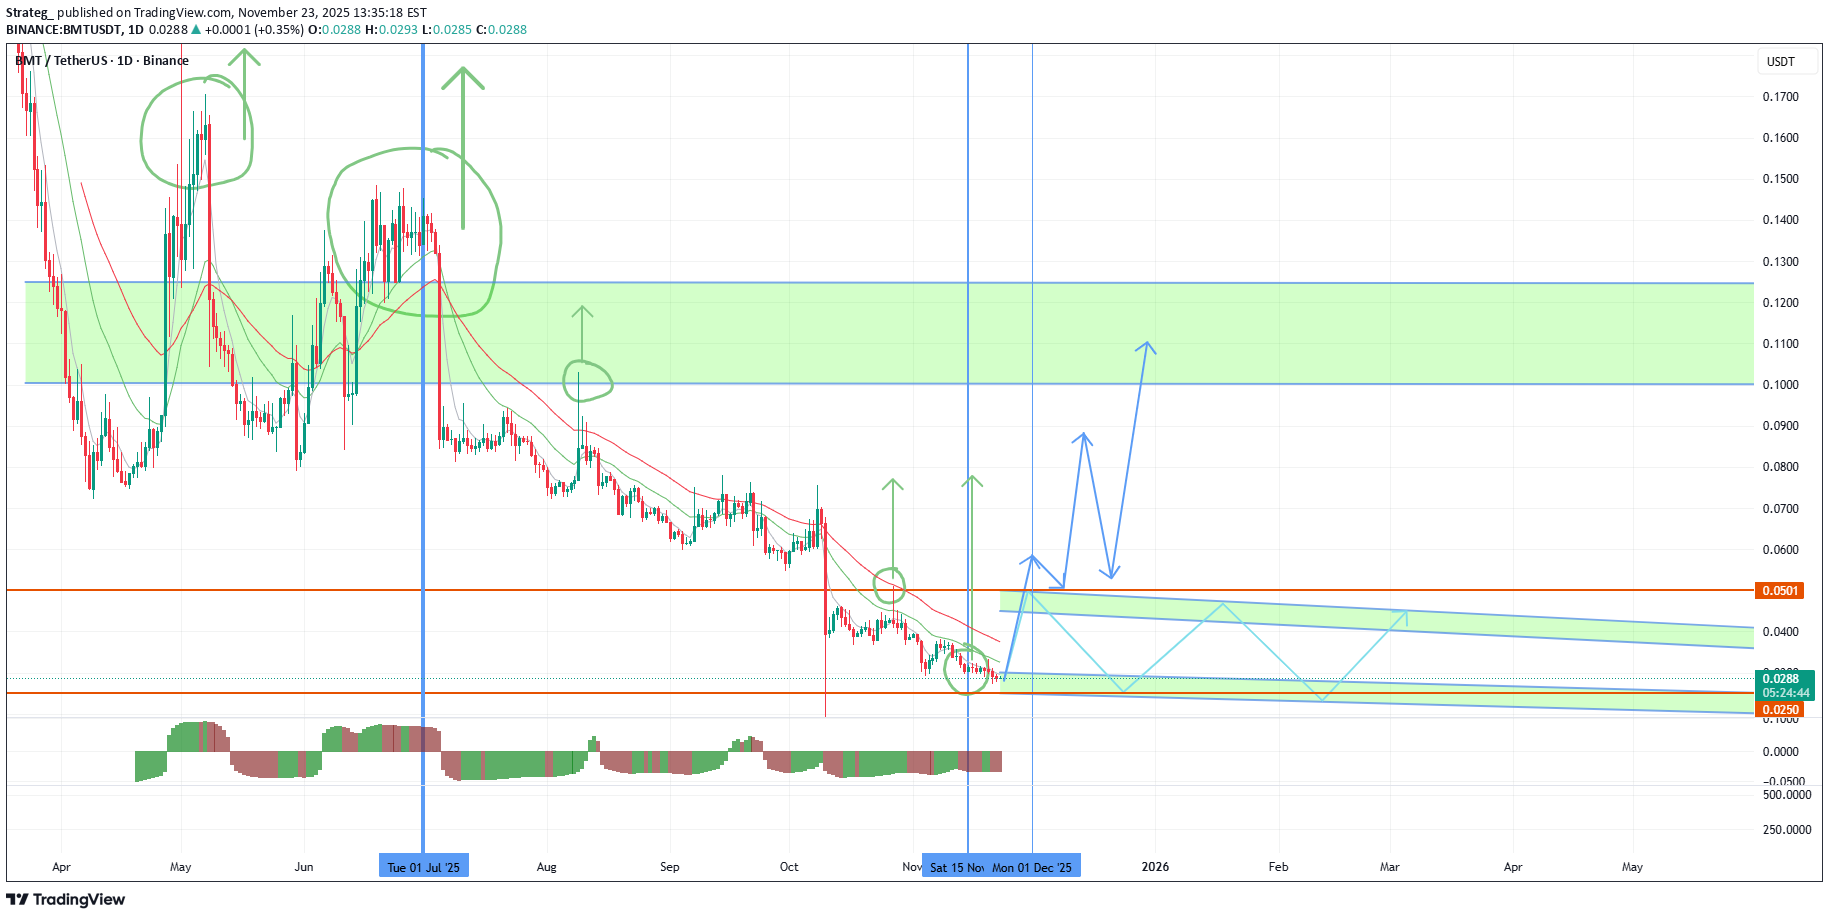
In this review, I will consider in detail the BMT, which I previously took into account. First of all, it is worth noting the issue of this token. At the moment, 50% of tokens have already been unlocked and further issuance is slowing down, which will not put significant pressure on the price. For the next year, the 0.0250 level will remain the main support from which attempts will be made to gain a foothold above 0.05. A very important signal is the opening of the half-year above 0.125, which may lead to a sharp reversal of the half-year candle up to this level. If low volatility persists, the range of 0.100-125 will remain a medium-term target for retest and will be worked out, but with a possible pullback. On a smaller scale, the second half of the quarter opened above 0.0250, which is a signal for a test of 0.050-75. As a result, there is a fairly high probability of an attempt to close the current monthly candle above 0.05, with the trend continuing in the new month. After a local break in the 0.075-90 region, there is a high probability of a rollback to a 0.05 retest followed by an attempt to resume growth. TURTLE MITO VIC NTRN ENSO CHESS HOOK has a similar growth potential today.

BandForBands
صعود انفجاری BMT: هدف ۲۶۰٪ در انتظار این الگوی قیمتی!
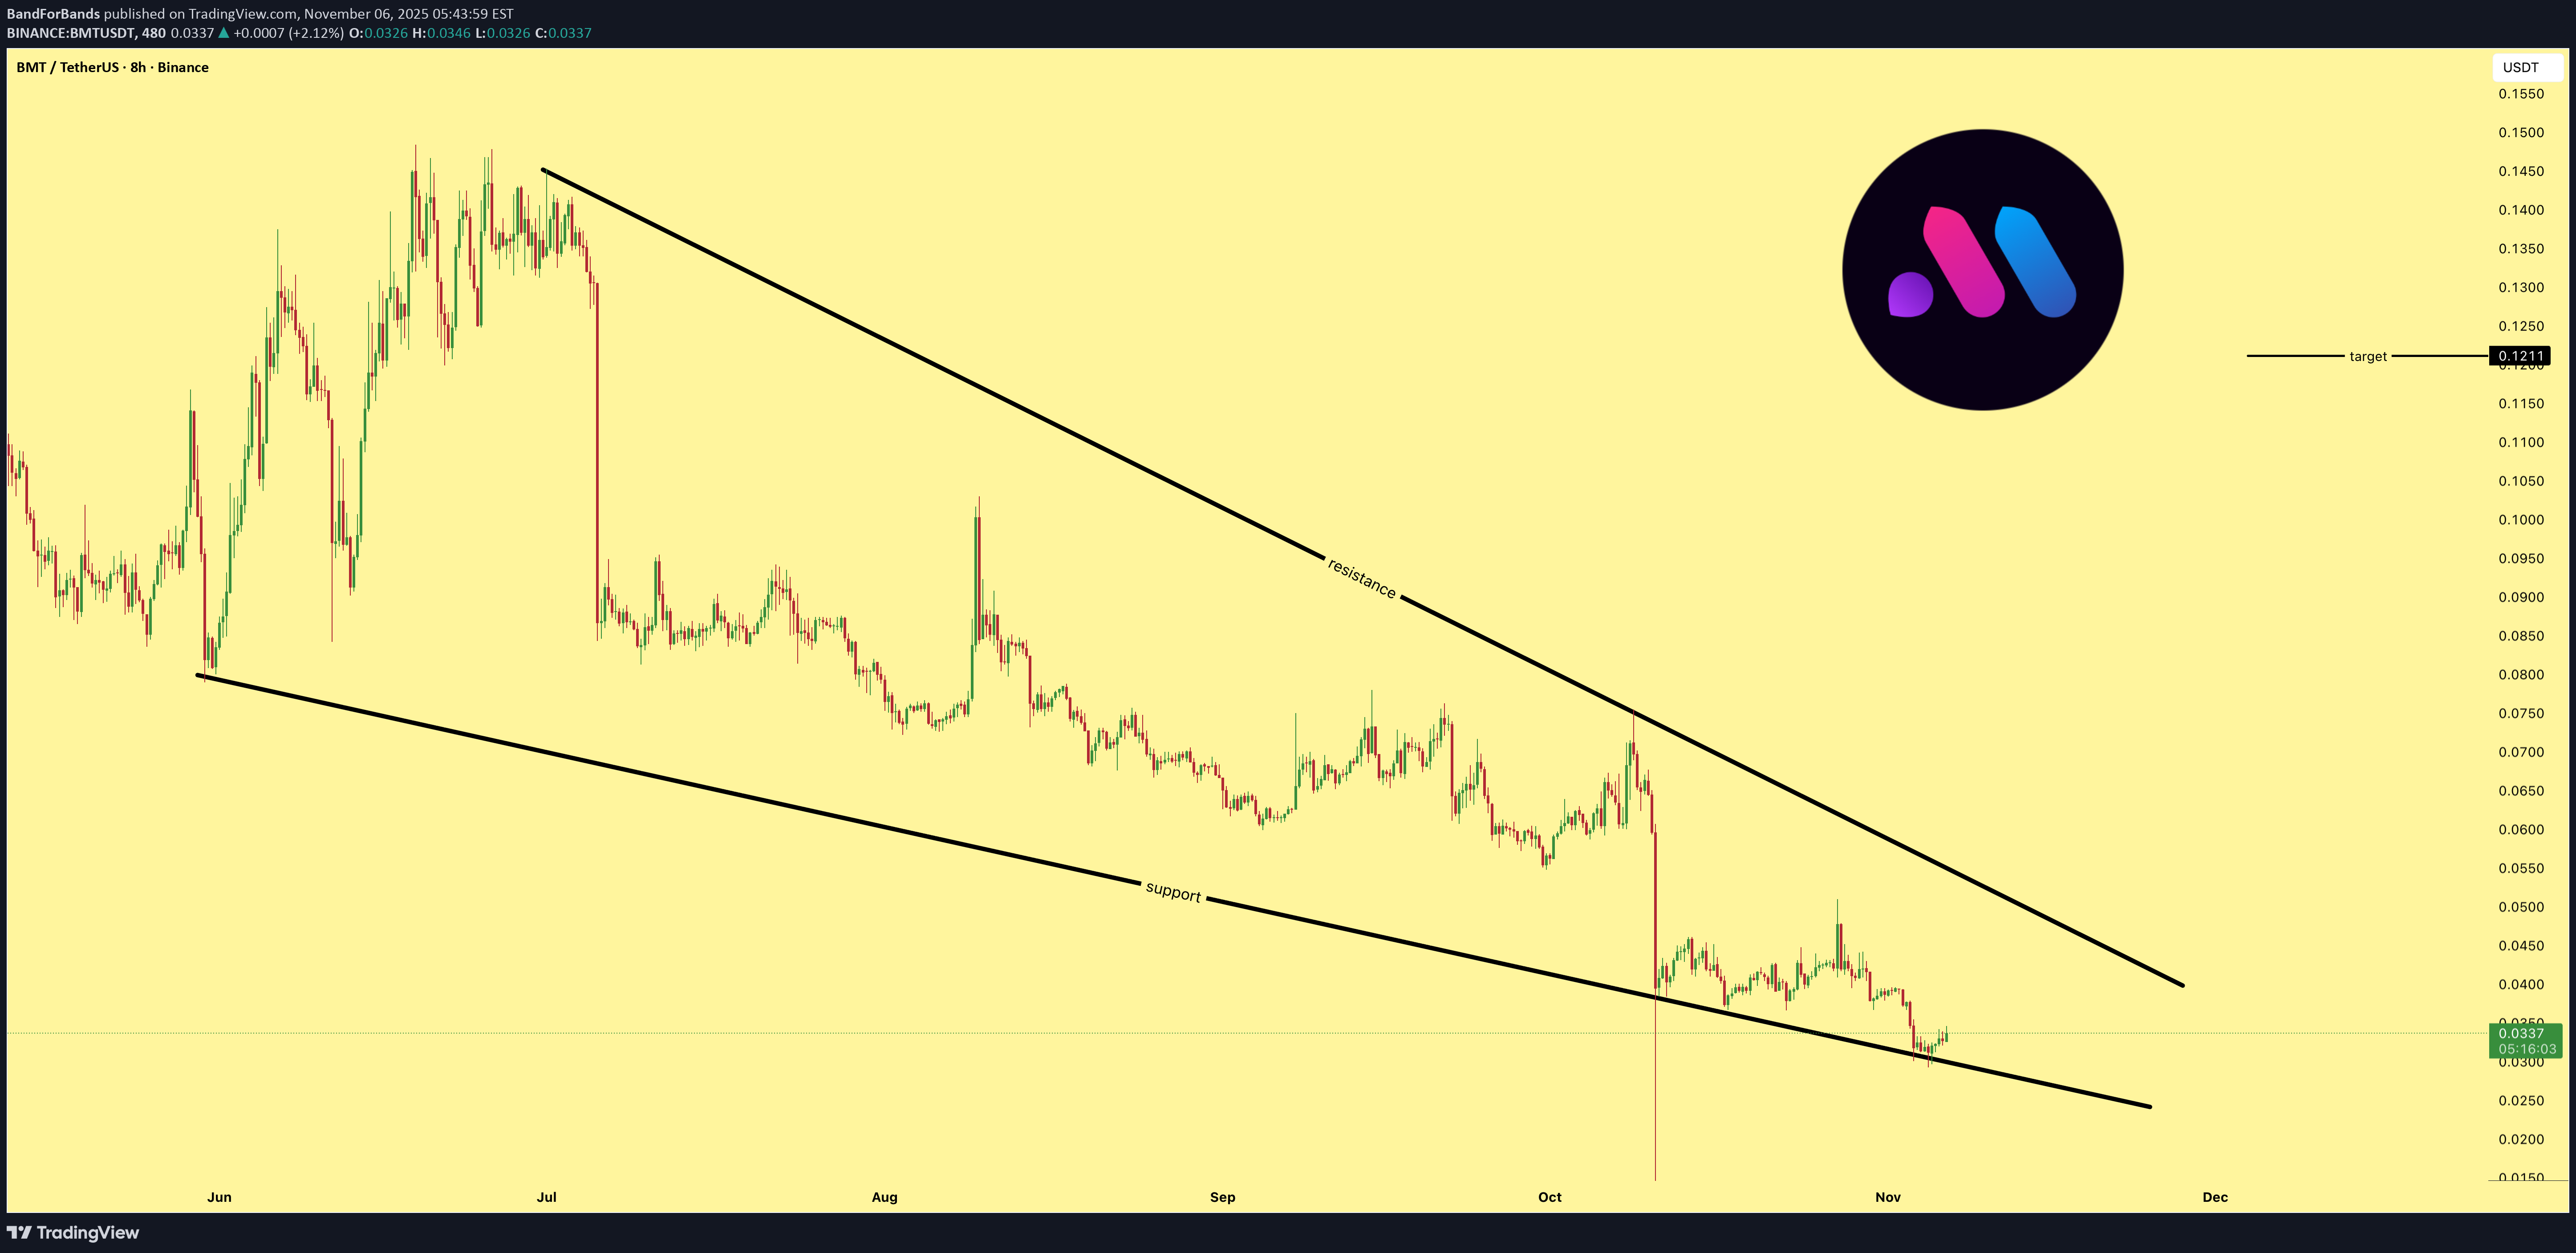
BMT is reacting perfectly from the support of its descending wedge pattern. The chart structure remains clean with momentum turning upward. The potential target is around 260% above current levels, making this a strong continuation setup as long as support holds firm.
BandForBands
200% سود در راه است؟ تحلیل تکنیکال شگفتانگیز BMT و نقطه ورود انفجاری!
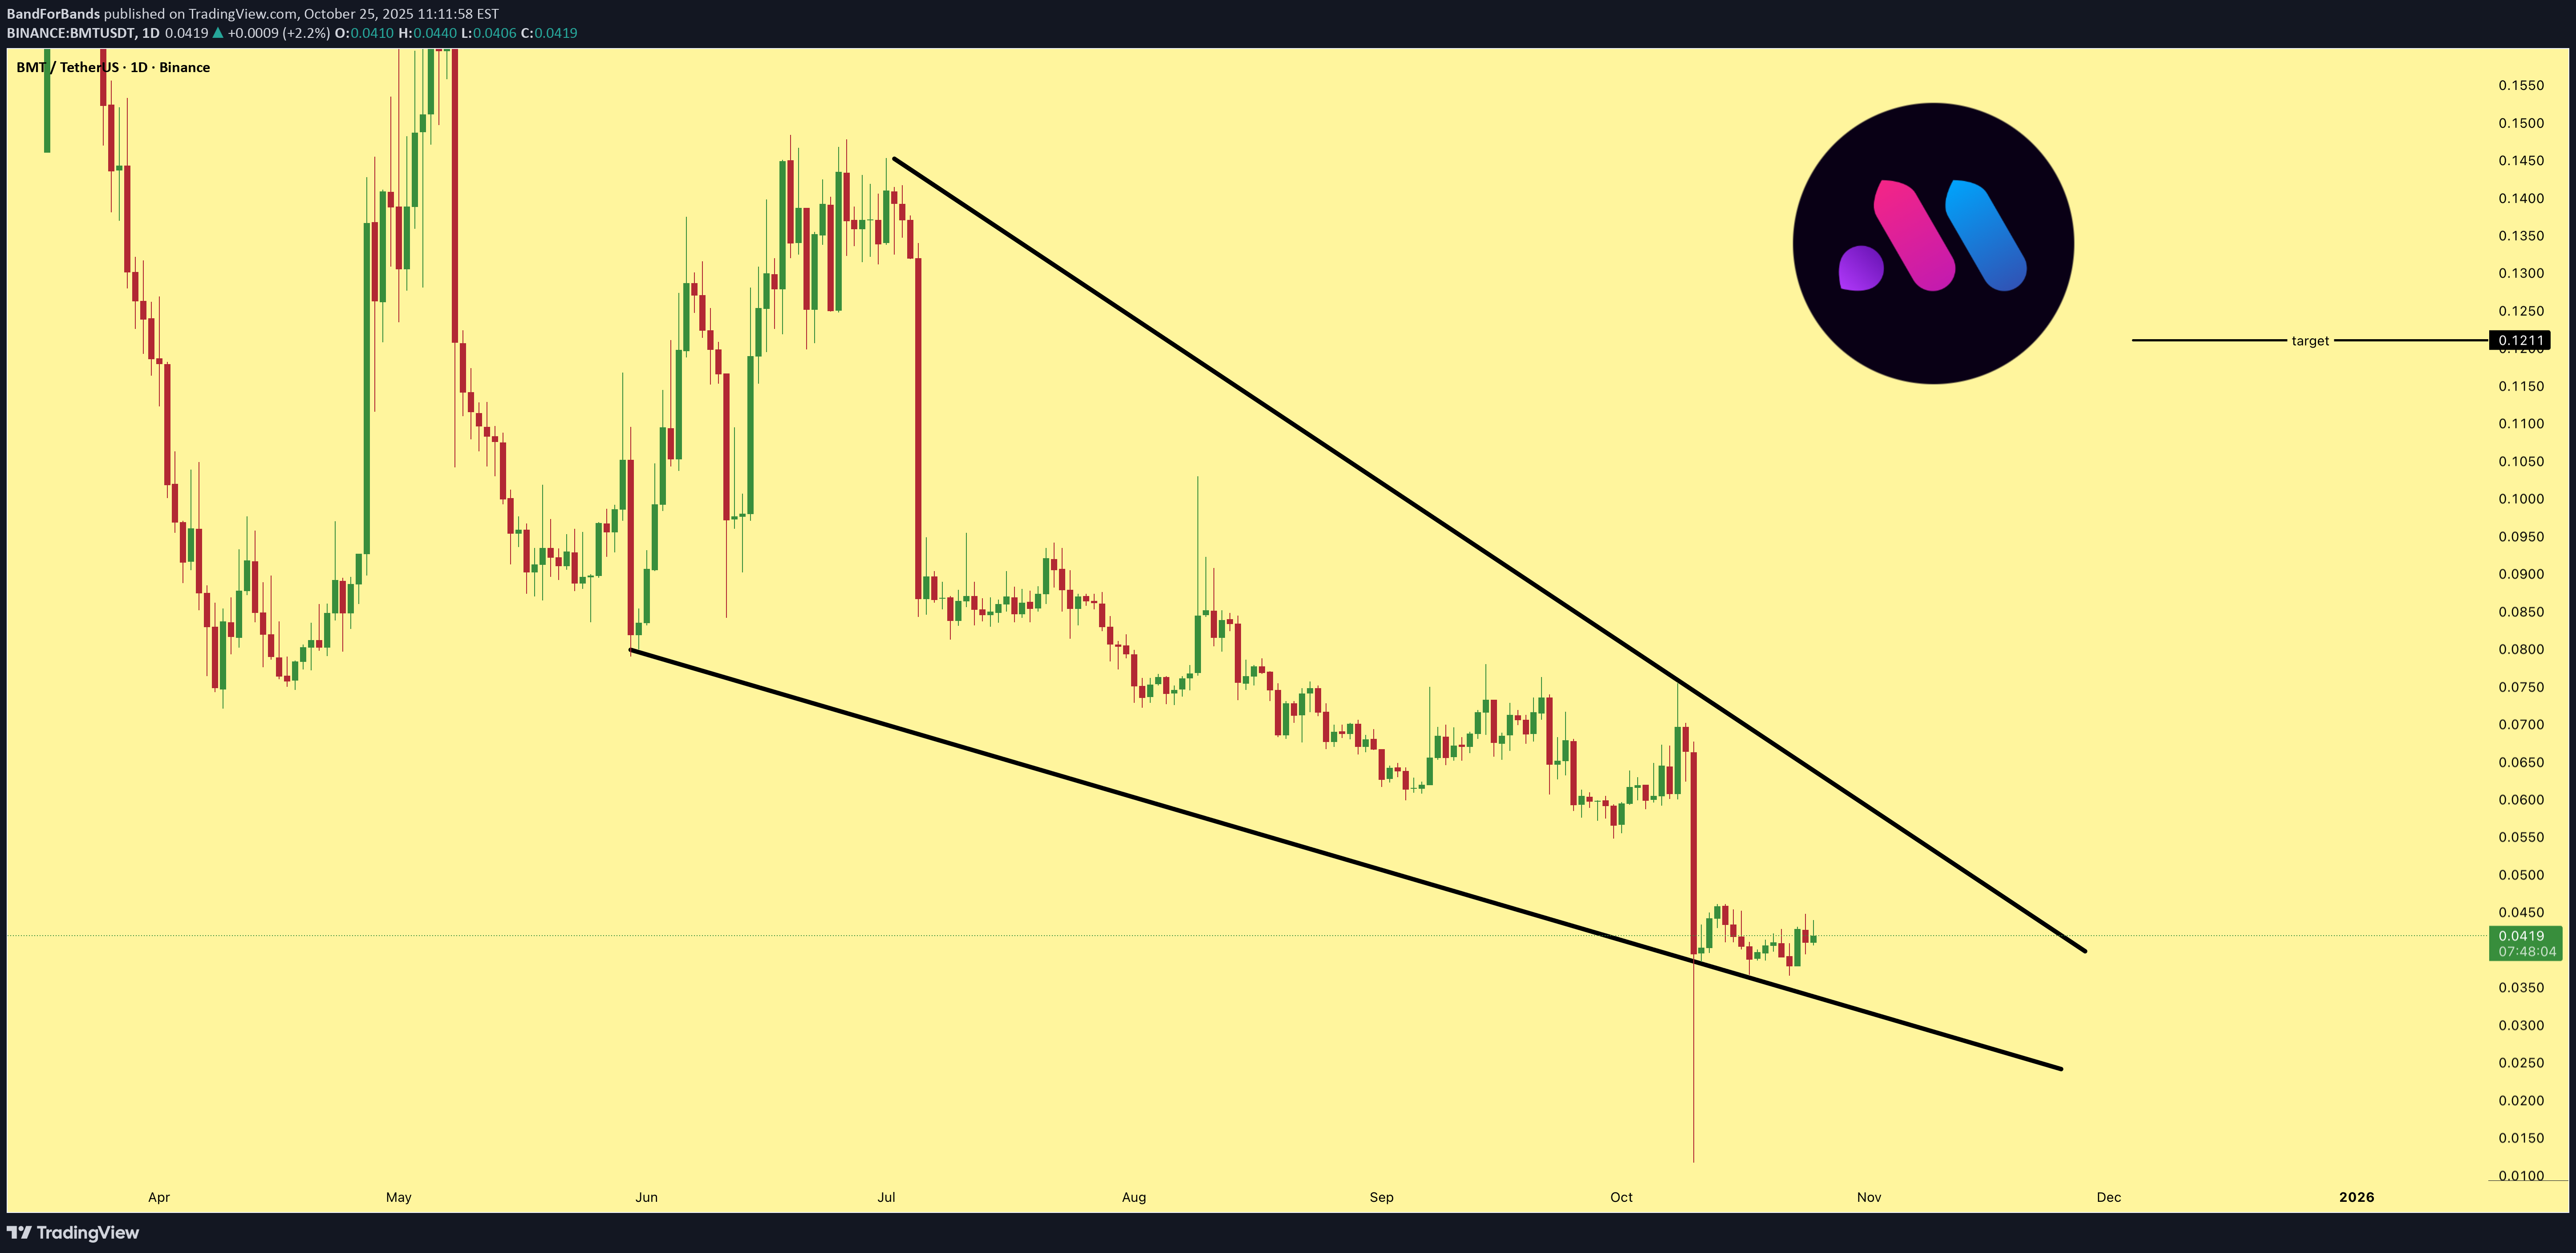
BMT is a solid and relatively new project with tech that’s already seeing strong adoption. The chart shows a clean descending wedge pattern forming, signaling potential reversal. From the current price, the setup offers around 200% upside if the breakout confirms.

Bithereum_io
فرصت انفجاری BMT: آماده شکستن مقاومت و هدفگذاری قیمتهای جدید!

#BMT is trading within a falling wedge pattern on the daily chart and is currently on the verge of breaking out above the wedge resistance and the daily SMA50. If that happens, the potential targets are: 🎯 $0.0775 🎯 $0.0904 🎯 $0.1008 🎯 $0.1112 🎯 $0.1261 🎯 $0.1450 ⚠️ Always remember to use a tight stop-loss and maintain proper risk management.

CryptoNuclear
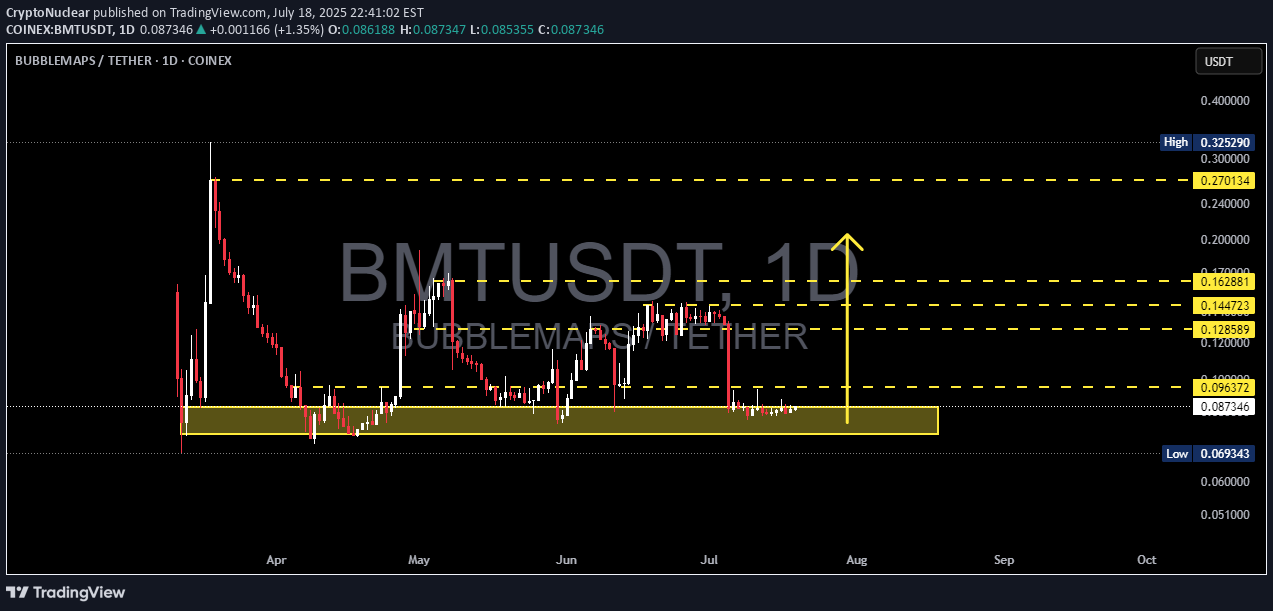
BMT/USDT – Major Rebound Potential from Accumulation Zone?
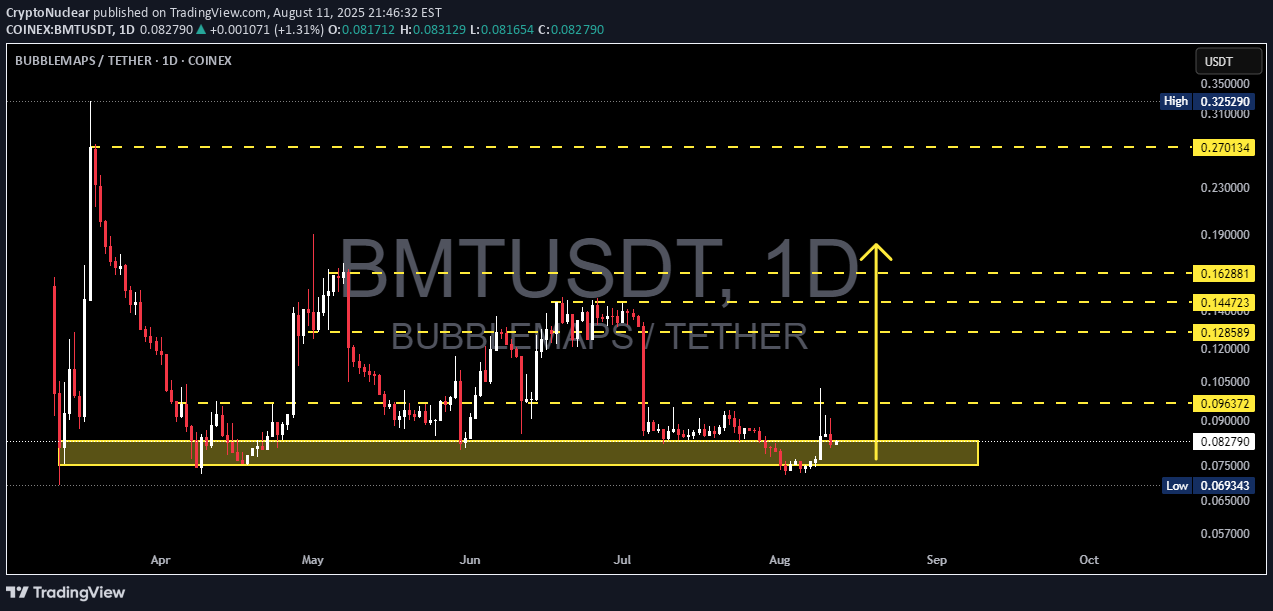
🔍 Overview BMT/USDT is currently trading at a critical support zone after a prolonged downtrend from the local peak at 0.32529. The 0.075 – 0.083 range, highlighted in yellow, has acted as a strong price defense area from March to August 2025. The structure indicates a potential reversal pattern if the price can break above key resistance levels. --- 📈 Pattern & Technical Structure Main Pattern: Potential Double Bottom or Accumulation Base on the daily chart. Key Support: Accumulation zone: 0.07500 – 0.08277 Final support: 0.06934 (lowest price of the year) Layered Resistance Levels: R1: 0.09637 → First psychological resistance R2: 0.12859 → Short-term profit-taking area R3: 0.14472 → Mid-term resistance R4: 0.16288 → Major resistance before a strong rally R5: 0.27013 → Long-term bullish target --- 🚀 Bullish Scenario If the price breaks and sustains above 0.09637 with significant volume: Short-term target: 0.12859 (+55% from current price) Mid-term target: 0.14472 – 0.16288 (+74% to +96%) Long-term major breakout target: 0.27013 (+226%) Additional Confirmation: RSI climbs above 50 and continues to strengthen MACD forms a golden cross Gradual increase in buying volume --- ⚠️ Bearish Scenario If the price fails to hold above 0.075 and breaks 0.06934: Potential downside targets: S1: 0.06500 (-21%) S2: 0.05700 (-31%) Additional Confirmation: Surge in selling volume Daily candlestick closes below 0.06934 RSI breakdown below 40 --- 🎯 Strategy & Risk Management Buy at Support Strategy: Entry at 0.082 – 0.083, SL below 0.06934, Target 0.12859 → Risk:Reward ± 3.4 Breakout Buy Strategy: Entry after daily close above 0.09637, SL below 0.082, Target 0.14472 → Risk:Reward ± 2.24 --- 📌 Conclusion BMT/USDT is at a make-or-break zone: a successful breakout could trigger a strong rally, while a breakdown would extend the bearish trend. This is a decision point for swing and position traders to monitor closely. #BMTUSDT #CryptoAnalysis #Altcoins #TechnicalAnalysis #PriceAction #Crypto #BreakoutTrading #SupportResistance #CryptoSignal #AltcoinSeason
Bithereum_io
BMTUSDT 1D

#BMT is moving inside a descending triangle on the daily chart. This coin is risky, so if you decide to enter, allocate only a small portion of your capital. It has bounced off the support zone, and for a bullish scenario, it must break above the daily SMA50. If that happens, the potential upside targets are: 🎯 $0.1072 🎯 $0.1179 🎯 $0.1286 🎯 $0.1438 🎯 $0.1632 ⚠️ As always, use a tight stop-loss and apply proper risk management.
CryptoNuclear
BMT/USDT Rebounding from Strong Demand Zone Is a Major Breakout?
🧠 Complete and Insightful Technical Analysis: The daily chart of BMT/USDT reveals a compelling structure for traders looking to capitalize on early-stage reversals and bottom entries. The price is currently consolidating within a strong historical demand zone, ranging between $0.069 – $0.087 USDT — a level that has previously triggered multiple significant rallies (March, May, July 2025). This isn’t just any support zone; it's a classic accumulation area, where bearish momentum appears to be fading and buyers are gradually stepping in. 🔍 Identified Chart Patterns: ✅ Accumulation Range – Sideways movement within the highlighted yellow box suggests a potential base formation. ✅ Double Bottom (W Formation) Potential – A break above resistance would confirm this bullish pattern. ✅ Wyckoff Spring Setup – If a fake breakdown below support occurs followed by a swift recovery, it could signal a powerful trend reversal. 🚀 Bullish Scenario (Reversal in Play): If the price continues to hold above the $0.069 support, it sets the stage for a strong bullish reversal. A confirmed breakout above $0.096 with high volume would validate the bullish thesis. 📈 Upside Targets: TP1: $0.096 USDT – Local resistance TP2: $0.128 USDT – Previous key equilibrium zone TP3: $0.144 - $0.162 USDT – Historical resistance TP4: $0.270 - $0.290 USDT – Major range top This structure provides the potential for a +200% upside move if momentum builds and resistance levels are broken sequentially. ⚠️ Bearish Scenario (Breakdown Risk): If the price fails to hold above the demand zone and closes below $0.069, the bearish outlook takes precedence: The next support sits at $0.063 A breakdown below this may lead to price discovery lower with strong downside pressure 👉 Caution is advised: use tight risk management if trading within this range. 🔑 Key Takeaways: The yellow box is a critical battleground between bulls and bears. Holding this demand zone could ignite a strong breakout. The risk/reward setup is favorable for swing and trend traders. A confirmed breakout could signal the start of a new bullish phase. 📊 Additional Chart Stats: Current Price: ~$0.075 USDT Support Zone: $0.069 - $0.087 Key Resistance Levels: $0.096 / $0.128 / $0.144 / $0.162 / $0.270 Market Structure: Sideways → Accumulation → Breakout Potential #BMTUSDT #CryptoTrading #BreakoutSetup #WyckoffMethod #AltcoinAnalysis #SupportAndResistance #SwingTradeOpportunity #CryptoReversal

CRYPTOMOJO_TA
$BMT is sitting right at the lower support zone!

BMT is sitting right at the lower support zone! Expecting a strong bounce towards the upper resistance if this level holds. I'm entering a long, with SL below the support (confirmed by a candle close). DYOR | NFA

darksignal
BMTUSDT is a time for over 100% jump? Target 0.20 ?
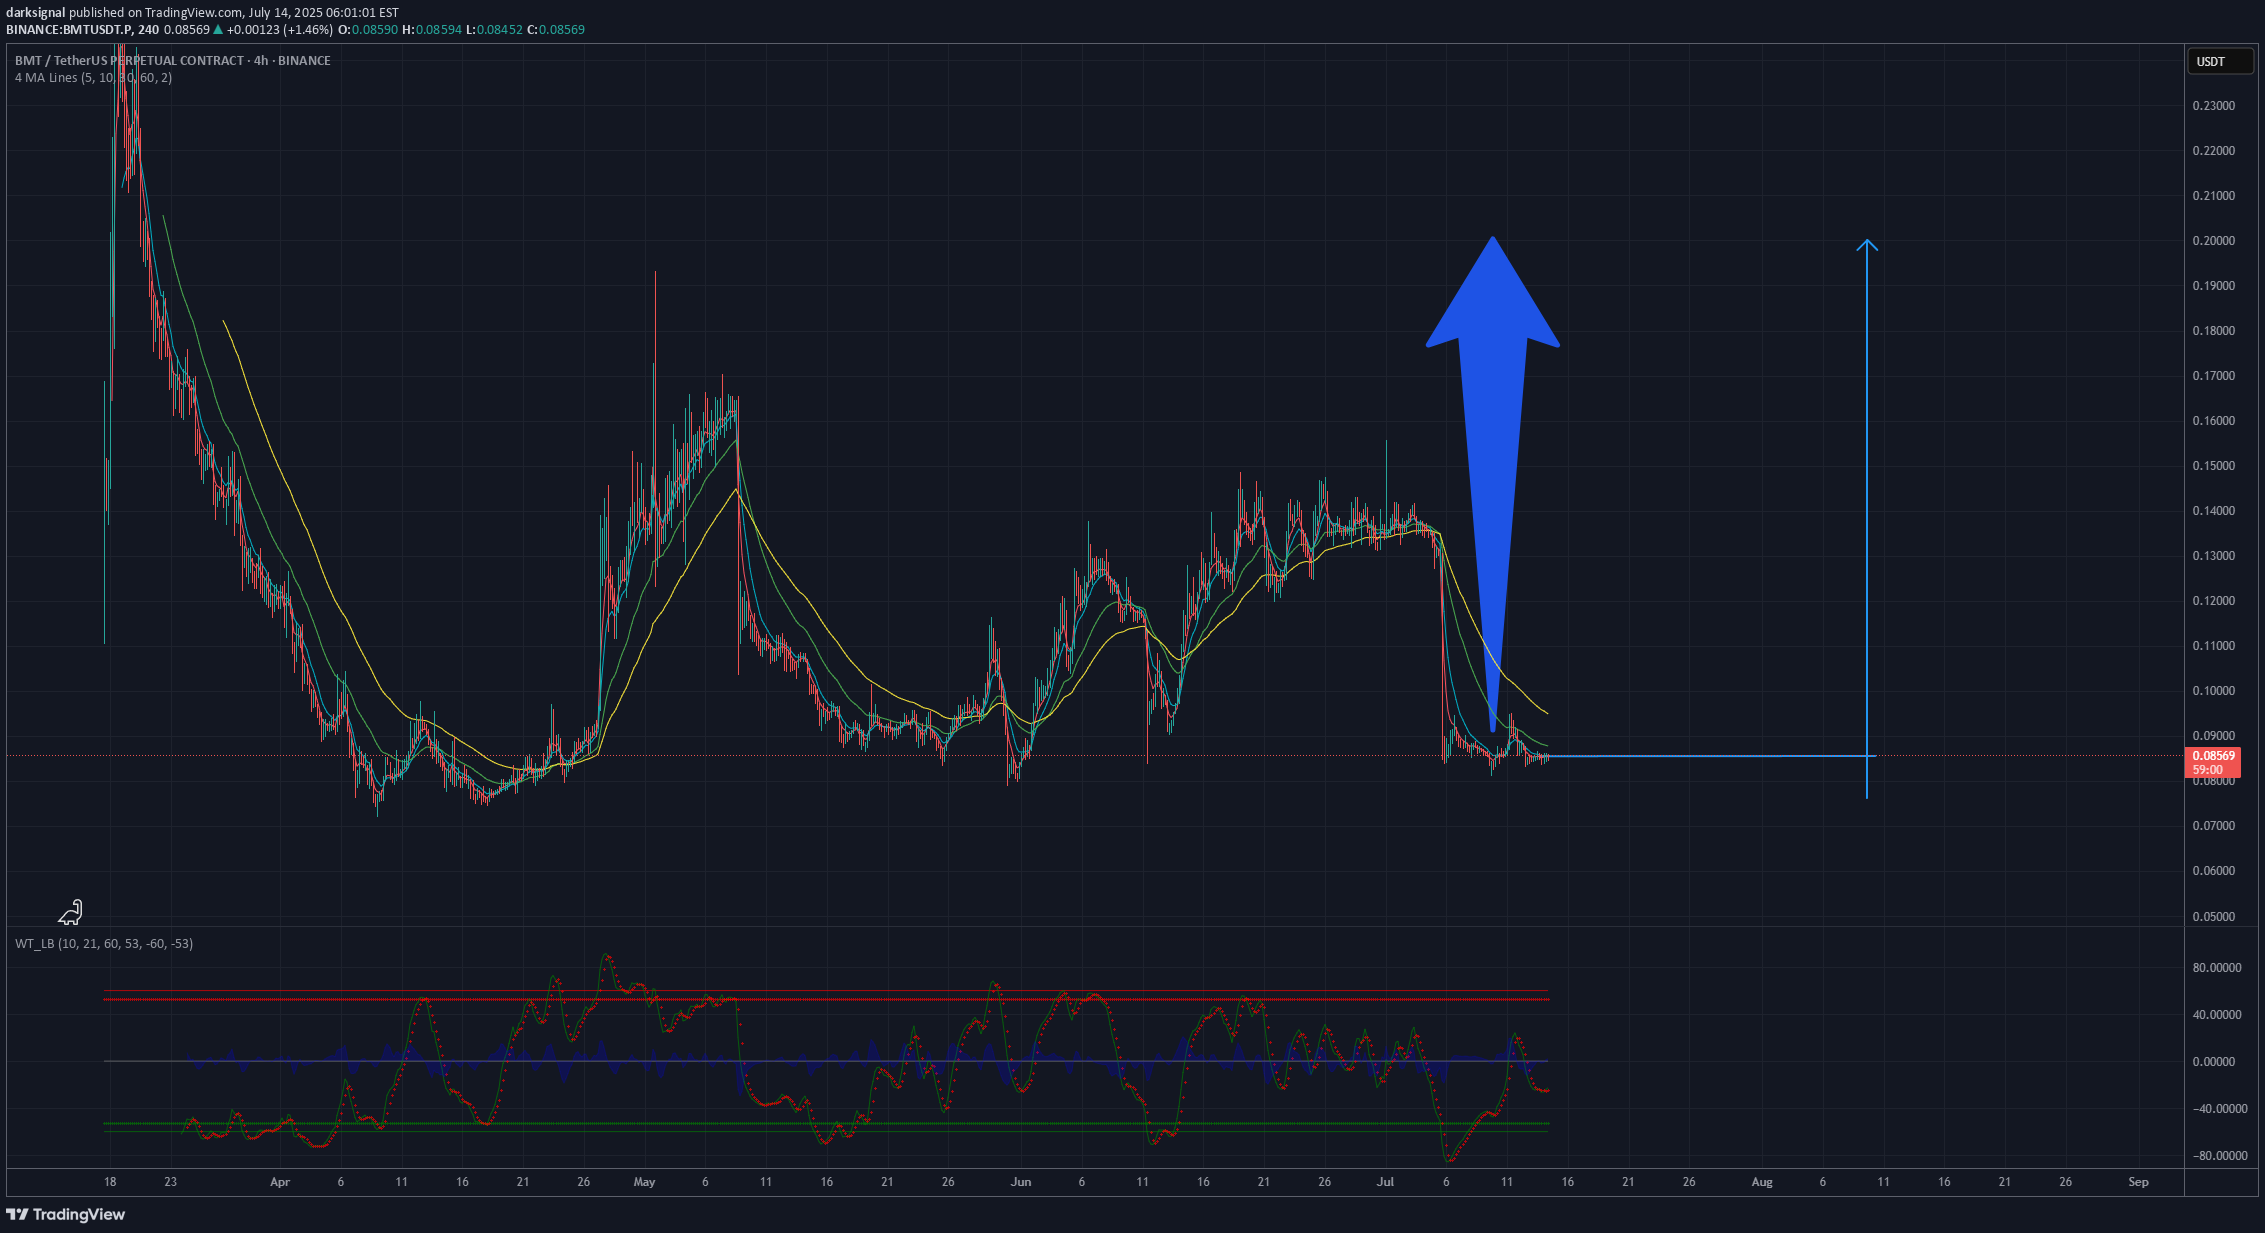
On the 4-hour chart of BMT/USDT, we can see continued consolidation following a sharp decline. The price is moving within a narrow range just below the resistance formed by the EMA lines (10, 21, 30), which currently act as dynamic barriers. A breakout above these moving averages could be the first sign of a shift in sentiment. The oscillator (WT_LB) shows an attempt to break out from lower levels, which may suggest the buildup of bullish momentum. A key level to watch is the 0.089–0.090 USDT zone — if the price can break and hold above this range, especially surpassing the local high from July 12, the bullish case strengthens. A bullish scenario becomes more credible if the price stabilizes above the EMAs and breaks through the 0.1043 USDT level. In that case, a gradual move toward the longer-term target at 0.20 USDT becomes possible, which aligns with previous consolidation and resistance levels on higher timeframes. Summary: – Short-term resistance: 0.089–0.090 USDT – Potential breakout trigger: > 0.1043 USDT – Target level: 0.20 USDT – Conditions: price holding support, breaking EMAs with volume confirmation

Captain-MAO
BMT/USDT continuation
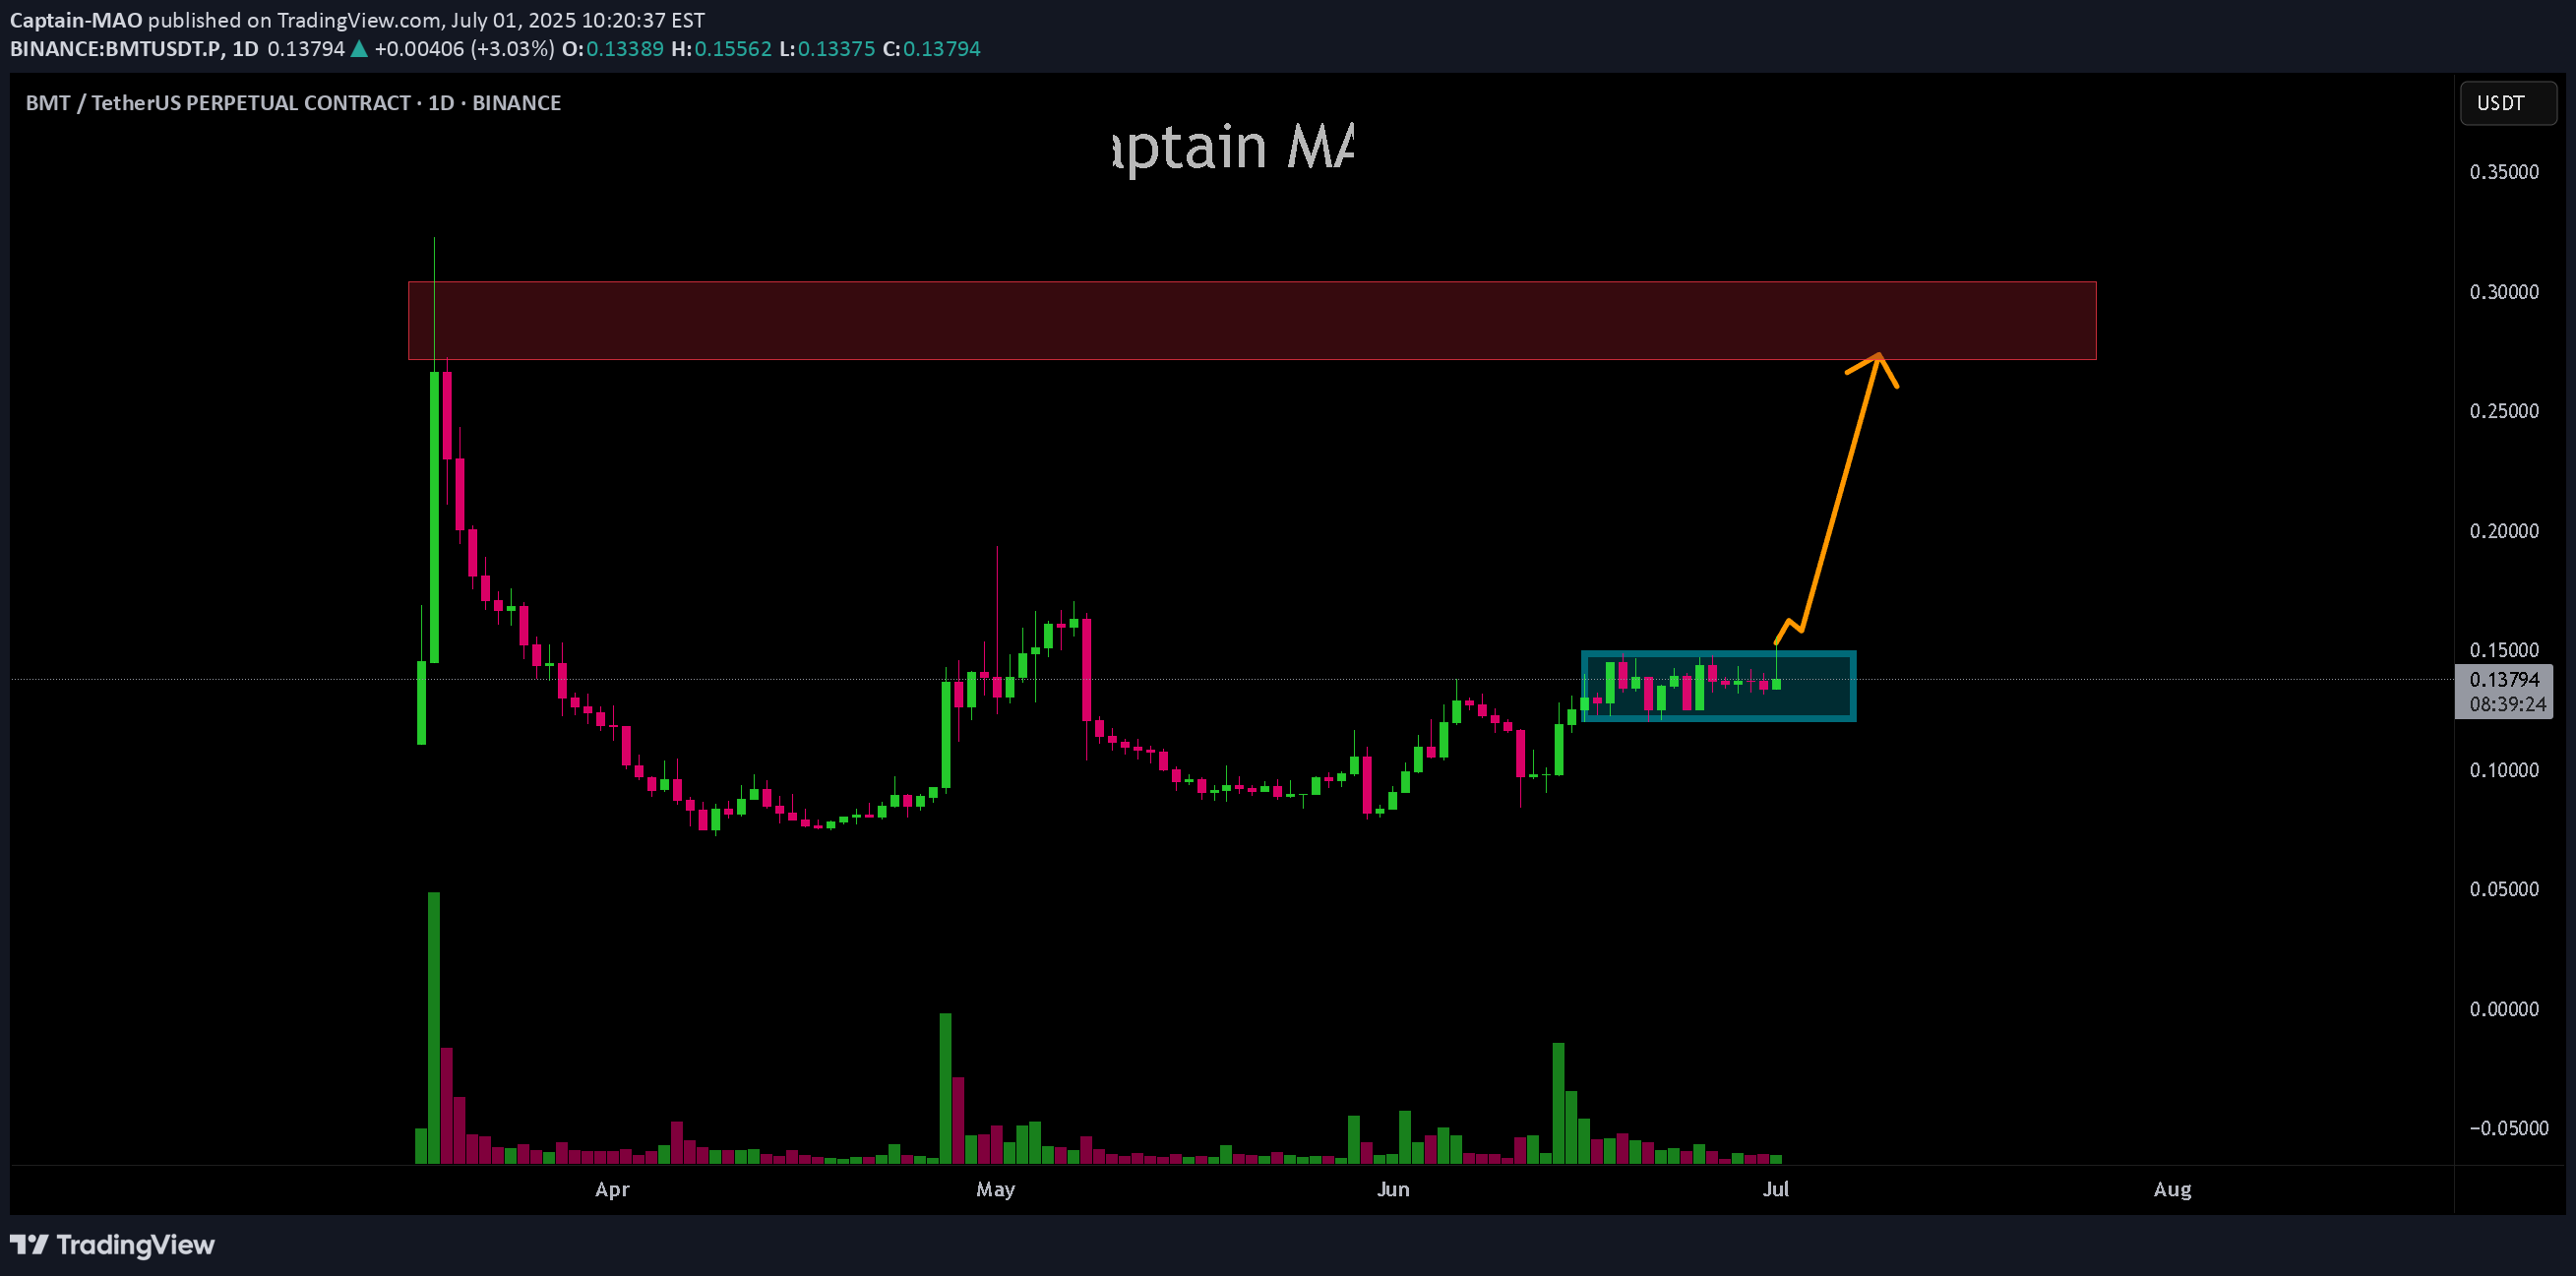
After breaking the previous swing high $ 0.13, BMT/USDT has flipped resistance into strong support around $0.013, holding well so far.Now waiting for a daily reclaim of $0.0152 to confirm bullish continuation, potentially targeting the $0.027 – $0.030 zone.
Disclaimer
Any content and materials included in Sahmeto's website and official communication channels are a compilation of personal opinions and analyses and are not binding. They do not constitute any recommendation for buying, selling, entering or exiting the stock market and cryptocurrency market. Also, all news and analyses included in the website and channels are merely republished information from official and unofficial domestic and foreign sources, and it is obvious that users of the said content are responsible for following up and ensuring the authenticity and accuracy of the materials. Therefore, while disclaiming responsibility, it is declared that the responsibility for any decision-making, action, and potential profit and loss in the capital market and cryptocurrency market lies with the trader.