
darksignal
@t_darksignal

What symbols does the trader recommend buying?
Purchase History
پیام های تریدر
Filter
darksignal
It's a time for MICROSTRATEGY - 40% potential profit - 250 USD
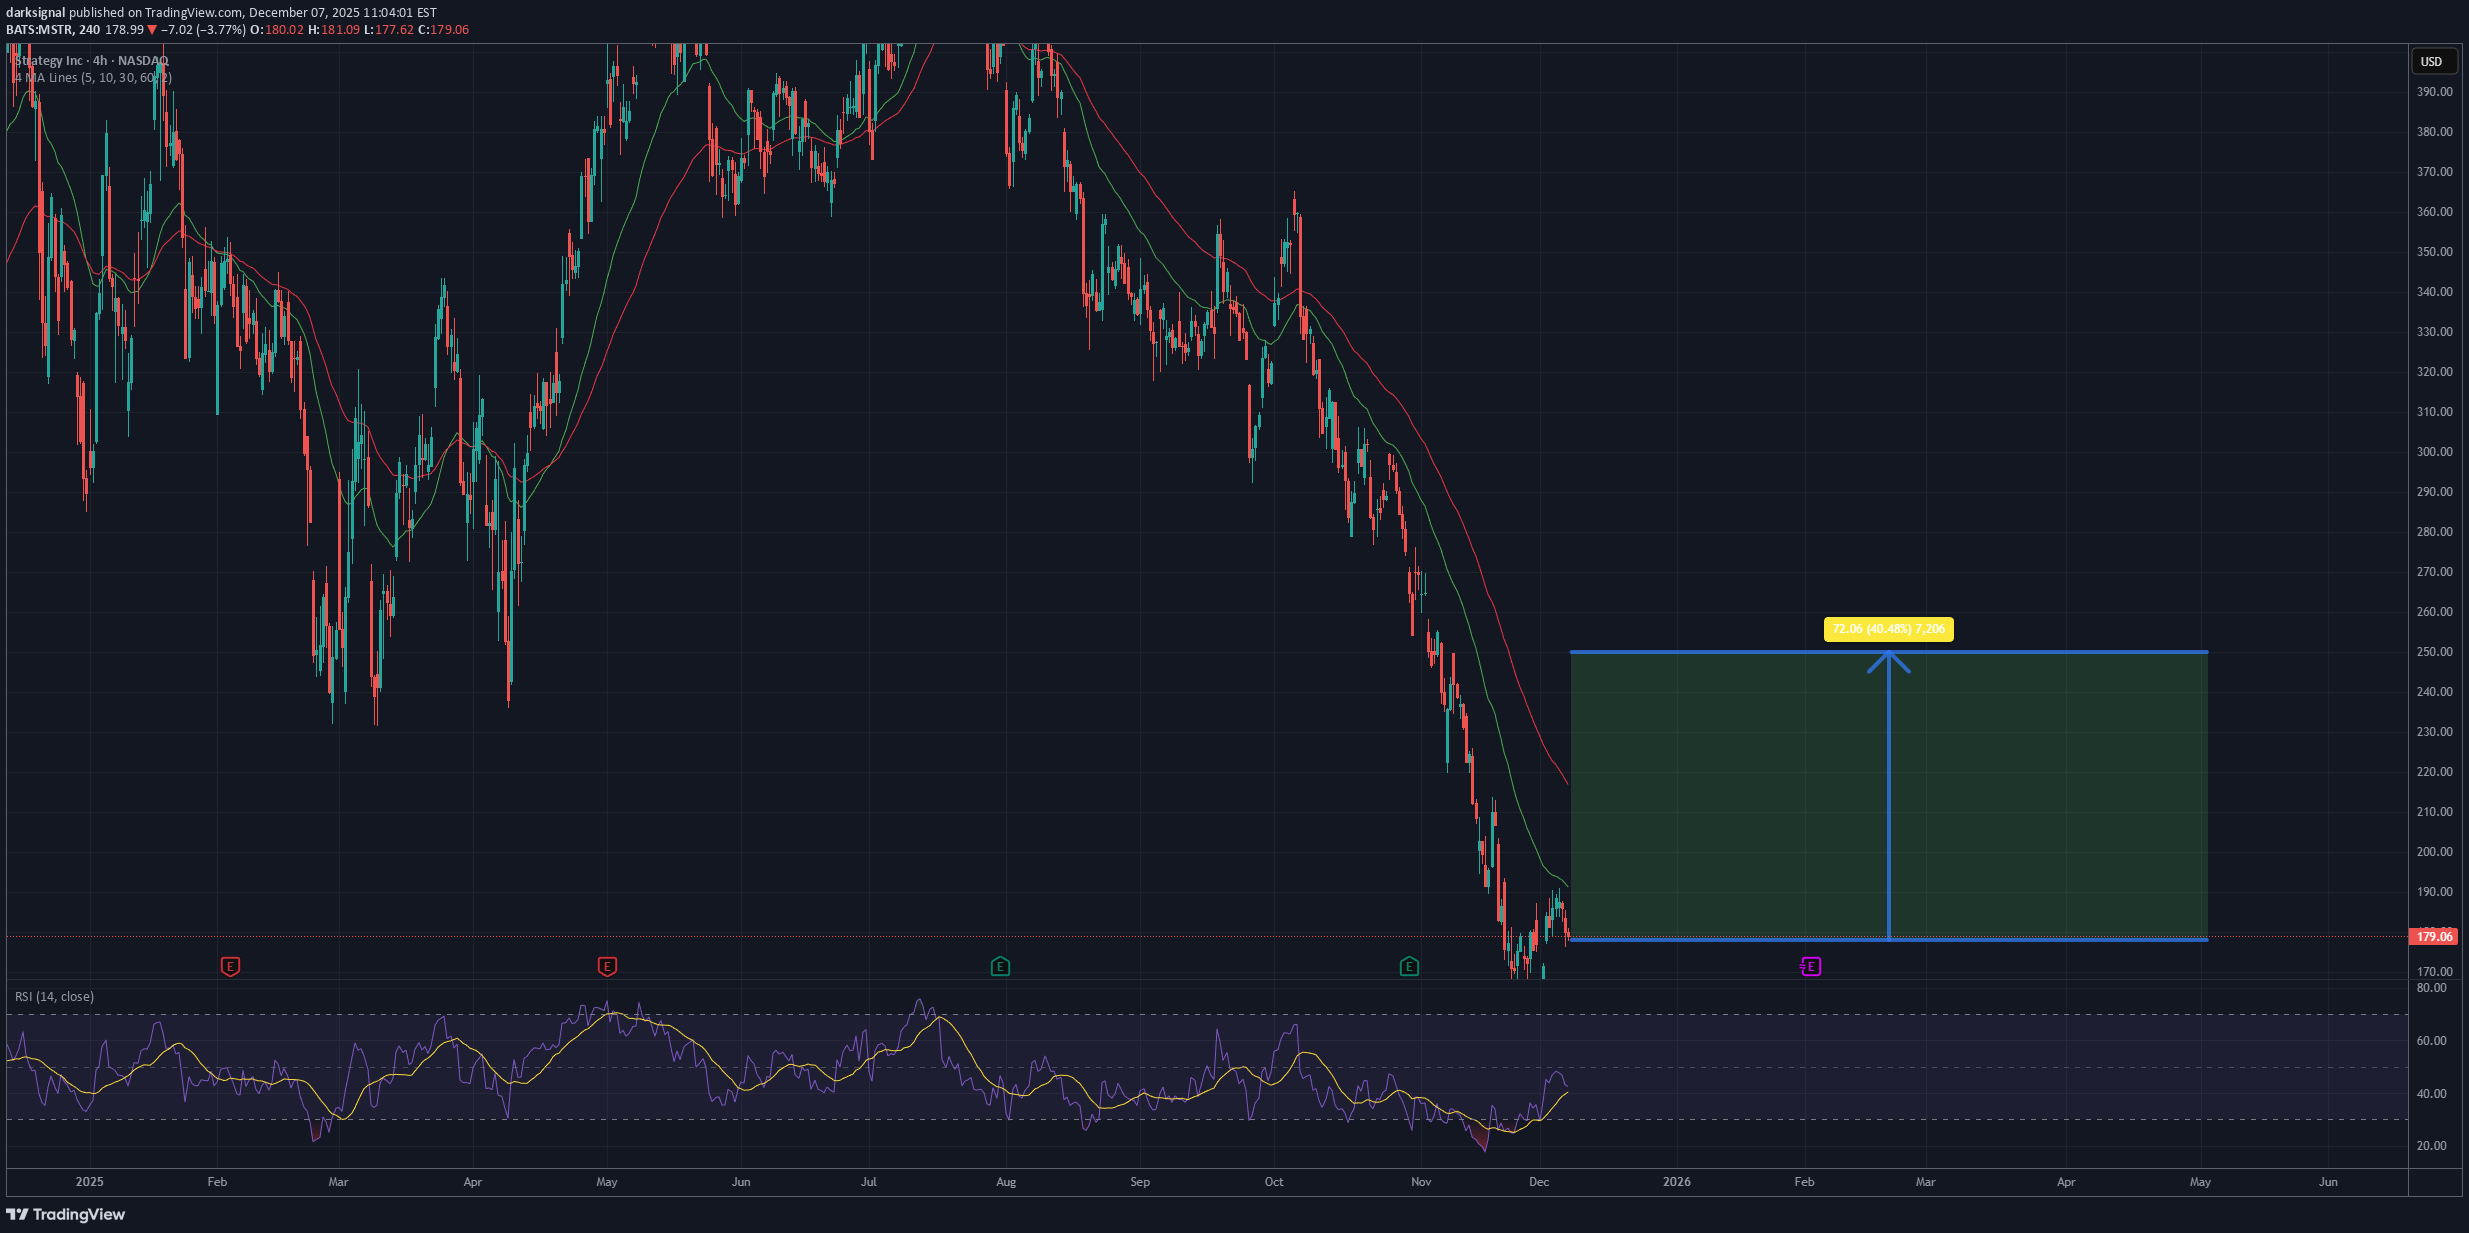
The chart shows a clear slowdown in the prolonged downtrend, with price action forming a local support zone around 176–180 USD. Recent candles indicate an attempt to stabilize, while the short-term moving averages are beginning to flatten out — a common early sign of shifting sentiment. The RSI has also rebounded from oversold levels and is now trending upward, suggesting growing bullish momentum after an extended period of selling pressure. If buyers manage to defend the current support area, the technical structure opens the possibility for a continued upward move. Under this scenario, a natural target could be the 250 USD region, representing an increase of roughly 40% from the current price. This level aligns with previous consolidation zones and may act as a reasonable objective should a stronger recovery unfold. Potential TP: 250 $ ⚠️ DISCLAIMER This analysis is for informational and educational purposes only and does not constitute financial advice, investment recommendations, or a suggestion to buy or sell any asset. All trading and investment decisions involve risk and should be made based on your own research or consultation with a licensed financial professional.
darksignal
بیت کوین سقوط میکند؟ هدف بعدی بیتکوین رسیدن به ۹۵,۰۰۰ دلار است!

The chart shows BTC/USDT (Bitcoin) on the 4-hour timeframe. After a strong rally above $125,000, the price has entered a clear downtrend, currently trading around $107,500. The market structure suggests that bearish pressure remains dominant. The moving averages (short-term and mid-term) are aligned bearishly — the shorter one (green) is positioned below the longer one (red), confirming the continuation of a downward trend. Each rebound attempt has been followed by a lower high, indicating weakening buying momentum. The RSI indicator has bounced from oversold levels but remains below the neutral 50 level, suggesting that sellers still control the market. If Bitcoin fails to break above $110,000, a continuation of the decline toward key support at $95,000 appears likely — representing an approximate 11–12% downside potential from current levels. Potential TP: 95 000 USD Disclaimer: This analysis is for informational and educational purposes only. It does not constitute investment advice or financial recommendation. All trading decisions should be made independently based on your own analysis and risk assessment.Target Done
darksignal
کاردانو به دلار یک میرسد؟ تحلیل مهم حمایت $0.81 و هدف صعودی ۹۵ سنتی ADA

On the Cardano (ADA/USDT, 4h) chart, after a previous decline, the price has stabilized around the $0.81–$0.82 zone, which represents a key support area. This level has repeatedly acted as a strong barrier against further declines and could now serve as a foundation for a potential rebound. In recent sessions, the market has been moving within a narrow price range, suggesting a period of accumulation before the next significant move. The moving averages (EMA 20 and EMA 50) are close to each other, indicating that selling pressure is weakening. Additionally, the RSI has leveled off around the 40–50 range, signaling that the bearish momentum may be fading and the market could be preparing for a recovery. If ADA holds above $0.81, there is a strong possibility of an upward move toward $0.87–$0.88, followed by a continuation to around $0.95, where a key technical and psychological resistance level is located. In summary: The current price action suggests the formation of a local bottom. Holding the $0.81 support zone could trigger a bullish wave, with a near-term target around $0.95 USD. Potential TP - 0.95 $
darksignal
PNUT/USDT: سیگنال صعود قوی! سود ۵۰ درصدی با شکست مقاومت کلیدی

On the Peanut the Squirrel / USDT 4-hour chart, after a prolonged downtrend, the price has stabilized around the $0.19 level, forming a solid support zone. Since then, the market has been gradually recovering, creating higher lows, which suggests a shift in sentiment from bearish to moderately bullish. The moving averages are converging, and the shorter one is attempting to cross above the longer one — a classic signal indicating the possible start of an upward move. Currently, the price is trading around $0.22, holding above local support and the short-term moving average, which shows that buyers are regaining control. The RSI, after a recent decline, is turning upward without reaching overbought territory, leaving room for further growth. If bulls manage to maintain the price above $0.21 and break the nearest resistance at $0.23, it could open the way for a continuation toward $0.25 and then $0.28. In the longer term, if the positive momentum holds, the market has the potential to rise toward the $0.32 area, which marks a strong resistance from previous highs. In summary, the chart structure and technical indicators suggest an increasing likelihood of a continued upward trend, with a potential target around $0.32, as long as the key support at $0.21 remains intact. Potential TP: 0.32 USD
darksignal
آربتروم (ARB): نقطه عطف حیاتی در ۰.۴۳ دلار؛ آیا قیمت به ۵۰ سنت بازمیگردد؟

On the Arbitrum (ARB/USDT, 4h) chart, we can see that after a strong downtrend, the price found support around the $0.42 level, where a local bottom was formed. From that point, the market began a recovery, pushing the price up toward the $0.46–$0.47 zone before entering a corrective pullback. Currently, the price is testing a key support area around $0.43–$0.44, which aligns with previous resistance and the 20- and 50-period EMAs. The RSI indicator has pulled back from overbought territory but remains above the 50 mark, indicating that buyers still have the upper hand in the medium term. If the price holds above $0.43, there’s a strong possibility of a rebound toward the $0.48–$0.50 resistance zone — a key level that could act as the next target for bullish momentum. A breakout above $0.50 could further open the path toward $0.52. Potential TP: 0.50 $ This analysis is for informational and educational purposes only and does not constitute financial advice or an investment recommendation.
darksignal
It is a time for TWTUSDT going down.20 % potential profit
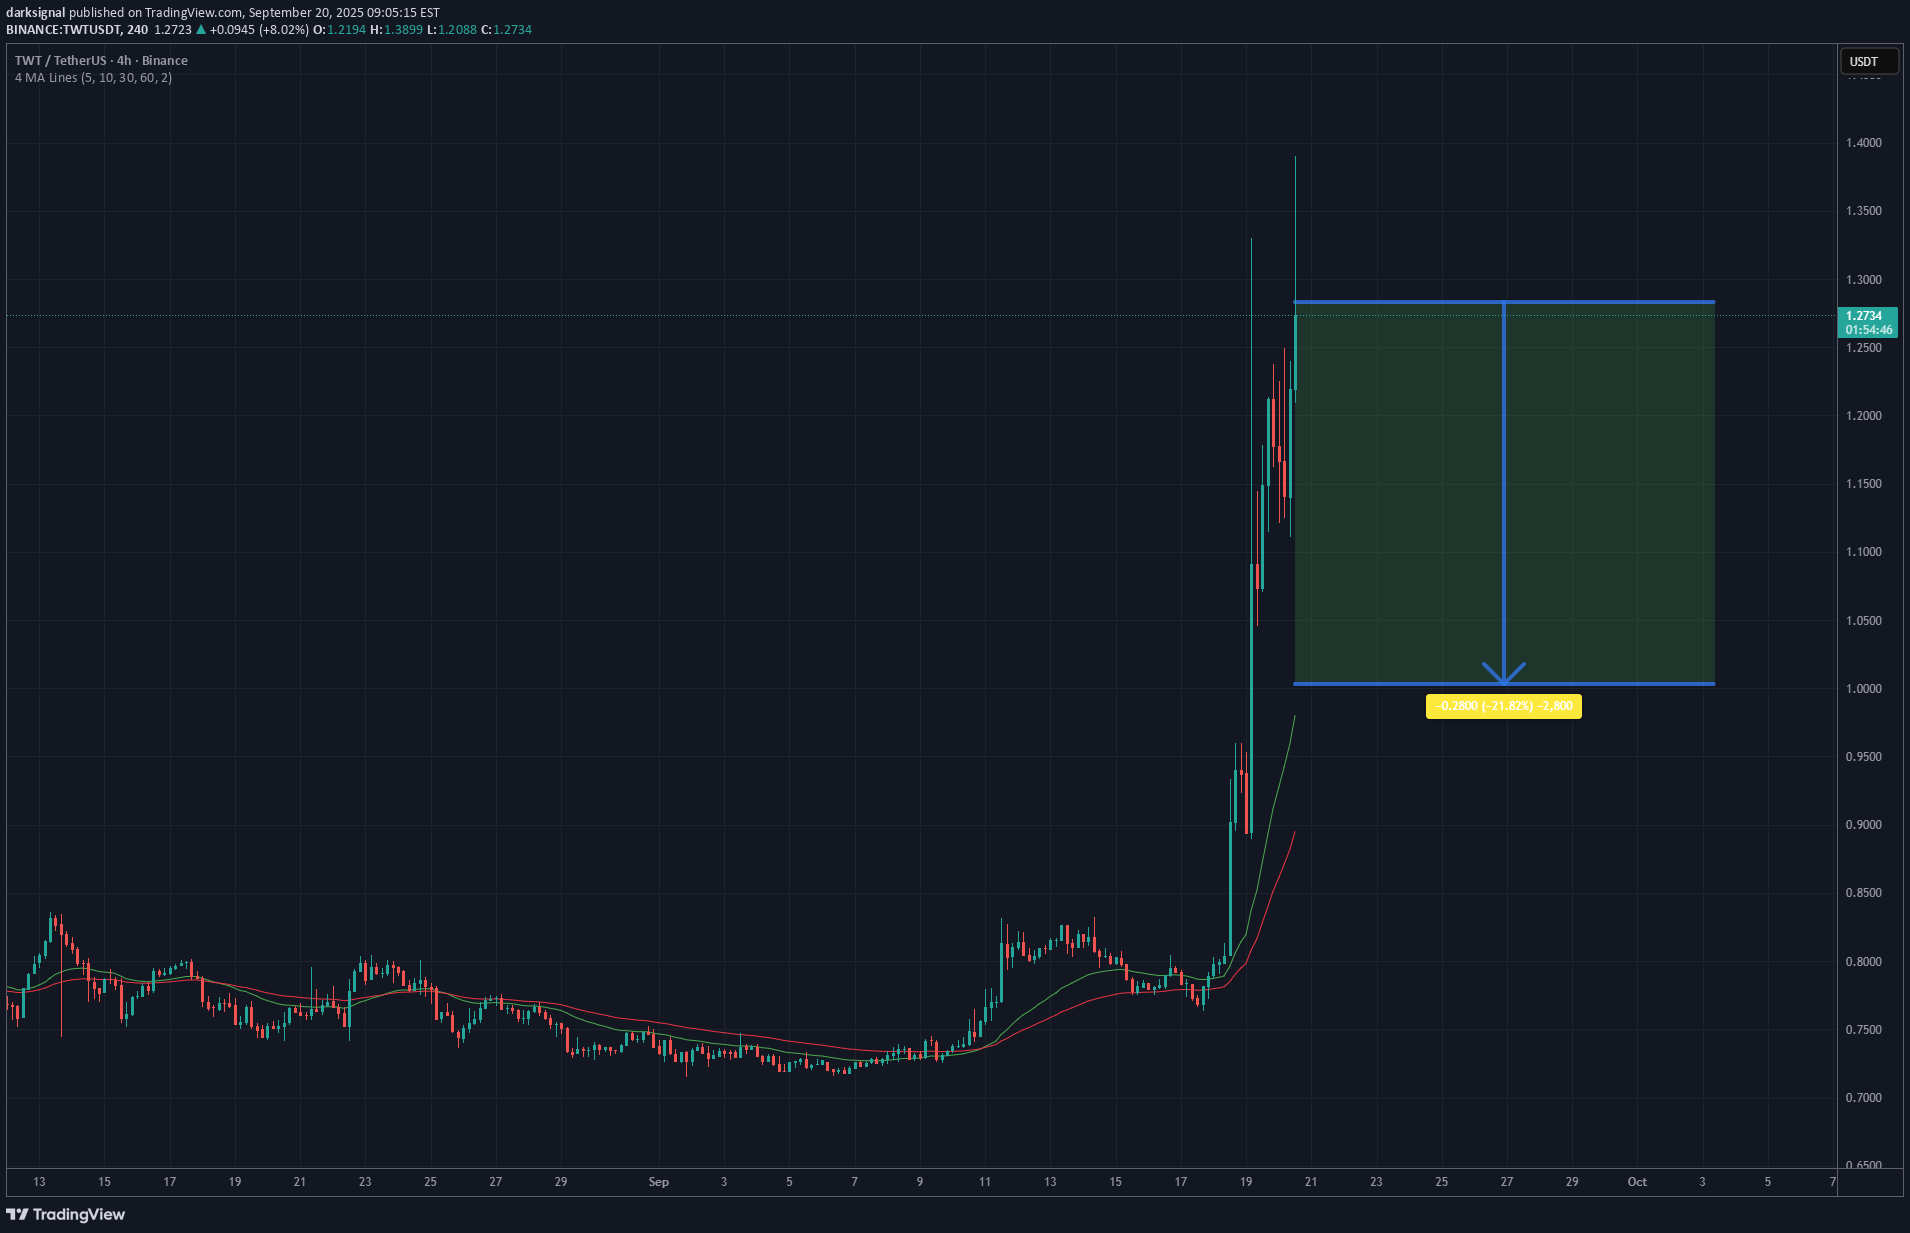
The chart shows a very sharp upward move, with price accelerating from below 0.80 USD to over 1.30 USD in a short period. Such vertical rallies often leave the market temporarily overextended. After this surge, several long wicks on recent candles indicate increased volatility and selling pressure at the highs. The shorter moving average is steeply rising and still above the longer moving average, confirming that momentum remains strong. However, the price is currently far above both moving averages, creating a large gap that often precedes a period of consolidation or a pullback as traders take profits. Key reference levels to watch are around 1.13 USD, where there is a visible horizontal line marking a prior breakout area, and then the 1.00 USD region, which served as a psychological round-number barrier and potential former resistance. If selling continues, those areas could act as support zones where buyers may attempt to re-enter. Overall, the market remains bullish on a broader time frame but technically overbought in the short term. Monitoring whether the price closes back inside the moving-average bands and how it behaves near 1.13 USD and 1.00 USD will give clues about the strength of any corrective move. Potential TP : 1 $
darksignal
Is it a time for CRVUSDT. 30% potential target 1 $
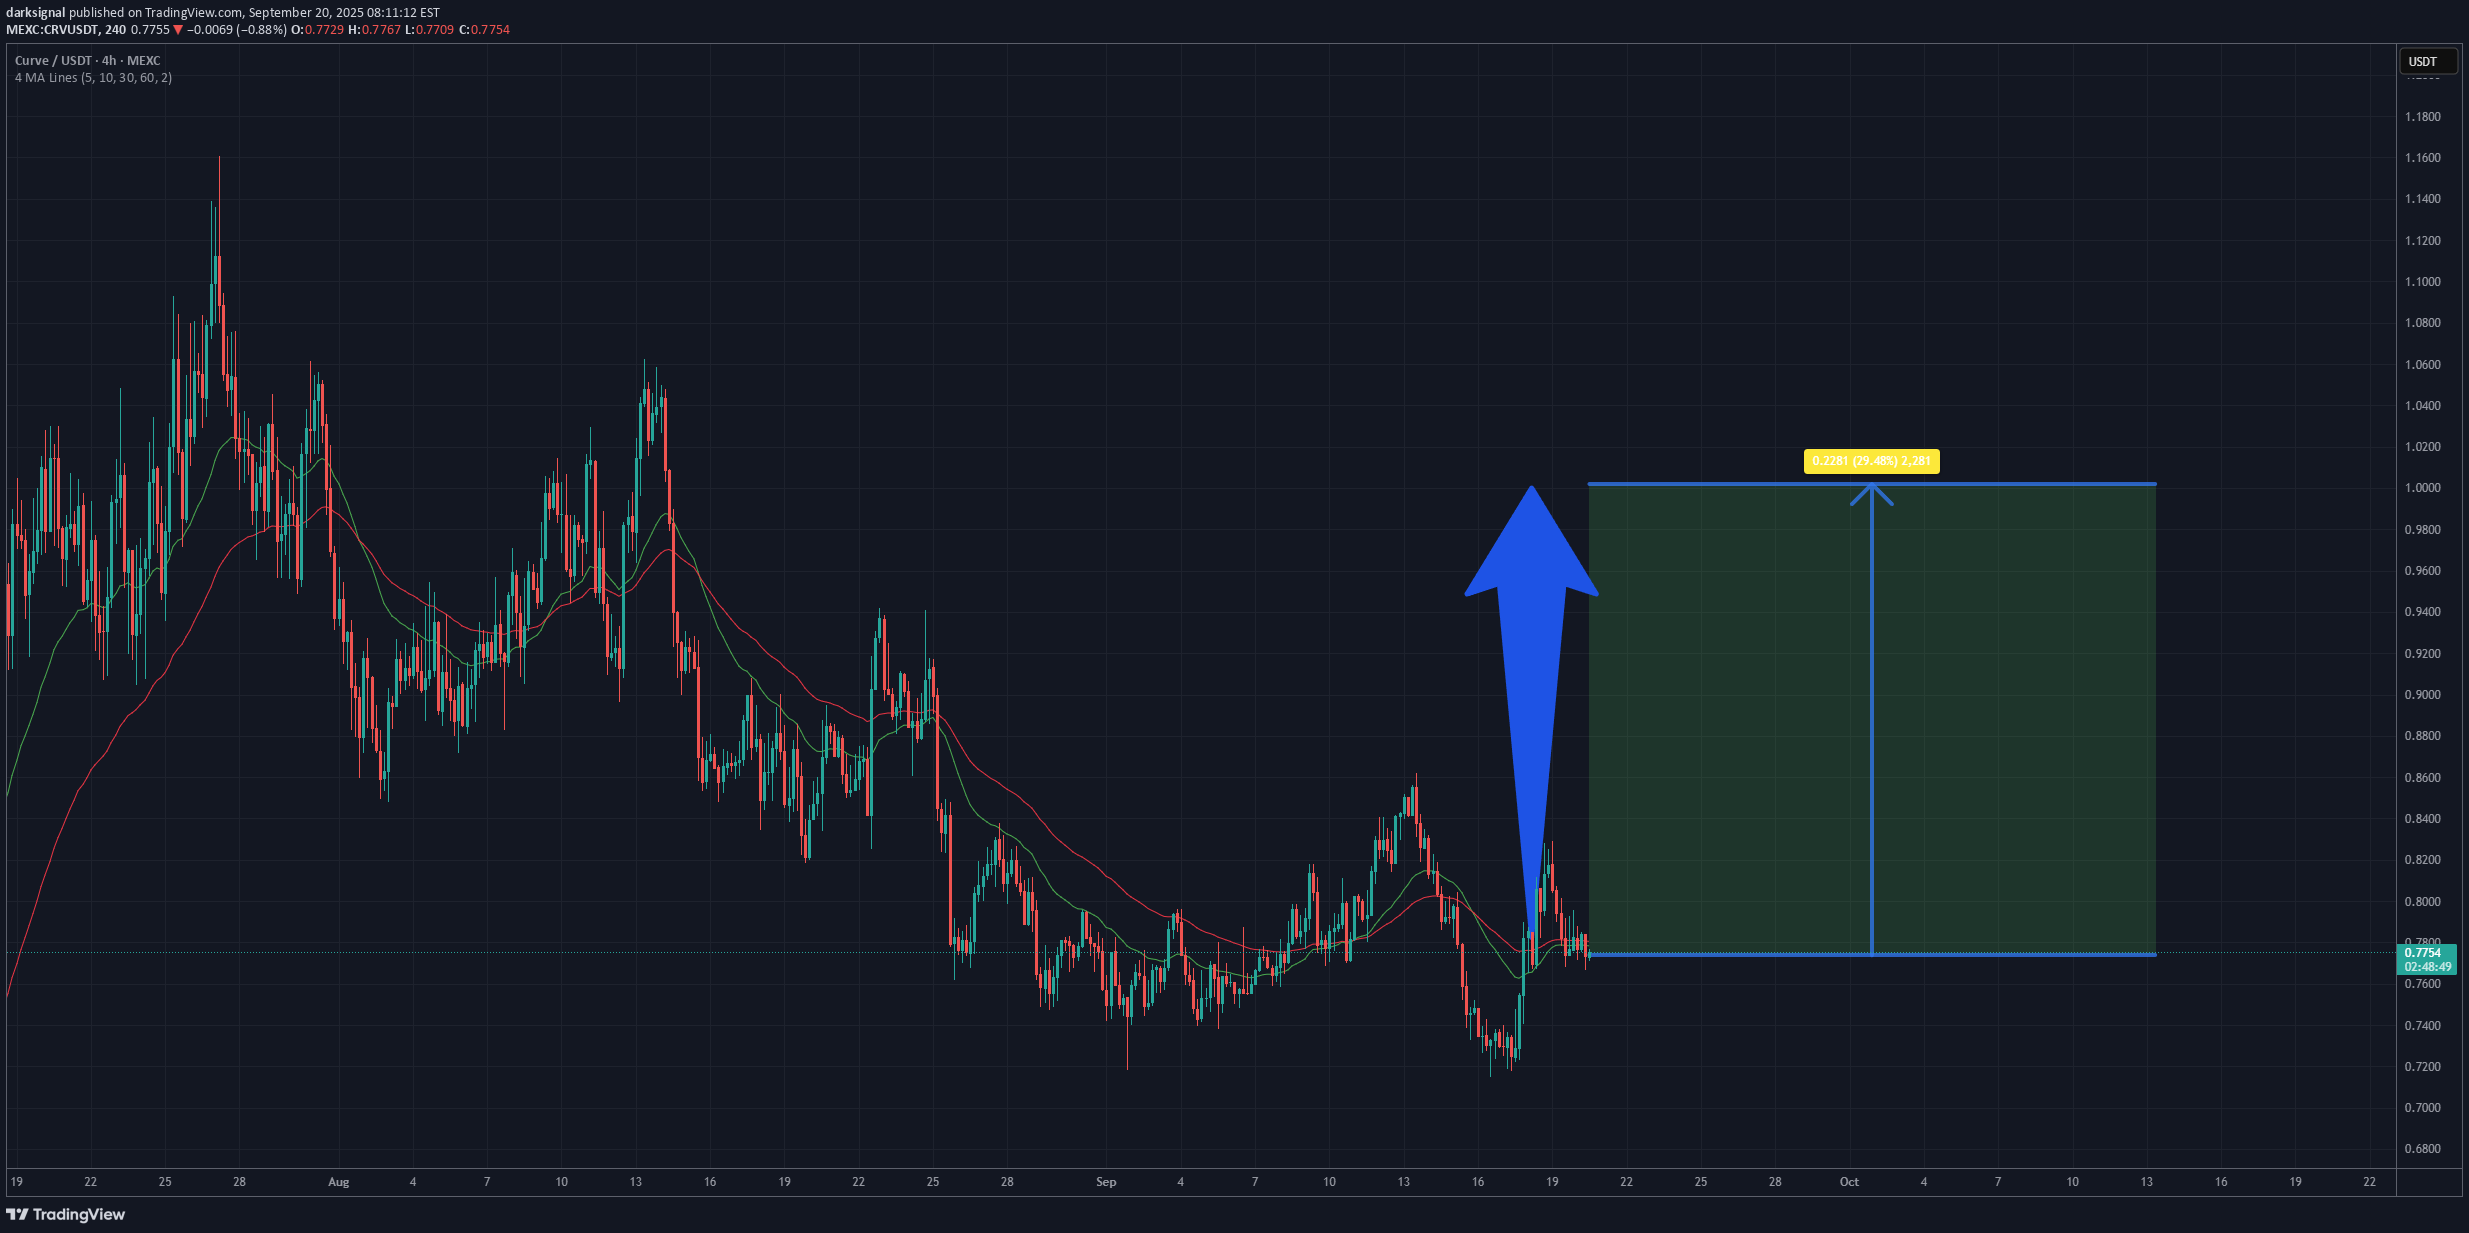
On the 4-hour Curve/USDT chart the market shows a period of sideways consolidation after a recent rebound from the 0.72 USD area. Price is hovering around 0.77 USD, moving in a relatively tight range and testing both short-term moving averages. The shorter moving average has started to flatten and occasionally crosses above the longer one, a sign that selling momentum is easing. At the same time, the longer moving average still trends slightly downward, so the broader picture remains neutral to mildly bearish until a clear break higher occurs. A key support zone is visible around 0.74–0.75 USD, where several pullbacks have recently been absorbed. Above current levels, the first notable resistance lies near 0.80 USD, followed by a wider supply zone around 0.86–0.88 USD that previously capped upward moves. A sustained close above those levels, especially with rising trading volume, would indicate strengthening bullish pressure. Overall, the chart reflects a market that is stabilizing after a decline, with early signs that buyers are trying to build momentum. Further confirmation from price closing above the identified resistance areas and a continued uptick in volume would improve the outlook for additional upward movement. Potential TP: 1 $
darksignal
Time for FORMUSDT. 55% potential profit, 2.60 $ target
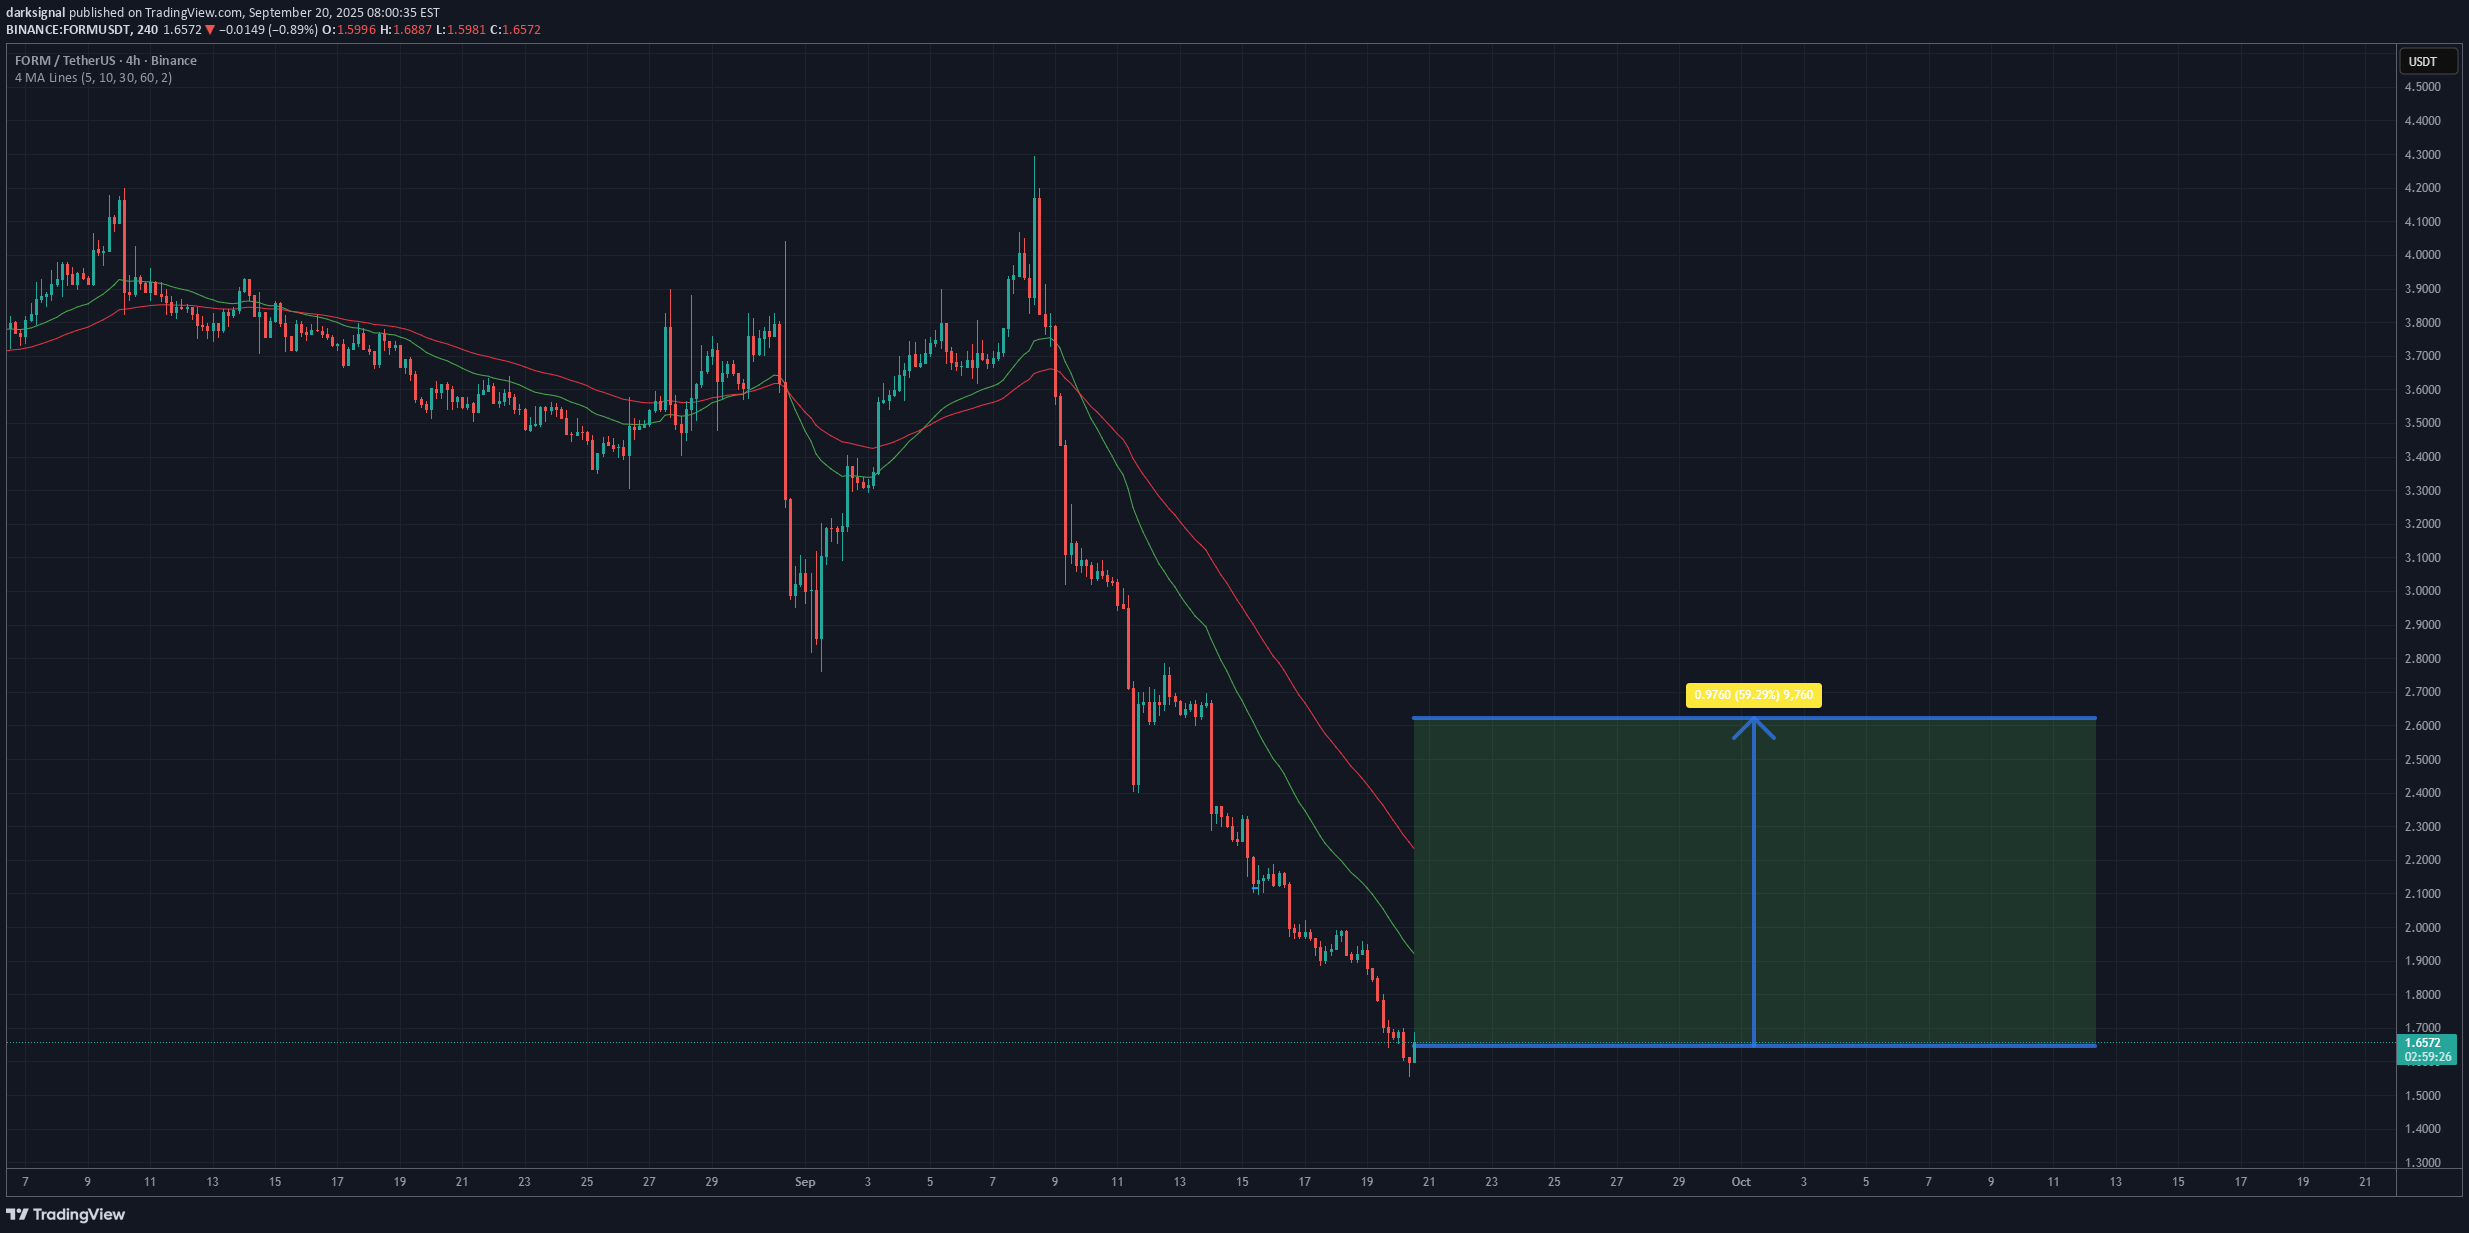
On the 4-hour chart, the FORM/USDT pair remains in a clear downtrend. Successive lower highs and lower lows indicate sustained selling pressure, and the price continues to trade below key moving averages. Both short- and long-term moving averages are sloping downward, reinforcing the bearish outlook. At present, the market is showing a brief consolidation around the 1.60–1.50 USD area, which acts as a local support zone. The first notable resistance levels appear near 1.90–2.00 USD, where previous supply reactions occurred and the shorter moving averages converge. A decisive break above this zone could signal that downward momentum is weakening, though there are no strong signs of a trend reversal yet. It is worth monitoring trading volume closely—an uptick in volume during an attempted breakout from the current range could indicate a shift in market dynamics. Complementary indicators such as RSI or MACD may help identify potential signs of trend exhaustion or the early stages of a momentum change. Potential TP: 2.60
darksignal
Is it a time for REQUSDT? Potential target 0.15 - 16 %

On the Request Network / USDT (4h, Binance) chart, we can see a strong downward move that pushed the price towards the $0.128 area, where a first buying reaction is appearing. This level coincides with a local support zone that has previously stopped declines multiple times. Key points to note: The price has reached the lower boundary of the recent consolidation range, which increases the chances of a rebound. The sell-off was sharp, and markets often see corrective upward moves after such strong drops. Moving averages are still sloping down, but a short-term recovery is possible if buying pressure holds. In summary, there is a probability that in the coming days the price will attempt a rebound towards $0.15, which represents a psychological resistance and a former balance area from August. Potential TP: 0.15 USD
darksignal
It is a time for JUPITER! 40% POTENTIAL PROFIT - 0.75 USD

On the 4-hour chart of the Jupiter/USDT pair, we can see a strong upward move following a previous sharp decline that found support around the 0.43 USD level. Since then, the price has rebounded and started forming a sequence of higher lows, suggesting a short-term shift towards bullish sentiment. Key observations: Rebound from support: After the drop to around 0.43 USD, the price bounced and established a series of rising lows, which is an initial sign of buying strength. Moving Averages (MA): The green (short-term) moving average has started crossing above the red (long-term) one, which can be an early signal of a trend reversal towards the upside. Market structure: The chart shows a potential “V-shaped” reversal pattern, where a breakout above 0.55 USD could open the way for further gains. Bullish scenario: If the current sideways correction in the 0.50–0.54 USD range ends with an upward breakout, the price could first move toward 0.60 USD and then to 0.75 USD, which aligns with the previous highs from mid-July. This scenario becomes more likely if the breakout is supported by increased volume and the price holds above 0.55 USD. Potential TP: 0.75 $
Disclaimer
Any content and materials included in Sahmeto's website and official communication channels are a compilation of personal opinions and analyses and are not binding. They do not constitute any recommendation for buying, selling, entering or exiting the stock market and cryptocurrency market. Also, all news and analyses included in the website and channels are merely republished information from official and unofficial domestic and foreign sources, and it is obvious that users of the said content are responsible for following up and ensuring the authenticity and accuracy of the materials. Therefore, while disclaiming responsibility, it is declared that the responsibility for any decision-making, action, and potential profit and loss in the capital market and cryptocurrency market lies with the trader.