
BLUR
Blur
| تریدر | نوع سیگنال | حد سود/ضرر | زمان انتشار | مشاهده پیام |
|---|---|---|---|---|
No results found. | ||||
Price Chart of Blur
سود 3 Months :
سیگنالهای Blur
Filter
Sort messages by
Trader Type
Time Frame

MasterAnanda
Blur Recovers, No Longer Trading At Bottom Prices
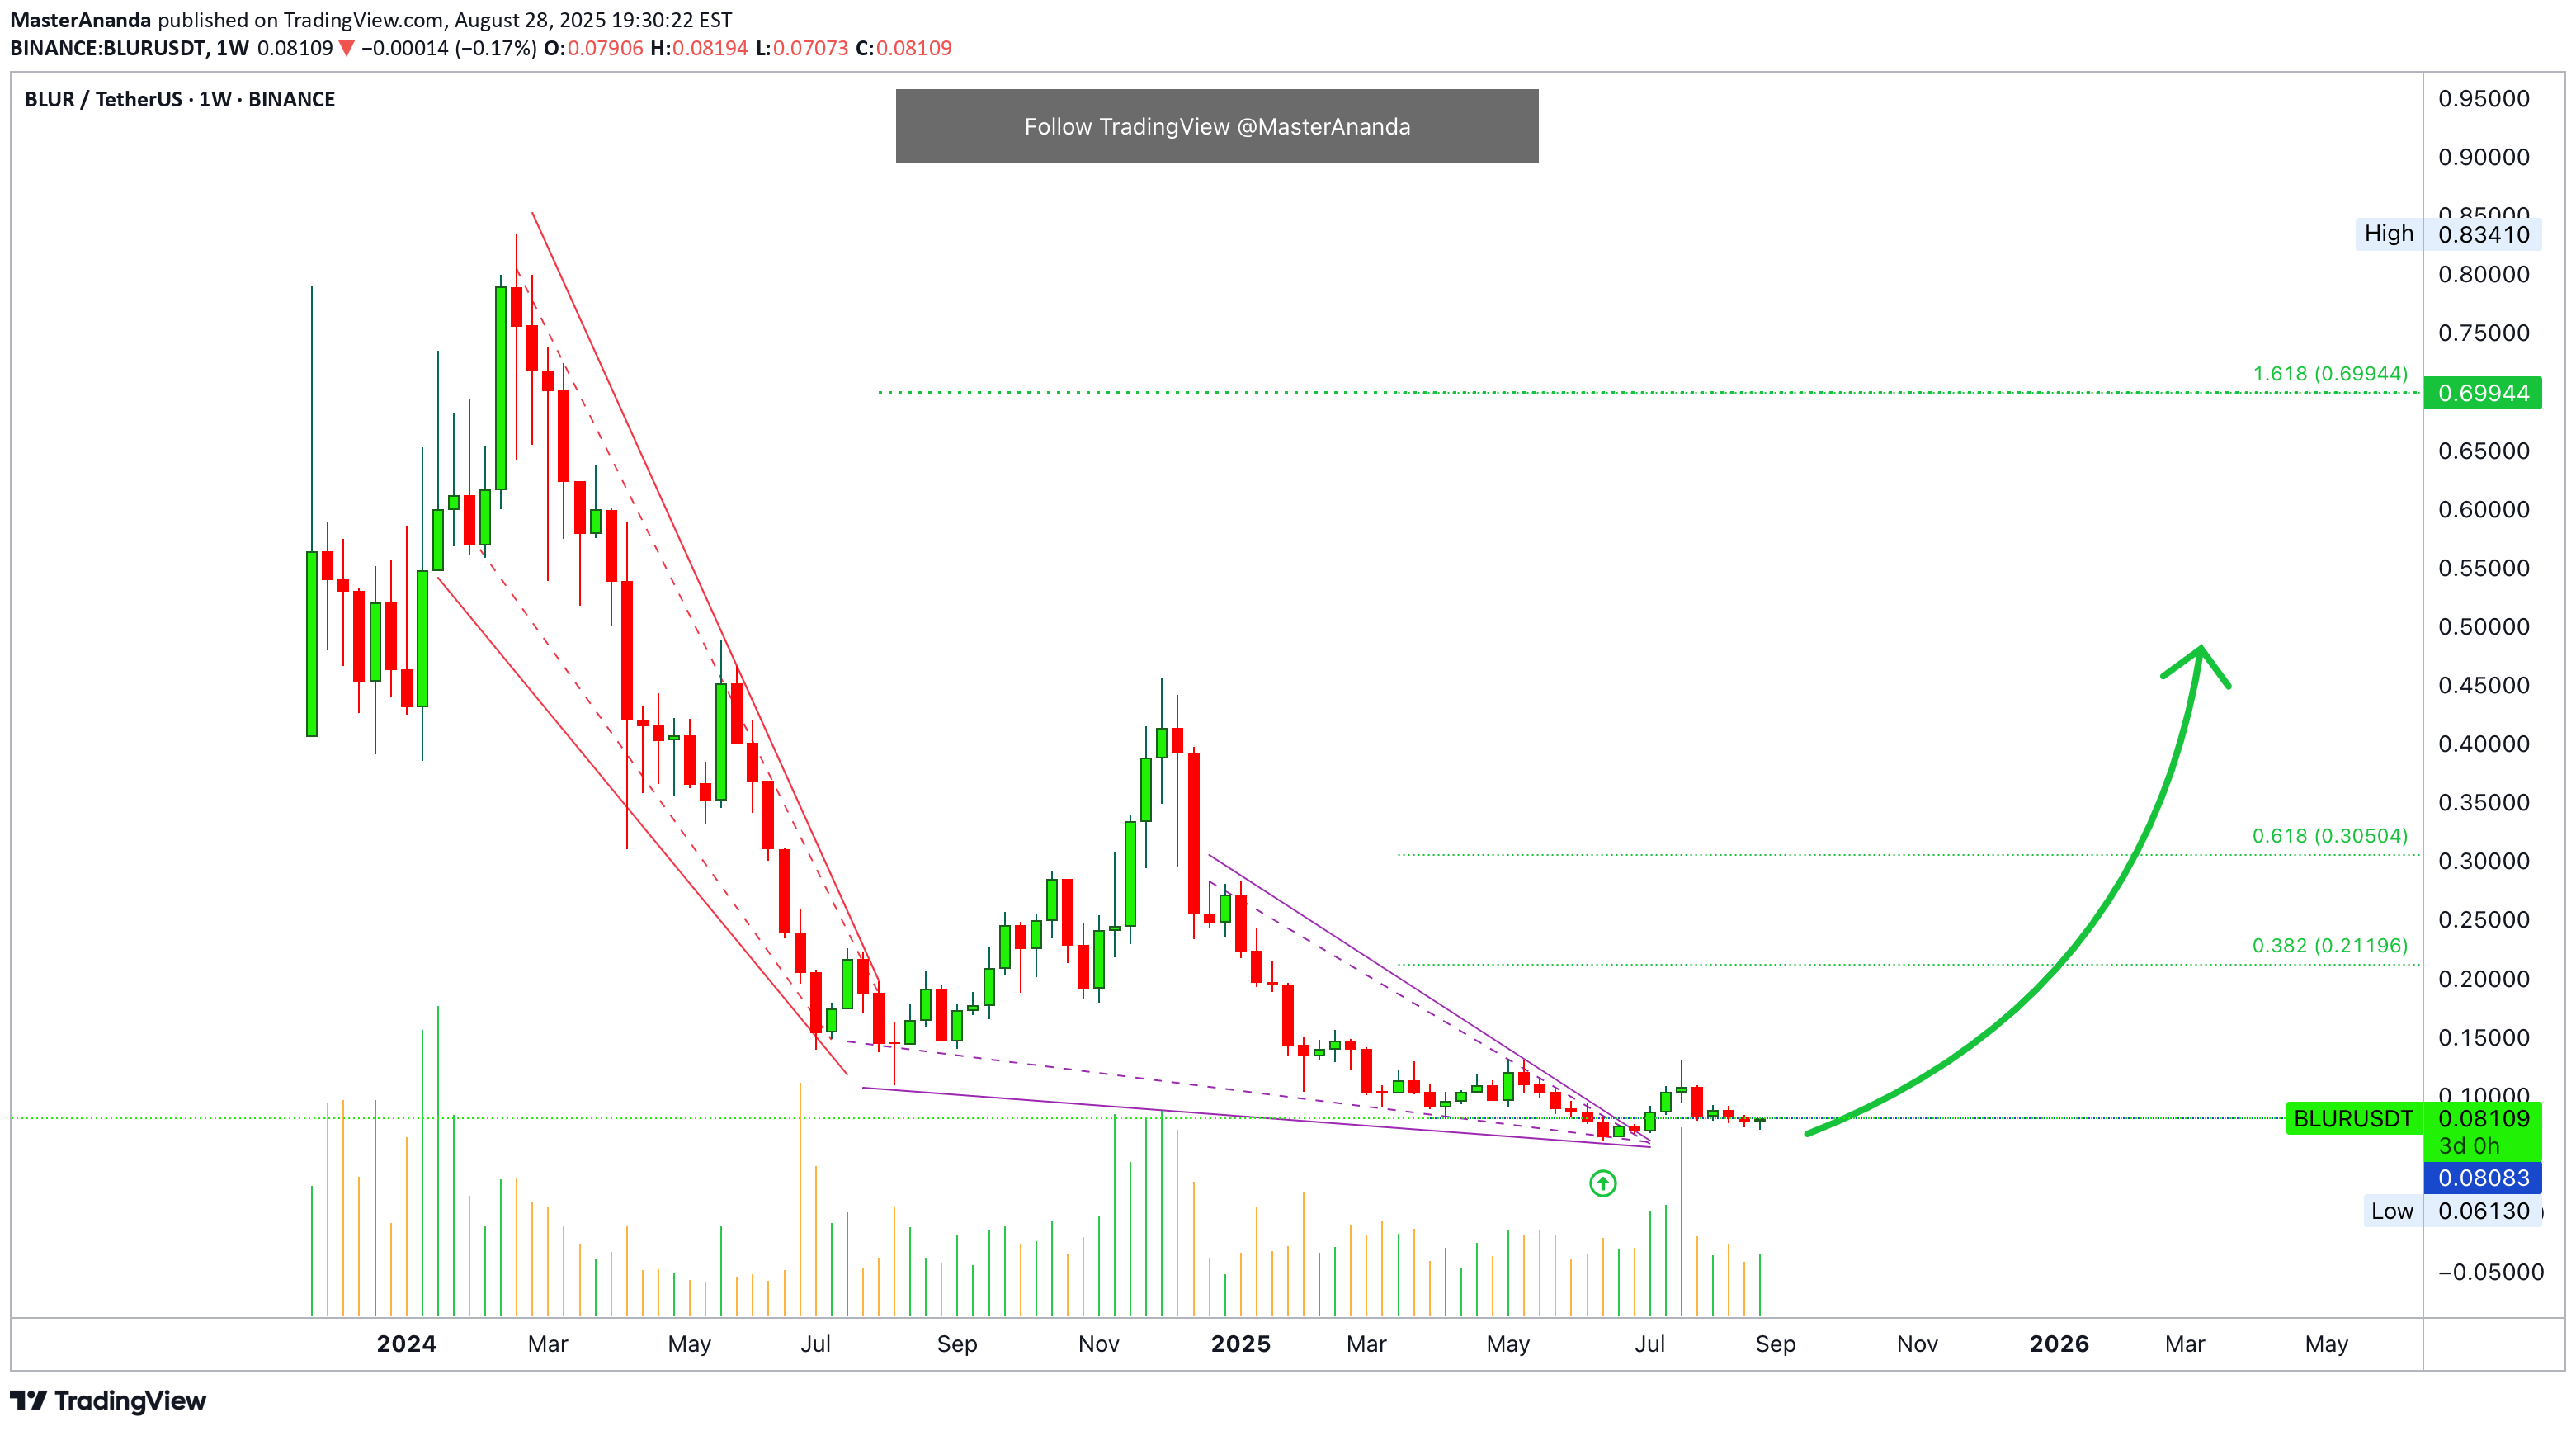
Look at this chart and consider the candles. Look at the size of the candles. What do you see? On the left side these candles are really big. Late 2023 to early 2024. Notice the right side of the chart, present day. See how small the candles are but notice the volume. The 21-July week has really high volume but notice the size of the candle, very small. While there wasn't much change in price, the action was similar to November 2024. Something big happening behind the scenes. These are bottom signals. BLURUSDT is trading at bottom prices. If you zoom in, you will find several interesting signals. Signals that support a bullish bias based on the short-term. Chart: The current candle (active session) is trading as a hammer, which is a bullish pattern when it happens at low prices after a downtrend. The same candle is also a higher low compared to June. The session is green. Summary Long-term, we have signals pointing to a bottom. The size of the candles and price action going flat. Short-term, we have high volume and also a higher low. BLURUSDT is about to produce a new bullish wave. Thank you for reading. Namaste.

Alpha-GoldFX
BLURUSDT Forming Descending Triangle

BLURUSDT is currently forming a descending triangle pattern, a structure that often signals a potential breakout — either bearish or bullish depending on key support levels. In this case, strong buying pressure and good volume hint at a bullish reversal from this consolidation phase. If price breaks above the descending trendline resistance, traders could see an upward move of 70% to 80%+, especially given BLUR's recent accumulation behavior and increased market interest. The fundamentals behind BLUR, a token powering the Blur NFT marketplace, are also contributing to its market traction. As interest in NFT infrastructure and marketplace tokens grows again, BLUR appears to be regaining investor confidence. This renewed momentum aligns with the technical structure that shows tightening price action and lower volatility — often a precursor to significant movement. Traders and analysts will be watching the breakout levels very closely. A sustained move above the upper boundary of the triangle, accompanied by rising volume, would provide a strong confirmation of the bullish scenario. With current on-chain activity and increasing social engagement, BLUR may surprise the market with its next impulse wave. ✅ Show your support by hitting the like button and ✅ Leaving a comment below! (What is You opinion about this Coin) Your feedback and engagement keep me inspired to share more insightful market analysis with you!
Alpha-GoldFX
BLURUSDT Forming Bullish Wave
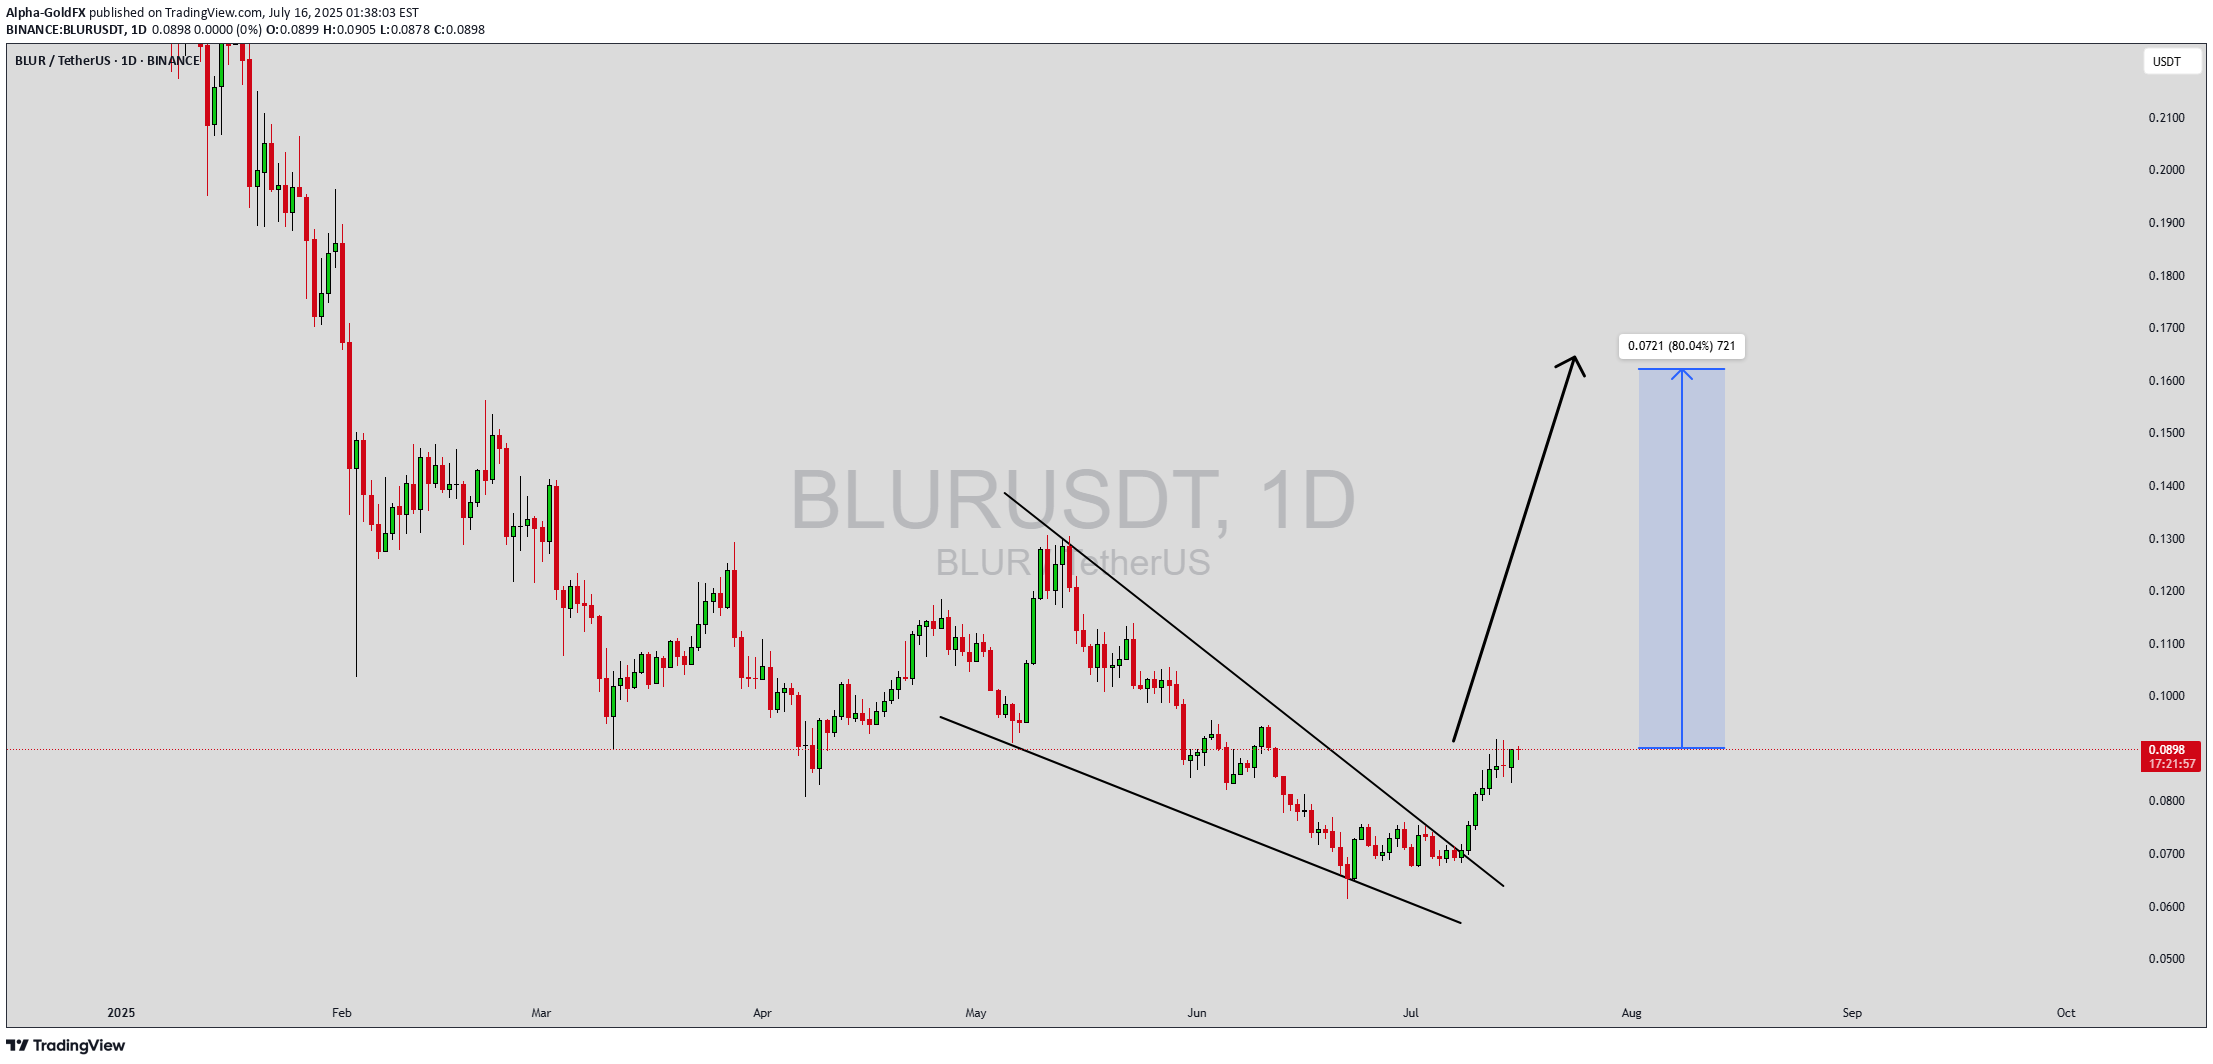
BLURUSDT is currently shaping up a promising bullish wave that’s catching the eye of both swing traders and long-term crypto investors. With a strong surge in trading volume, this pattern indicates that fresh buying momentum is entering the market. Traders are watching closely for confirmation that BLUR can sustain this upward move, potentially delivering an impressive 80% to 90% gain if momentum continues to build over the next few weeks. The BLUR token, known for its role in the decentralized NFT marketplace ecosystem, has been gaining traction as new developments and integrations add value to its use case. This increased investor interest is translating into healthy market activity and supports the idea that BLURUSDT could maintain its upward trajectory. The growing NFT sector remains one of the hottest trends in crypto, and BLUR stands to benefit as it continues to expand its user base and ecosystem. From a technical analysis perspective, the bullish wave pattern suggests a strong push toward higher resistance levels if buyers can defend key support zones. Watching for consolidation and a series of higher lows will be essential for traders looking to ride the next leg up. If the crypto market remains favorable and Bitcoin stays stable, BLUR could hit its projected targets with relative ease. ✅ Show your support by hitting the like button and ✅ Leaving a comment below! (What is You opinion about this Coin) Your feedback and engagement keep me inspired to share more insightful market analysis with you!

CRYPTOMOJO_TA
$BLUR looks good, 2x bullish rally INCOMING!
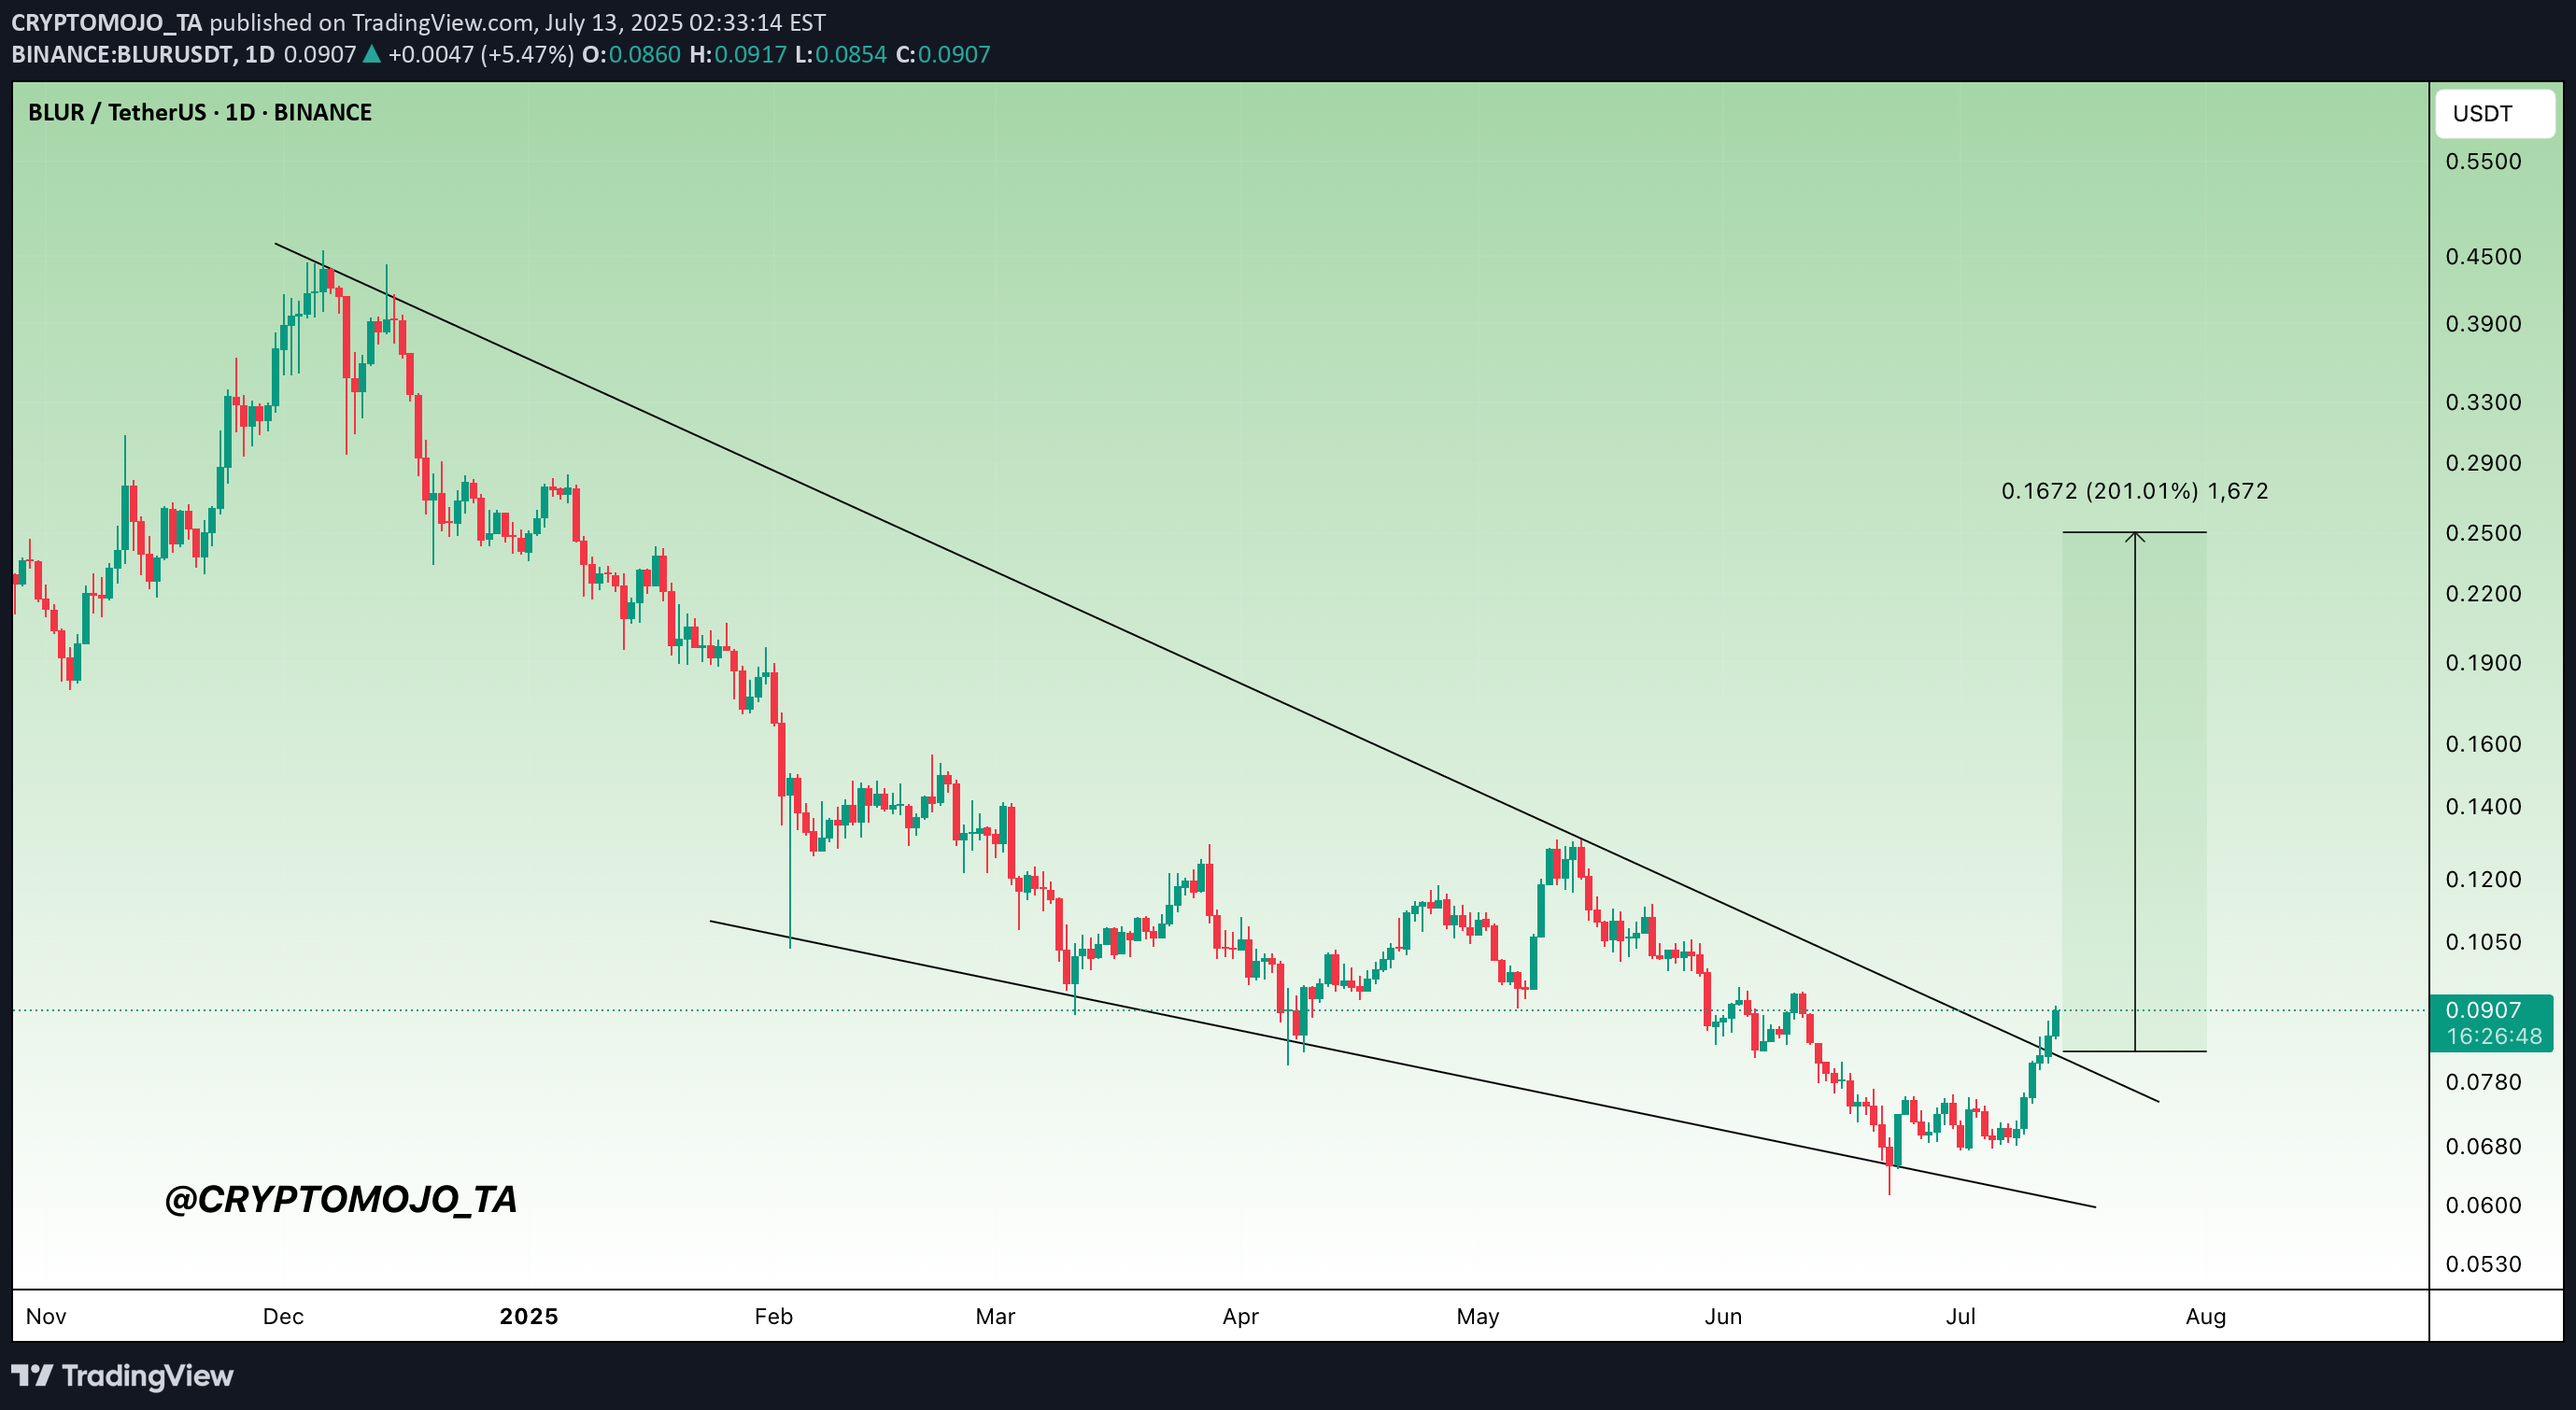
B BLUR looks good! It looks extremely bullish for the midterm, expecting a 2x bullish rally. 📈

behdark
BLUR IS Super Bullish (2D)

It seems that the price is moving within a diametric pattern, and based on the 3D timeframe, along with the break of the trendline, wave E appears to be completed. The price is now entering wave F of this diametric, which is a bullish wave and could extend up to the red zone.A key level has also been reclaimed, which further strengthens the bullish outlook.Targets are marked on the chart.The analysis will be invalidated if a daily candle closes below the invalidation level.For risk management, please don't forget stop loss and capital managementComment if you have any questionsThank You

سیگنال آلفا کریپتو
⚜$BLUR/USDT 🛒 محدوده خرید: 0.095 - 0.109 ⚡️ تارگتها: 🎯T1: 0.115 🎯T2: 0.130 🎯T3: 0.145 🎯T4: 0.165 🎯T5: 0.190 🎯T6: 0.230 🔺️ حد ضرر: 0.082 💵 میزان سرمایه پیشنهادی: ۵ درصد از کل سرمایه 🔥 @Signal_Alpha 🔥

Finance City
تحلیل BLURUSDT / بهترین قیمت برای خرید ؟

🔍 چشمانداز KLYA: پس از یک روند نزولی طولانی و شکست سطح حمایتی تاریخی، اکنون وارد فاز نوسانی شده است. همزمان، قدرت و شتاب روند نزولی به وضوح در حال کاهش است که میتواند نشانهای از بازگشت یا تثبیت قیمت باشد. 📈 در تایم فریم روزانه: مقاومت کلیدی: محدوده ۰.۱۲۷ - ۰.۱۳۰ دلار این ناحیه بارها با واکنشهای قیمتی مواجه شده و نشاندهنده قدرت فروشندگان است. حمایت کلیدی: محدوده ۰.۰۸۰ - ۰.۰۸۳ دلار شکست این سطح، ریسک ادامه کاهش تا ۰.۰۷۰ دلار را به همراه داشت. ⏳ در تایم فریم ۴ ساعته: یک حمایت دینامیک، الگوی مثلث متقارن را شکل داده است. نقطه شکست صعودی: ۰.۱۰۰ دلار با شکست و تثبیت بالای این خط، احتمال حرکت به سمت مقاومت روزانه (۰.۱۲۷ دلار) افزایش مییابد. نقطه شکست نزولی: ۰.۰۹۳ دلار در صورت بسته شدن قیمت زیر این سطح حمایتی، میتوان موقعیت فروش (Short) باز کرد و هدف بعدی را در حمایت روزانه (۰.۰۸۰ دلار) جستجو کرد. 🎯 سناریوهای معاملاتی: سناریوی صعودی (لانگ): شرایط ورود: شکست و تثبیت قیمت بالای ۰.۱۰۰ دلار همراه با افزایش حجم معاملات. سناریوی نزولی (شورت): شرایط ورود: شکست و بستهشدن کندل ۴ ساعته زیر ۰.۰۹۳ دلار. 💡 نکات تکمیلی: شتاب نزولی در اندیکاتورهای مومنتوم (مانند MACD و RSI) کاهش یافته است. این نشانه آماده شدن بازار برای واکنش یا بازگشت است. همواره حجم معاملات را در نقاط شکست بررسی کنید؛ افزایش قابل توجه حجم، اعتبار سیگنال را افزایش میدهد. مدیریت ریسک را رعایت کرده و از استاپ لاسهای مناسب استفاده کنید، به ویژه با توجه به دامنه نوسانی فعلی. KLYA اکنون در نقطه تلاقی محرکهای تکنیکال و نیاز به تایید حجم قرار دارد. بسته به جهت شکست مثلث، میتوانید استراتژی مناسب خرید (Long) یا فروش (Short) را انتخاب کنید. موفقیت در معامله، نیازمند صبر برای تایید شکست و مدیریت دقیق ریسک است. موفق باشید!

AltcoinPiooners
BLUR Big Bullish is here

BLURUSDT Trend and Levels: The chart shows a downtrend from April 13 to 16, with the price dropping from around 0.1020 to 0.0944. A consolidation phase follows, with the price moving sideways between 0.0944 and 0.0977.Moving Averages: Two moving averages (likely 50-period and 200-period) are plotted. The price is currently between them, indicating indecision. The MAs are converging, which often precedes a breakout.Key Levels: Resistance is around 0.09615 (highlighted with a 3.48% potential gain if reached).Support is near 0.0944, where the price has bounced multiple times.A potential long entry is marked at 0.095875, with a target of 0.0645% above the entry.Trade Stats: The group’s trade stats show 120 trades with a 100% win rate, suggesting a strong track record, though this seems unusually high and may not reflect realistic performance.Price Action: The latest candlesticks show small-bodied candles with wicks on both sides, indicating a lack of strong directional momentum. The price is testing the upper moving average, which could act as resistance.Conclusion: The market is in a consolidation phase after a downtrend. A breakout above 0.09615 could signal a bullish move, while a drop below 0.0944 might lead to further downside. Watch for a decisive move past the moving averages for confirmation of direction.

Mas00d


Bitcoin & Altcoins Signals
Disclaimer
Any content and materials included in Sahmeto's website and official communication channels are a compilation of personal opinions and analyses and are not binding. They do not constitute any recommendation for buying, selling, entering or exiting the stock market and cryptocurrency market. Also, all news and analyses included in the website and channels are merely republished information from official and unofficial domestic and foreign sources, and it is obvious that users of the said content are responsible for following up and ensuring the authenticity and accuracy of the materials. Therefore, while disclaiming responsibility, it is declared that the responsibility for any decision-making, action, and potential profit and loss in the capital market and cryptocurrency market lies with the trader.