
BCH
Bitcoin Cash
| تریدر | نوع سیگنال | حد سود/ضرر | زمان انتشار | مشاهده پیام |
|---|---|---|---|---|
 JuliiaRank: 141 | خرید | حد سود: تعیین نشده حد ضرر: تعیین نشده | 12/14/2025 | |
FxProRank: 1723 | خرید | حد سود: تعیین نشده حد ضرر: تعیین نشده | 6 hour ago | |
 tomas_jntxRank: 3933 | خرید | حد سود: تعیین نشده حد ضرر: تعیین نشده | 12/15/2025 | |
 c_viewsRank: 16050 | خرید | حد سود: تعیین نشده حد ضرر: تعیین نشده | 12/6/2025 | |
 SwallowAcademyRank: 30684 | خرید | حد سود: تعیین نشده حد ضرر: تعیین نشده | 12/17/2025 |
Price Chart of Bitcoin Cash
سود 3 Months :
خلاصه سیگنالهای Bitcoin Cash
سیگنالهای Bitcoin Cash
Filter
Sort messages by
Trader Type
Time Frame

ydnldn
NLDN | BCHUSDT rising
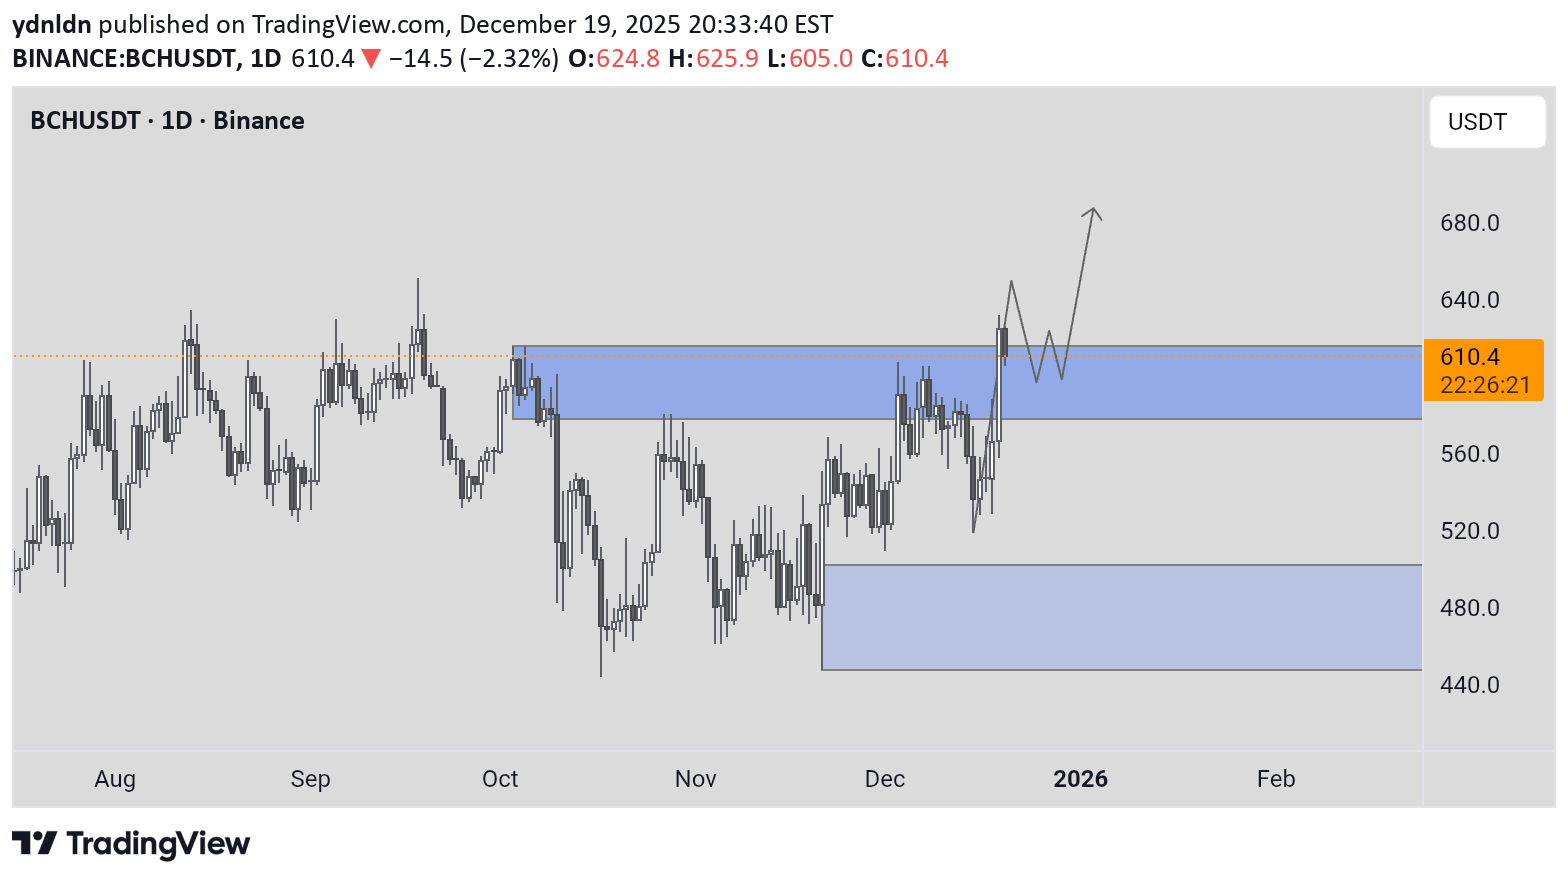
Sentiment: Bullish (Optimistic). Current Condition: Price is at a crucial breakout point at the $610 resistance area. Recommended Chart Strategy: Wait for confirmation that the price is stable above the blue zone (610-620) before targeting a higher price target. Risk: If it fails to break through this zone, the price could potentially fall again to find a foothold in the lower support area. Should you find this analysis insightful, I invite you to like or leave a comment. Constructive feedback and suggestions are greatly appreciated. For further analyses, please follow me at @ydnldn.
FxPro
Bitcoin Cash Wave Analysis – 19 December 2025
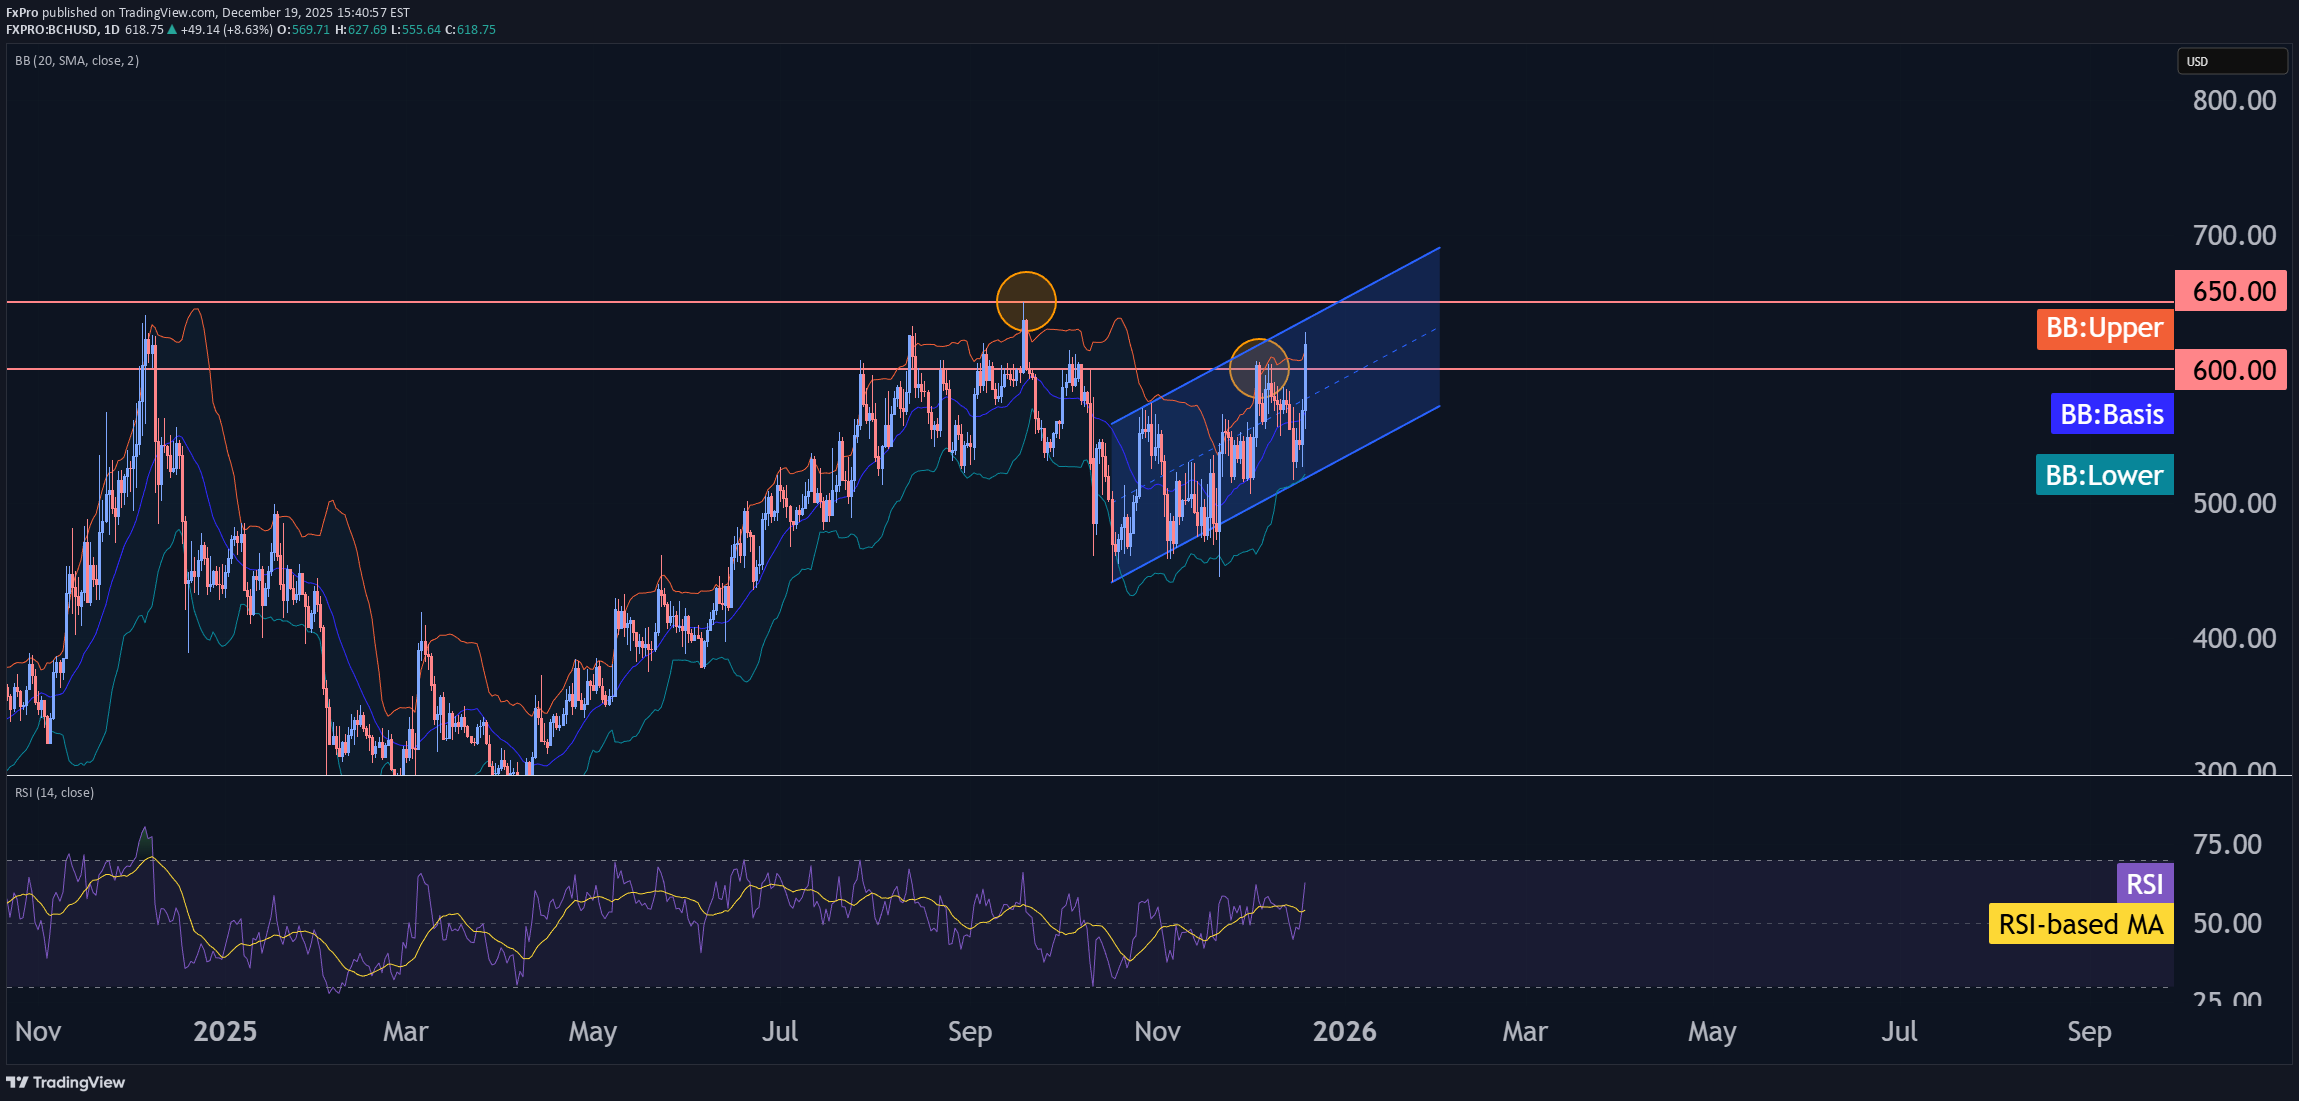
- Bitcoin Cash broke resistance area - Likely to rise to resistance level 650.00 Bitcoin Cash cryptocurrency recently broke the resistance area between the round resistance level 600.00 (which stopped earlier waves B and 1) and the resistance trendline of the daily up channel from October. The breakout of the resistance area accelerated the active impulse waves 3 and (3). Bitcoin Cash cryptocurrency can be expected to rise to the next resistance level 650.00 (former multi-month high from September, which stopped earlier wave (1)).

Bitcoin Cash looks like it wants to pop to at least 1200...
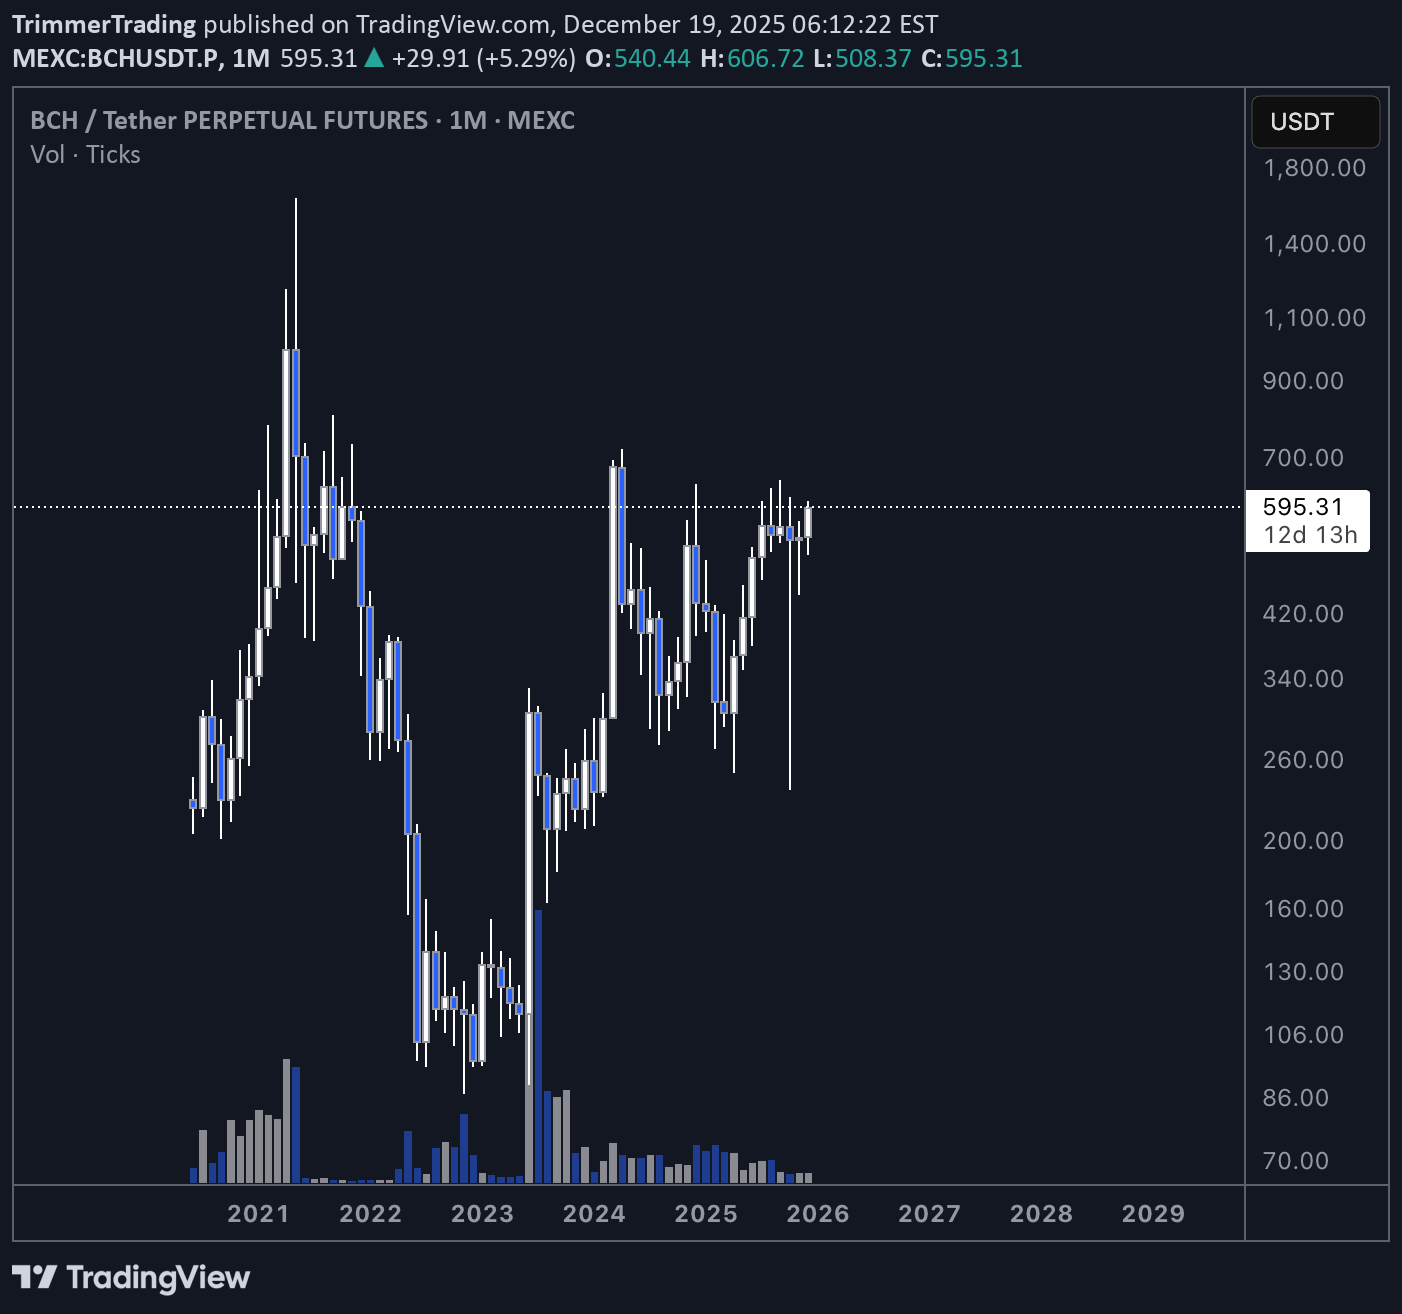
Trending Direction: Up Strategy: This would be an impulse consolidate impulse, after a liquidity grab Fundamentals: Tokenomics is the same as bitcoin, it's not a scam coin, been around for years, has great volume, and will have an etf approved very shortly its not scam. M1: Looks like a clear up trend and very bullish candles W1: Prior week not closed, but I like the price action, theres a clear failed lower low. D1:Looks super strong and ready to push out Target and SL: Initial target would be around 1200 but this has legs to go to prior ath of around 4200 Target has been extrapolated using fib extensions SL is just under the M1 candle lots of room and even if liq grab should be good Management: Will move SL to break even at 1:1 677.66 I will assess at 1200 but this has room to go much further to around 1600 or even prior ath of 4200... Emotion pre trade: Honestly a bit upset, I had such a good entry on this trade, where I would make the same amount of money only risking $300 and it was stop at break even and now I am risking $1000 to make the same more. I think this is a very good trade and set up maby I am chasing or risking too much but the stop loss is very wide and the set up is ticking all the boxes, so If I loose I loose within my risk tolerance and I am okay with this. Initially I was risking 1.4k but I scaled down because It was too much. If I have to wait 3 months for make around 7k thats okay for me. Emotions in trade: Just going set and forget, this is a long term trade so my work is done. DISCLAIMER: I am not a financial adviser. Investing and trading is risky, and you can lose your money. The information in this video should not be used to make any investment decisions. You should contact a licensed financial adviser prior to making any investment decisions. Any affiliate links in the description of these videos may provide a commission if you decide to purchase their products. I appreciate any and all support of my channel, and without you, I wouldn't be here. Thank you.
BCH
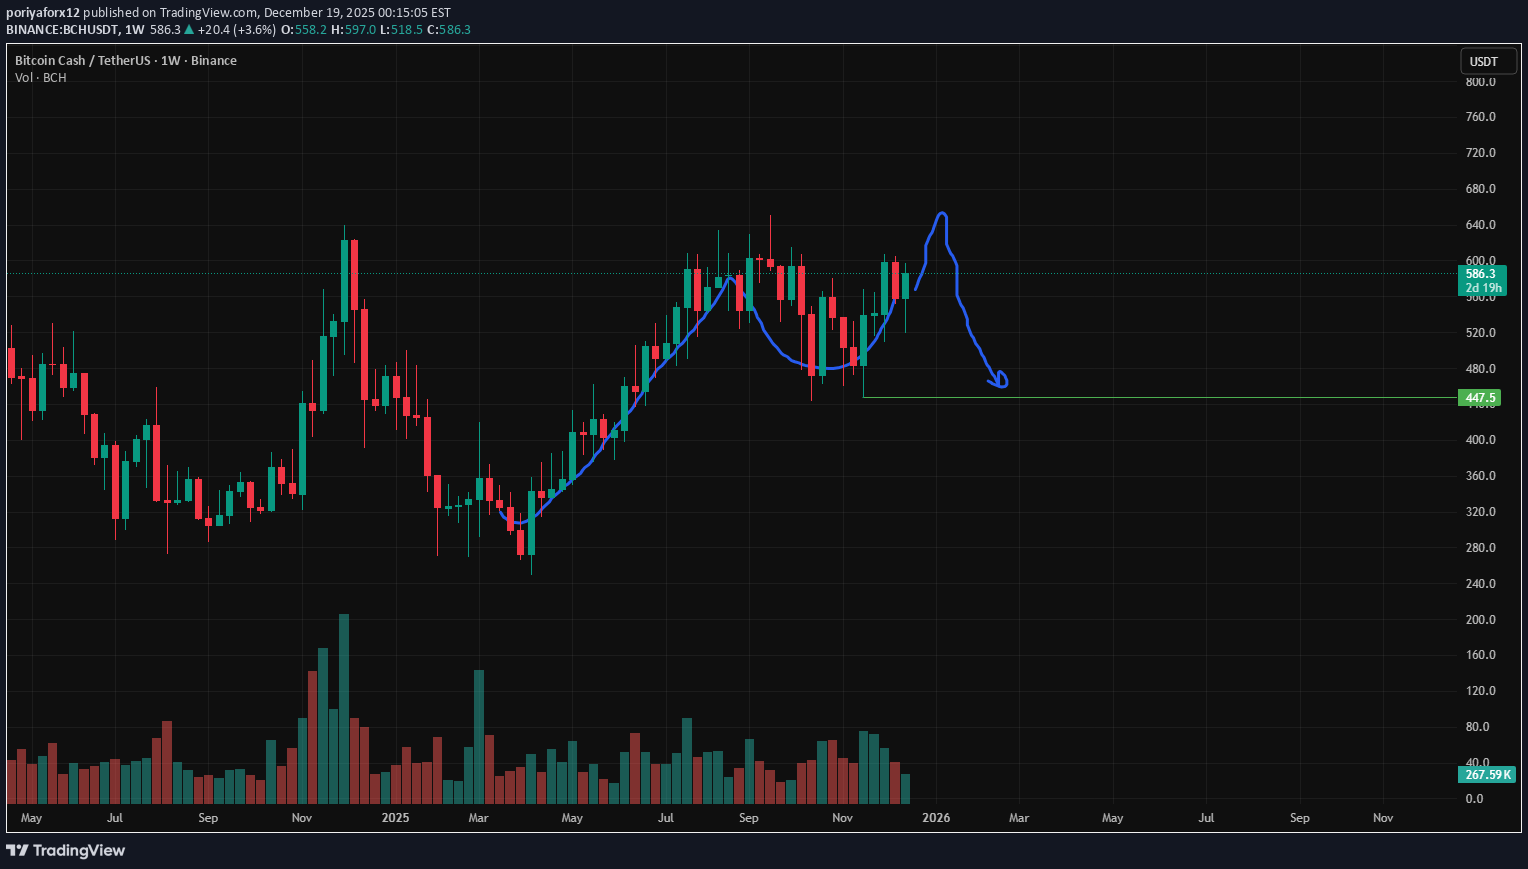
I expect Bitcoin Cash to make a 25% correction from this level. This is the first flag, and it may not correct here and instead wait for the second flag, then pull back to the level I’ve marked. The analysis is based on a strategy called NDS.On the other hand, it also has a Bitcoin trading pair.Oops, I overlooked one thing. Tether dominance is set up for a sharp drop, and it could invalidate all the previous analyses.
SwallowAcademy
Bitcoin Cash (BCH): Waiting For Break of Neckline Zone | Bullish
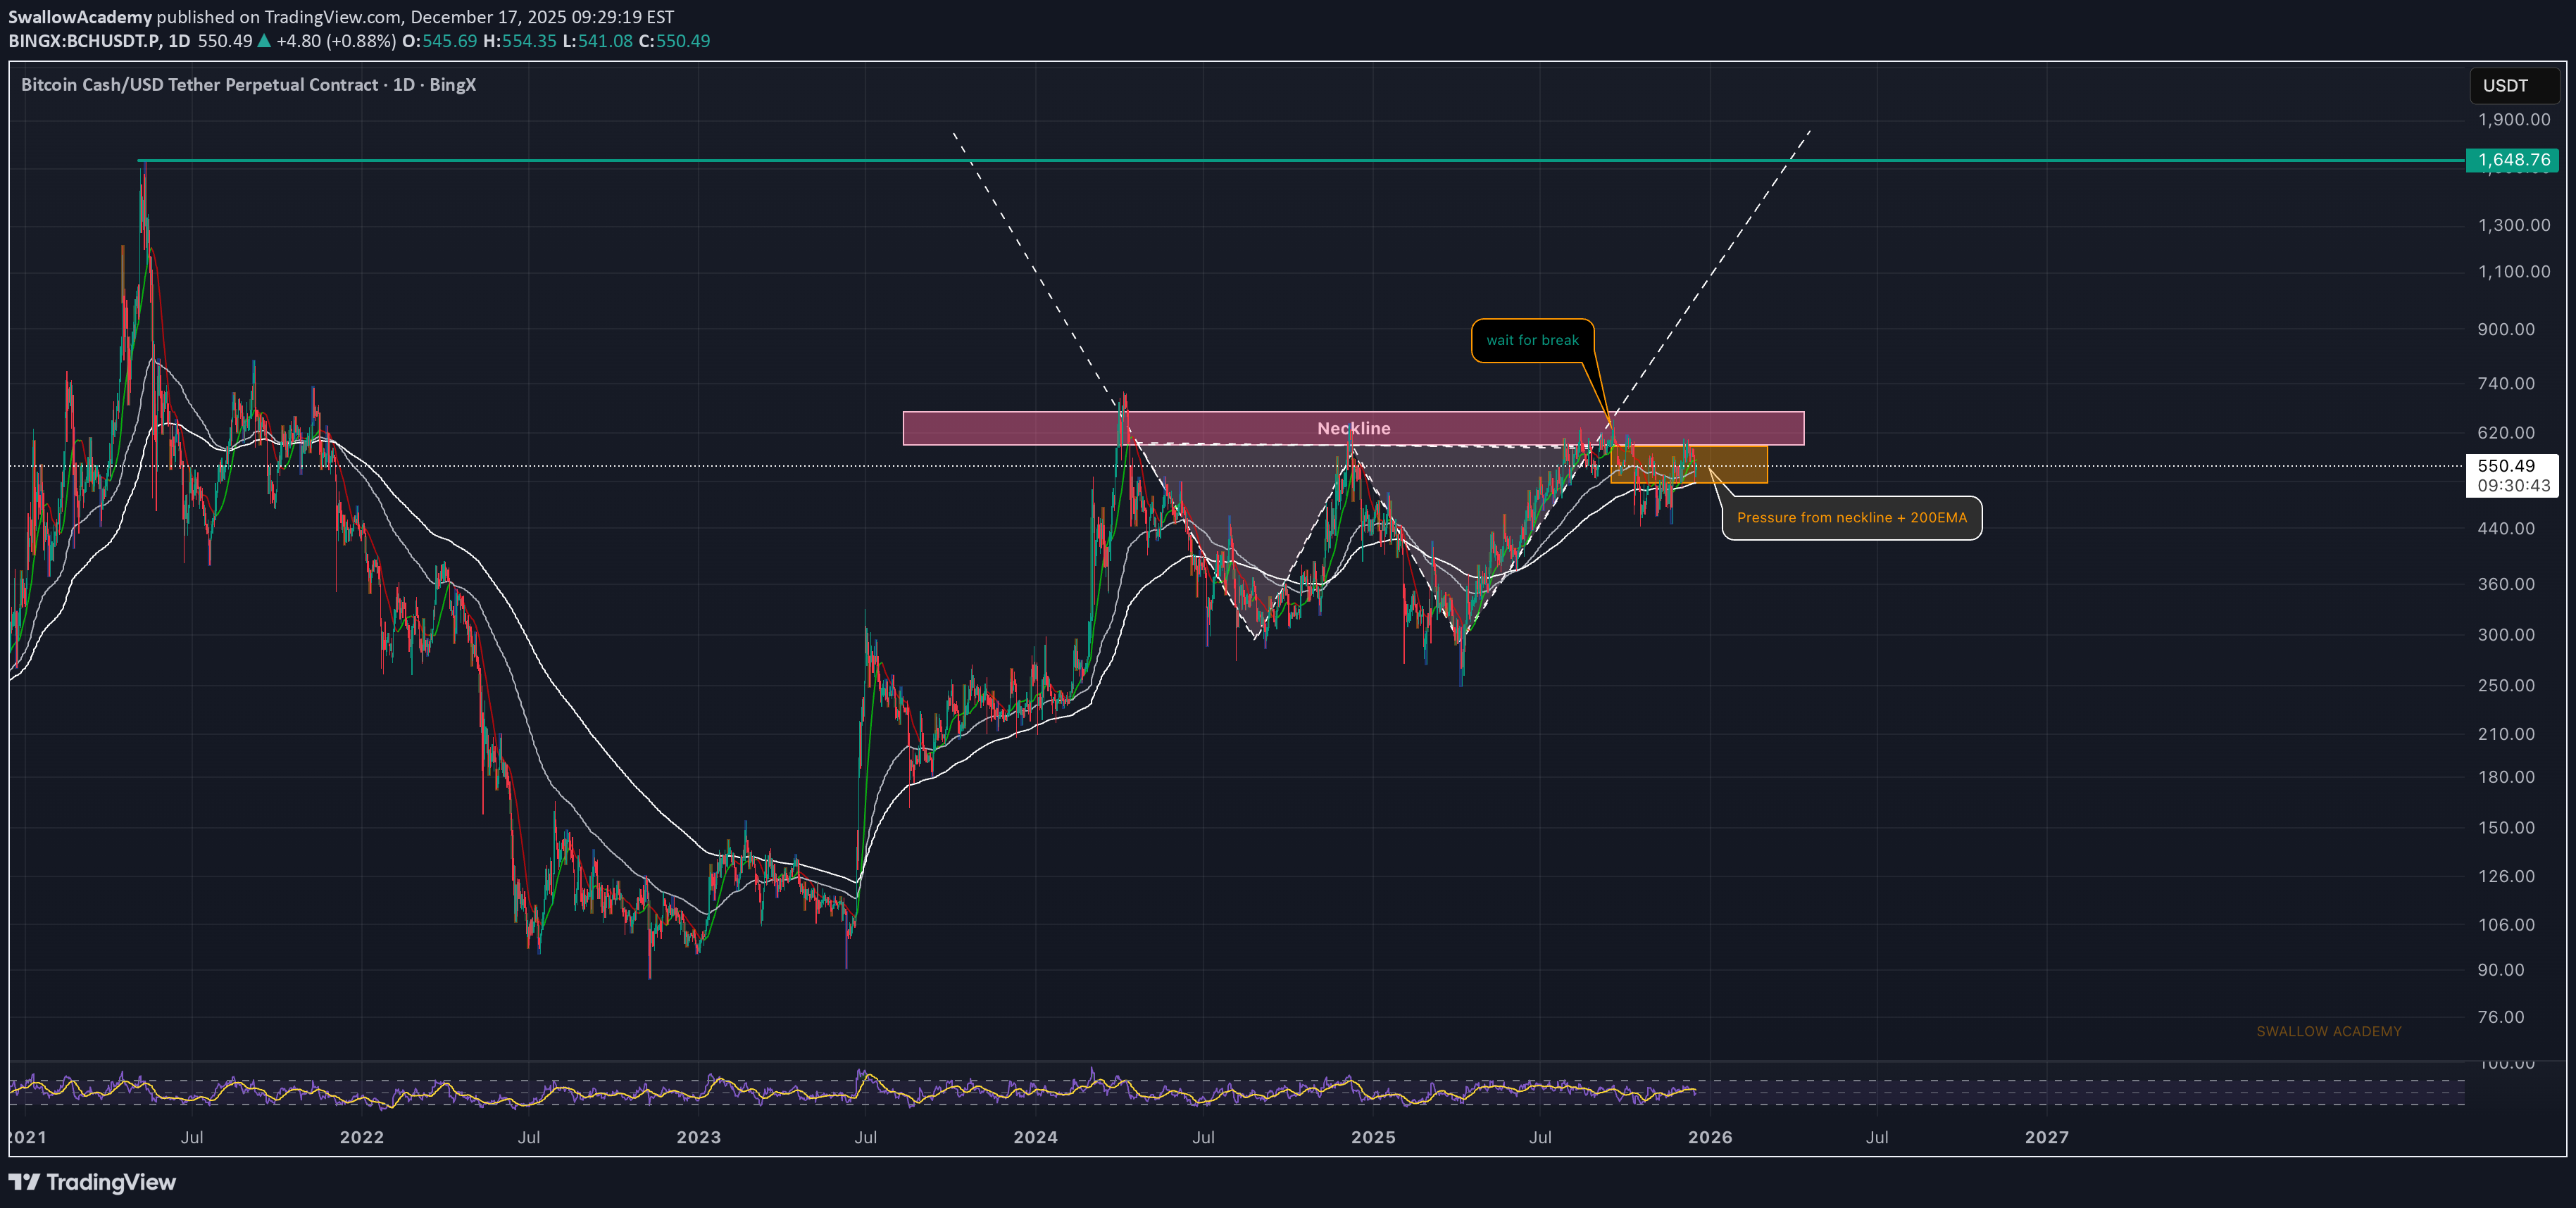
BCH has formed a clear W pattern and the neckline zone is now the key level. Usually once this kind of neckline gets respected enough, price ends up trying to break it, so that’s the main thing on watch. Right now the “breakout stage” is choppy, but that’s not a bad thing — we’re basically building a pressure zone between the neckline and the 200 EMA (stronger white line). If buyers manage to reclaim the neckline and hold above it, then we look for a clean continuation move from there. Until that happens, it’s still a wait for confirmation spot, because the 200 EMA is still capping price. Swallow Academy

iMoneyTeam
BCH Sell/Short Signal (1H)
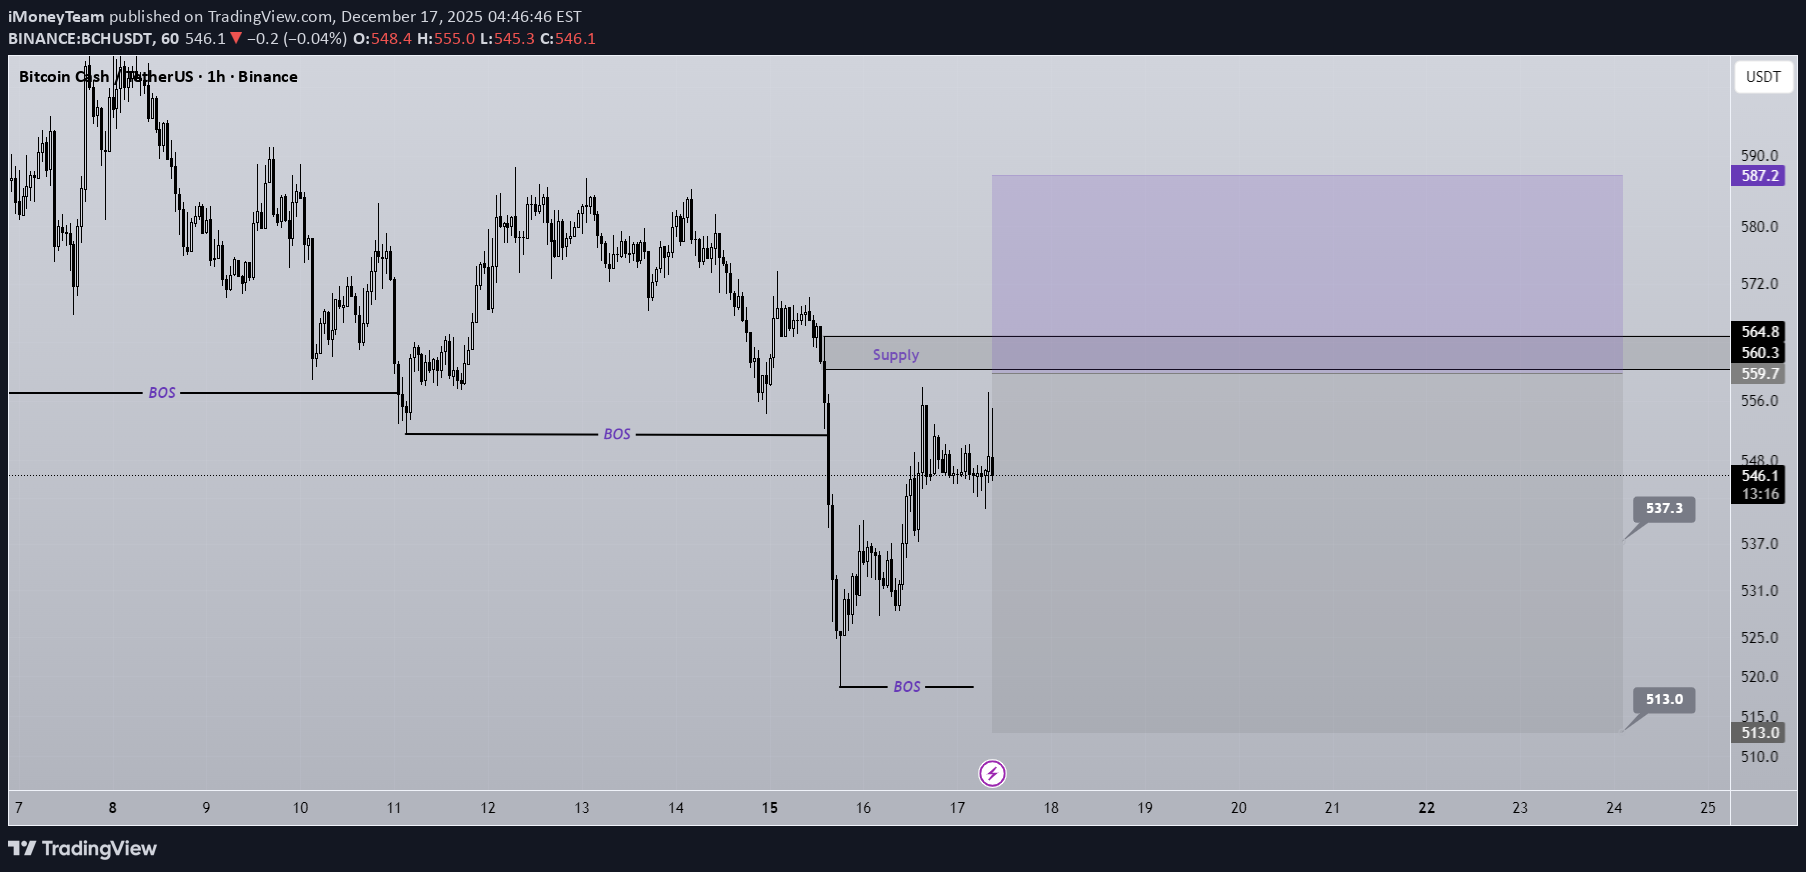
Add this symbol to your watchlist and enter the position once it reaches the entry zone. Considering that BCH is in a bearish structure on the hourly timeframes, we are looking for sell/short opportunities at order blocks and origin zones. We have identified two targets. At the first target, secure partial profits and then move the position to break-even. Do not enter the position without capital management and stop setting Comment if you have any questions thank youThe first target has been hit .
tomas_jntx
BCH Grinds at Resistance After MSB – Pullback or Breakout?
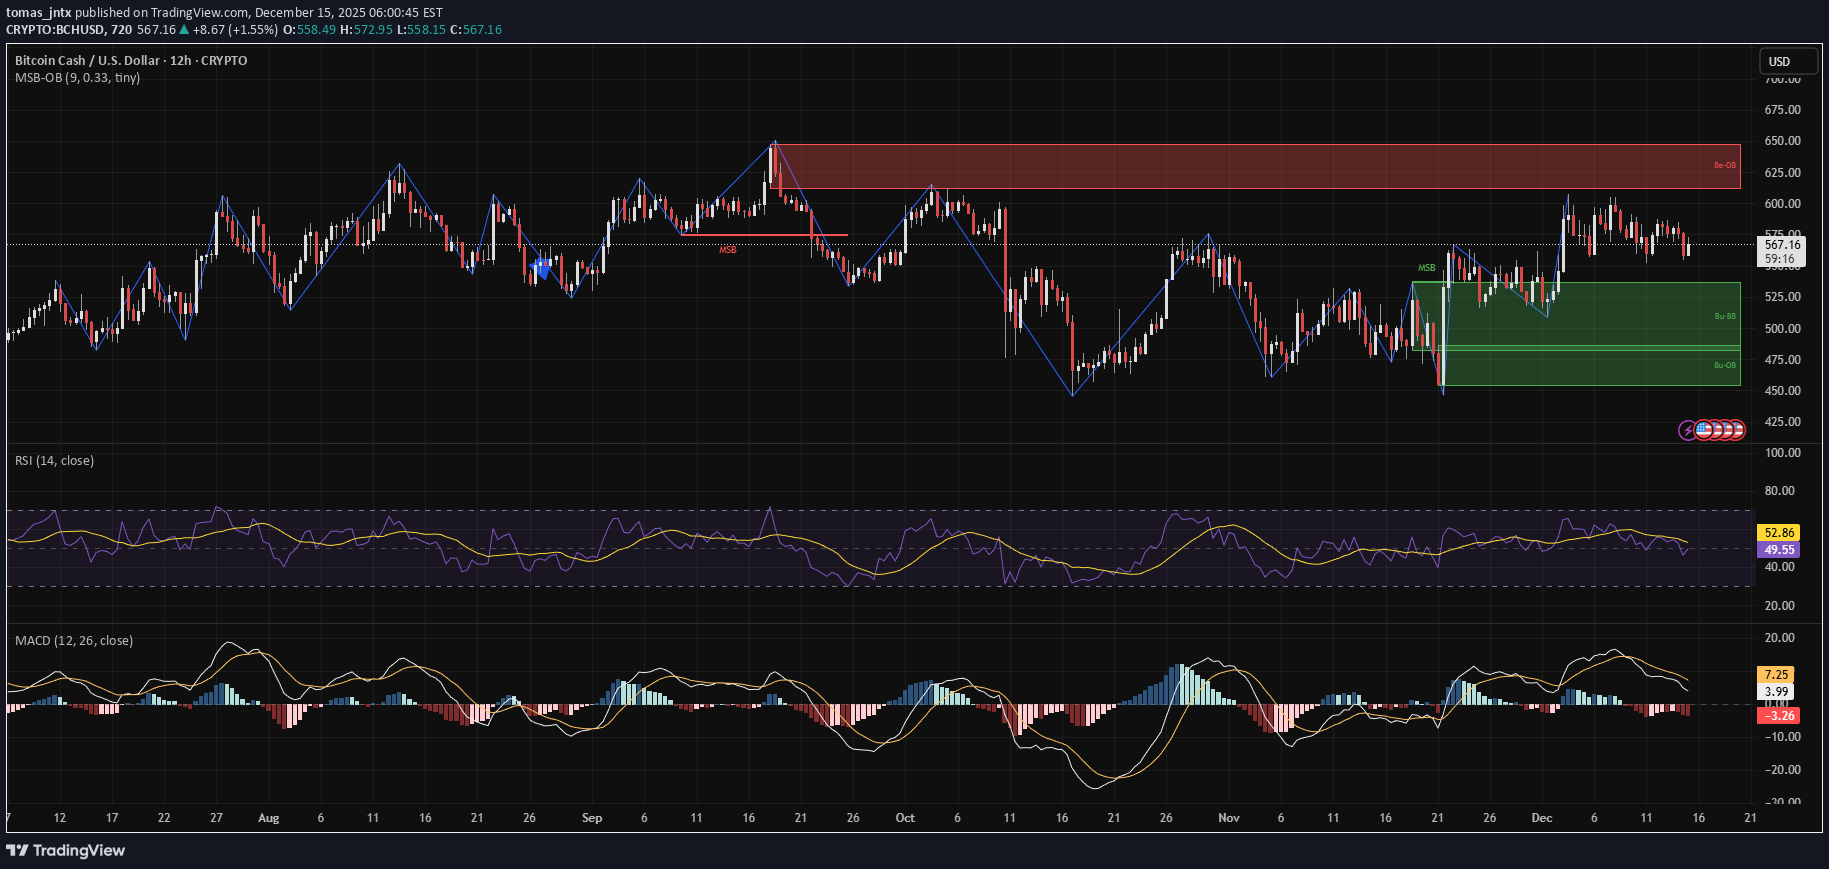
Trend Check: BCH flipped bullish with a clean MSB and rallied into the $620–$660 supply zone. It’s now consolidating right below resistance, testing buyers’ strength. Indicators: RSI: 52 (neutral to slightly bullish) MACD: Weakening from highs, potential momentum loss Structure: After the bullish MSB, BCH rallied off demand and is holding the reclaimed $525–$545 zone. But price now faces major resistance above. Position: Long bias Entry Idea: Long on break above $580 Stop: Below $545 Targets: $620 → $665 Reasoning: If bulls break above consolidation, continuation to retest supply is likely. However, MACD is cooling — caution warranted on false breakouts.

VishalBudhrani
BCHUSD Potential path ways - {15/12/2025}
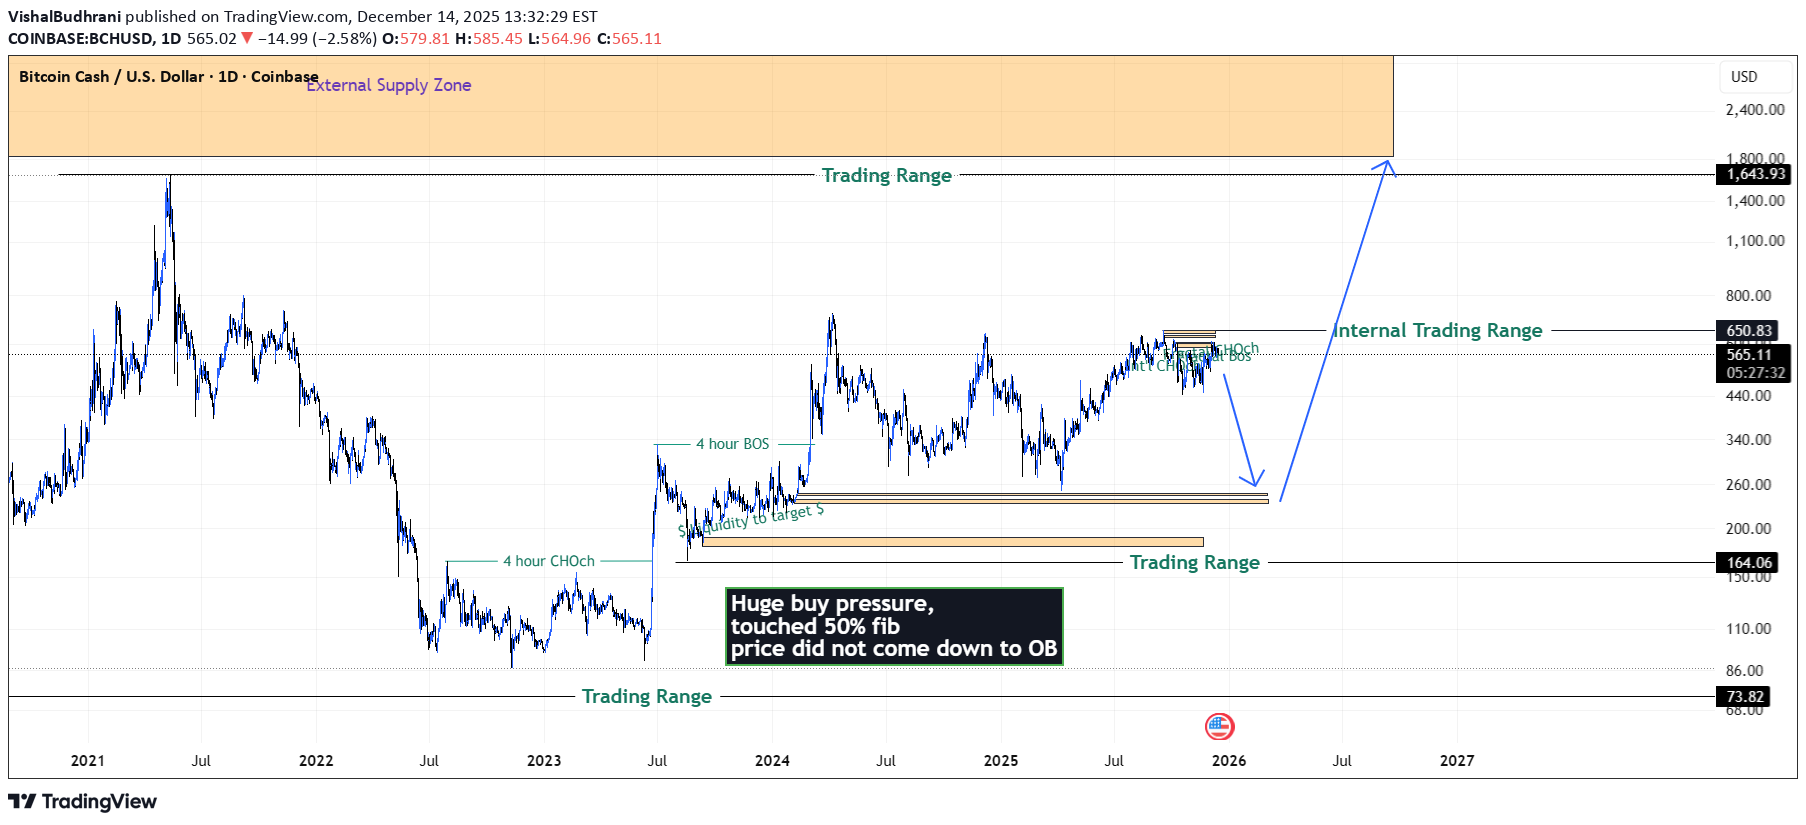
Educational Analysis says that BCHUSD (Crypto Pair) may give trend Trading opportunities from this range, according to my technical analysis. Broker - Bitstamp So, my analysis is based on a top-down approach from weekly to trend range to internal trend range. So my analysis comprises of two structures: 1) Break of structure on weekly range and 2) Trading Range to fill the remaining fair value gap Let's see what this Crypto Pair brings to the table for us in the future. DISCLAIMER:- This is not an entry signal. THIS IS FOR EDUCATIONAL PURPOSES ONLY. I HAVE NO CONCERNS WITH YOUR PROFITS OR LOSS, Happy Trading, FX Pairs & Crypto Curreny Trade Analysis. My Analysis is:- Short term trend may be go to the external demand zone. Long term trend breaks the new high after going from discount zone.
Juliia
BCH/USDT Long Set-up
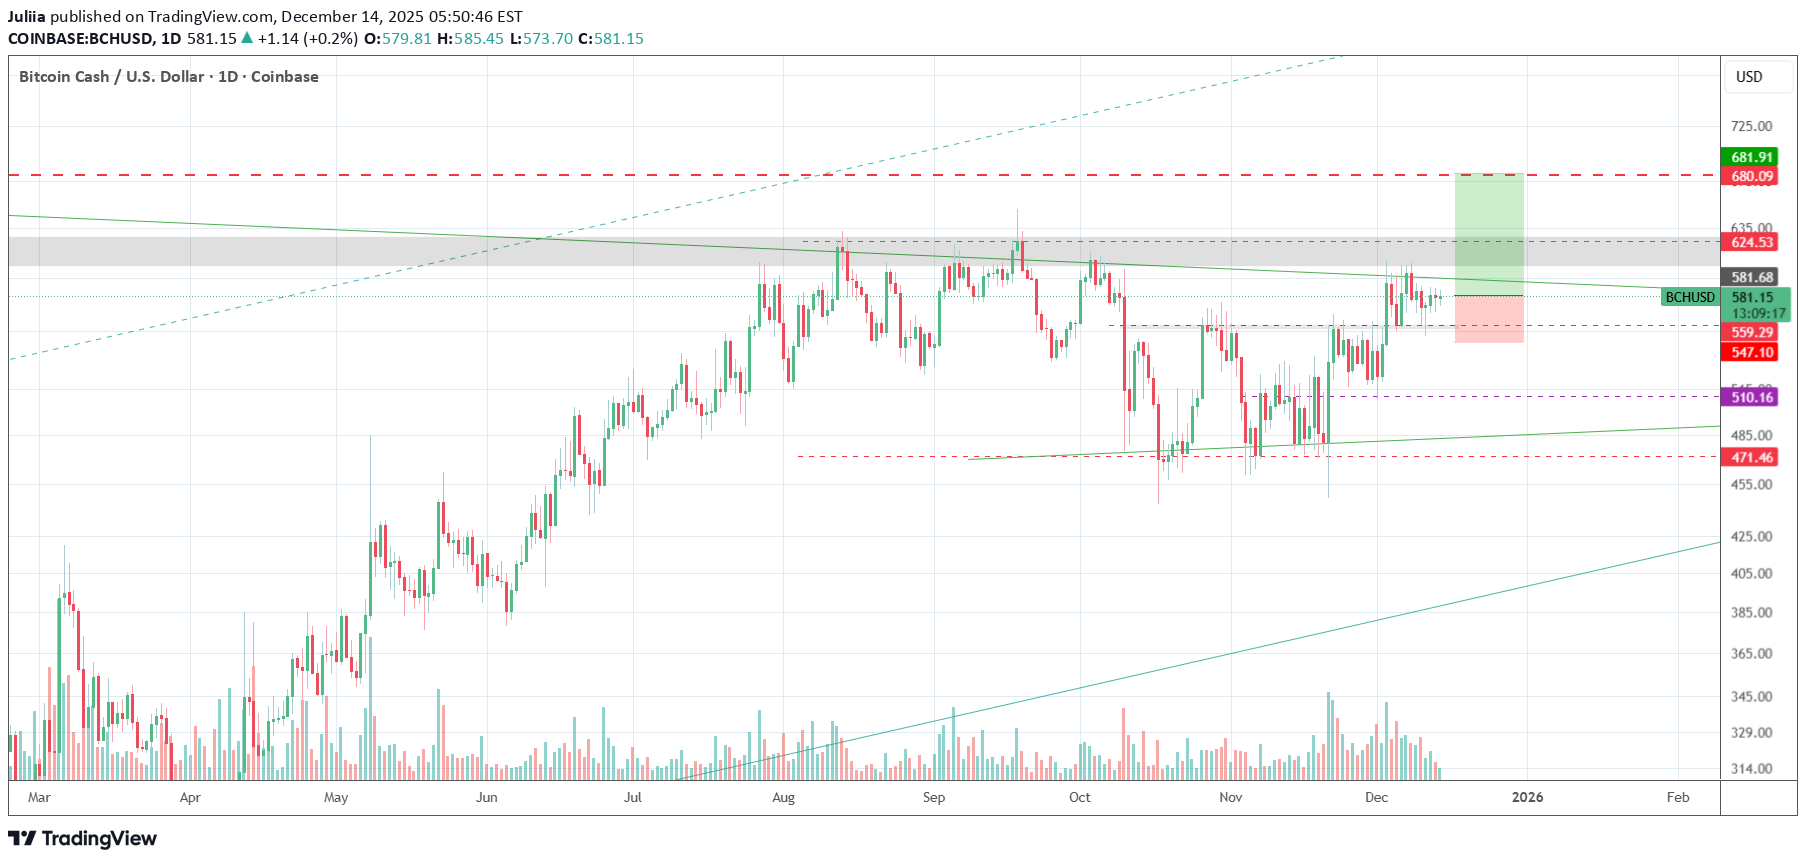
— Compression near a key resistance level, triangle continuation pattern forming, price holding above the MA50/200 crossover — Entry: $581 Market Buy — Stop: $545 — 6% price movement from entry to stop (this is price movement, NOT account loss) — Target: $680 Risk per trade: 1% of total deposit (actual account risk) Position size: 15% of total deposit, 10x leverage RR: 1:3

CaptBlackBeard
BCH DWEB Node trend chart.
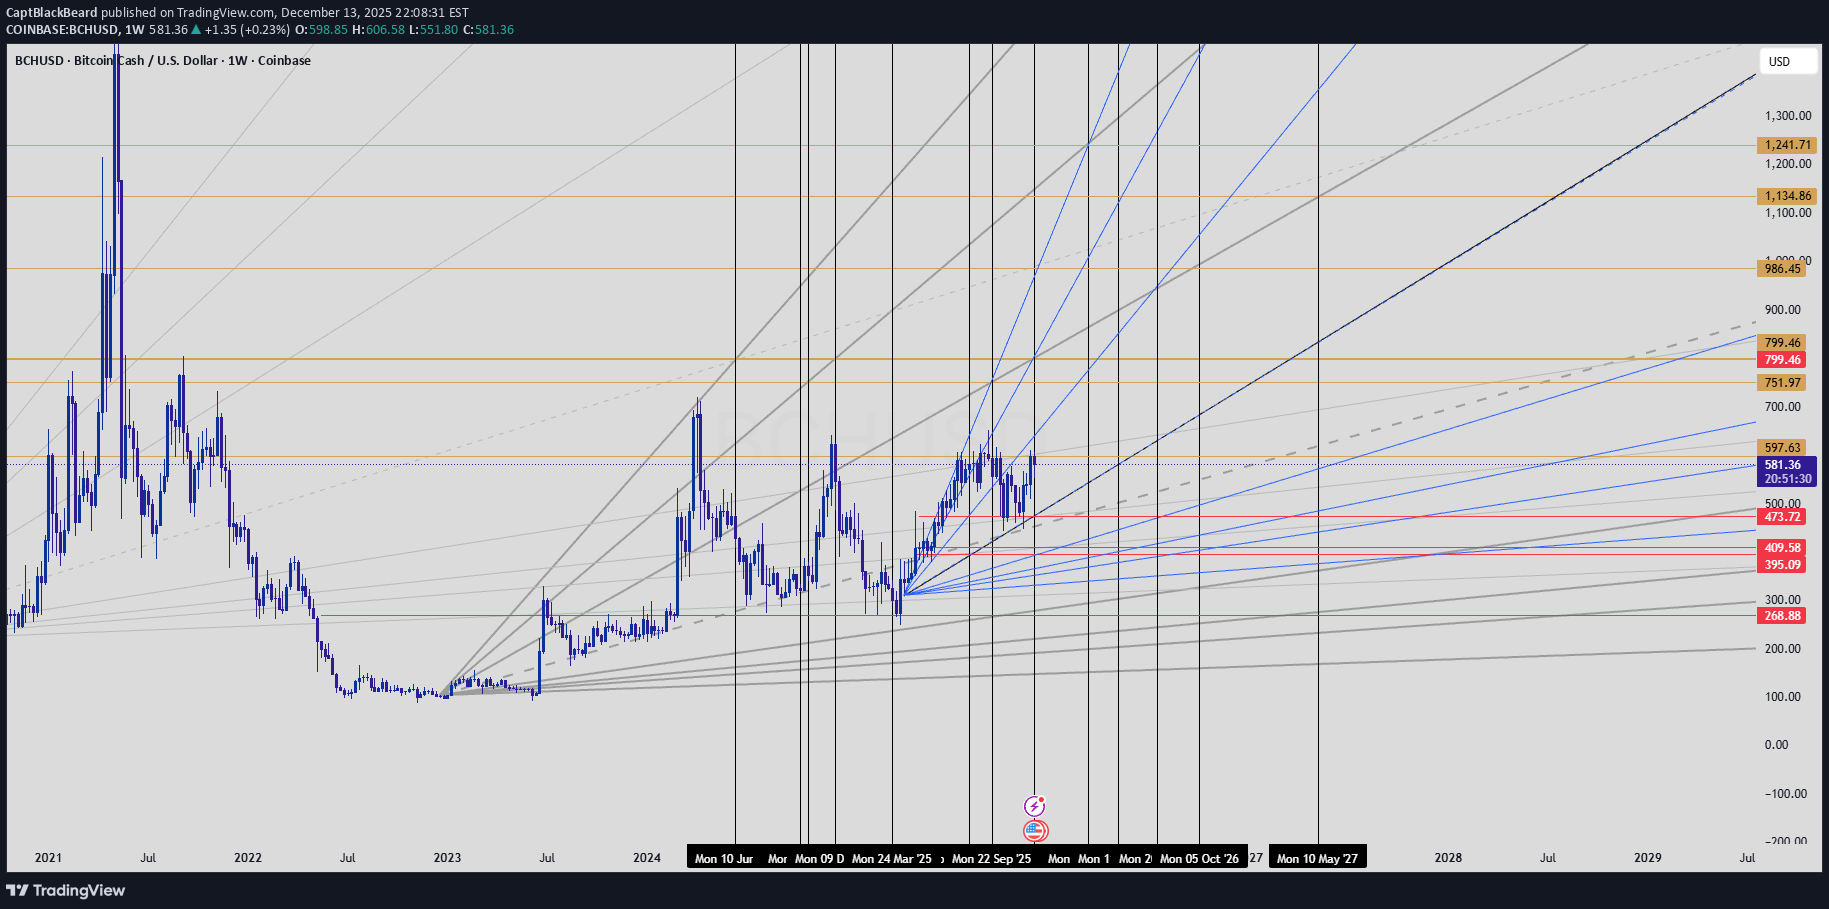
Gann fans made with DWEB trends, intersections marked for potential pivots along with important levels if it get bullish. Use the Gann fans (in-place) as trends if it fails here. One step at a time
Disclaimer
Any content and materials included in Sahmeto's website and official communication channels are a compilation of personal opinions and analyses and are not binding. They do not constitute any recommendation for buying, selling, entering or exiting the stock market and cryptocurrency market. Also, all news and analyses included in the website and channels are merely republished information from official and unofficial domestic and foreign sources, and it is obvious that users of the said content are responsible for following up and ensuring the authenticity and accuracy of the materials. Therefore, while disclaiming responsibility, it is declared that the responsibility for any decision-making, action, and potential profit and loss in the capital market and cryptocurrency market lies with the trader.