
BAT
Basic Attention Token

Price Chart of Basic Attention Token
سود 3 Months :
سیگنالهای Basic Attention Token
Filter
Sort messages by
Trader Type
Time Frame

behdark
BAT Analysis (4H)
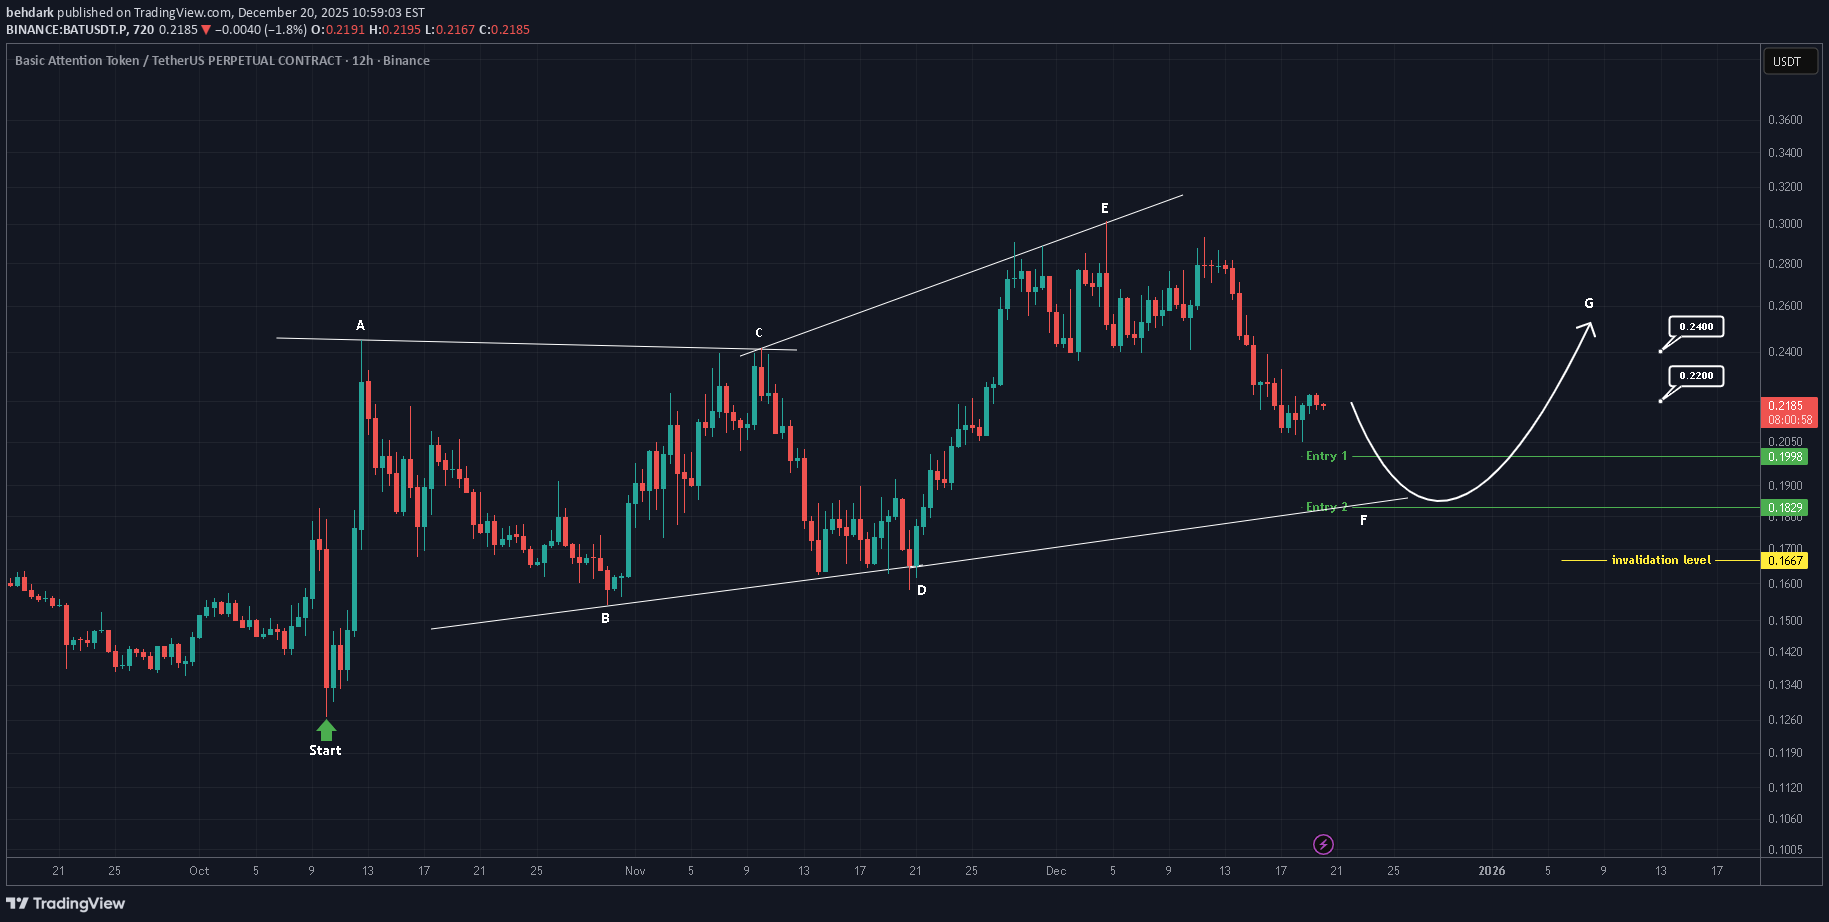
From the point we marked as the start, BAT appears to have entered a bullish diametric pattern. It now seems to be in wave F, which is a bearish wave. We have identified two entry points for BAT, where positions can be opened using a DCA approach. The targets have been marked on the chart. A daily candle close below the invalidation level will invalidate this analysis. For risk management, please don't forget stop loss and capital management When we reach the first target, save some profit and then change the stop to entry Comment if you have any questions Thank You

Alireza_kamali
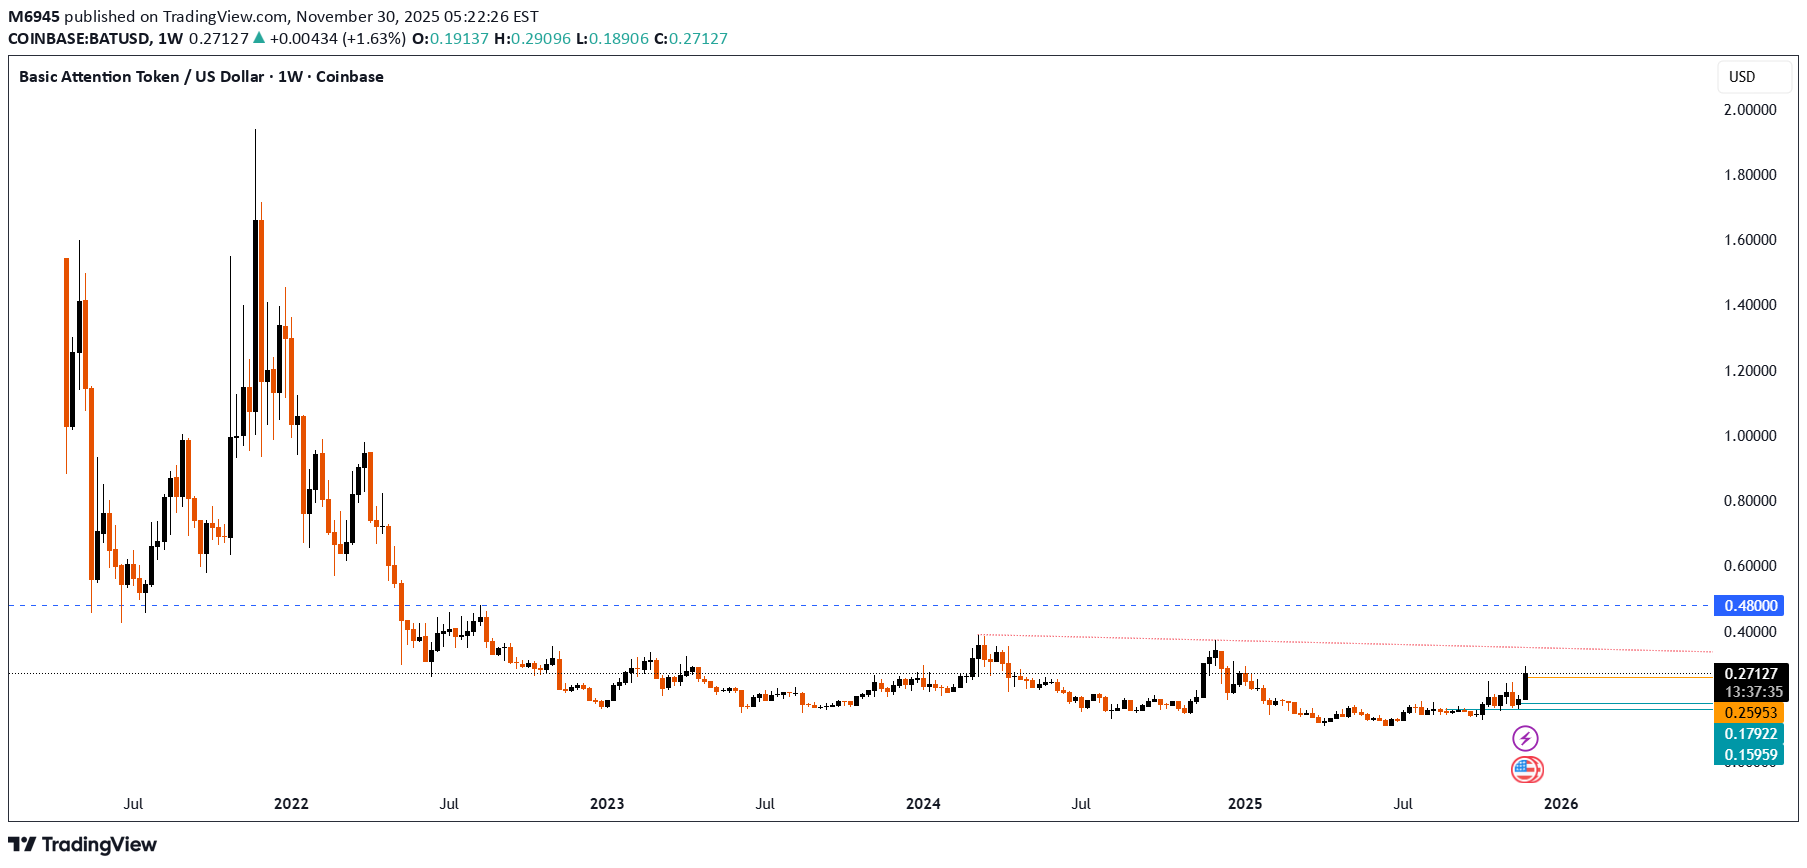
$BAT 1W
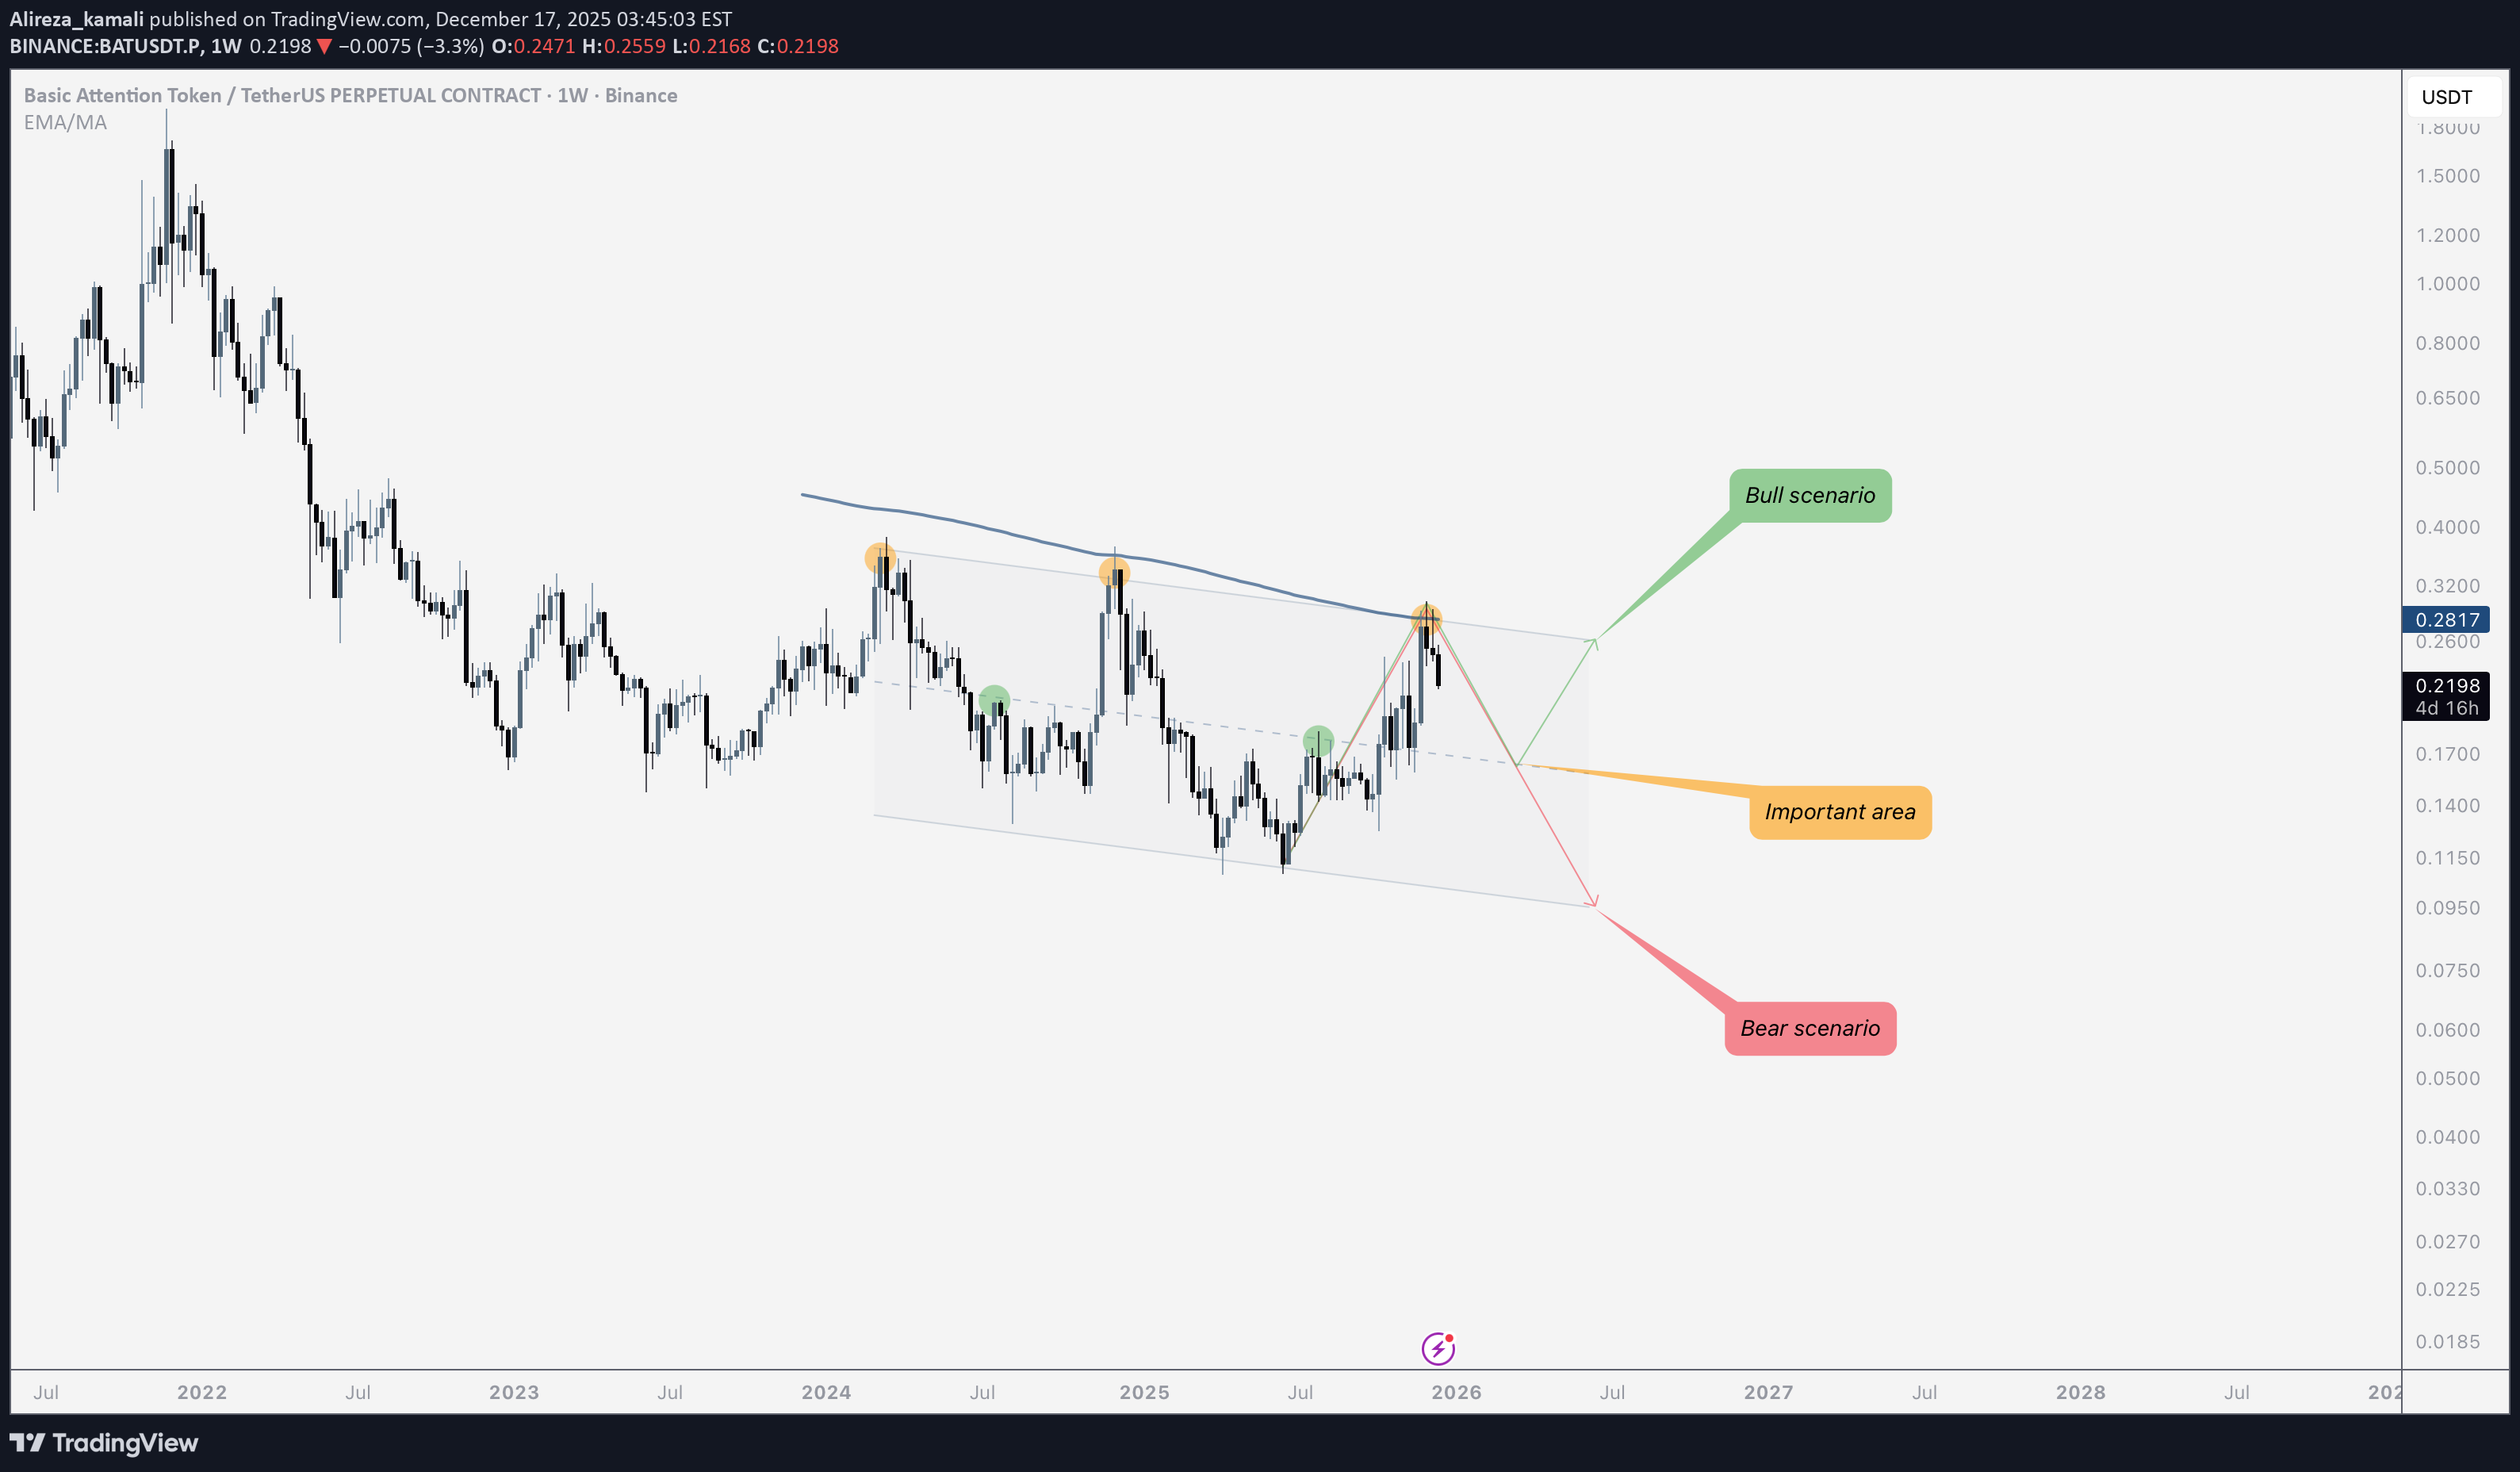
The BAT in the weekly timeframe is in a downtrend and is trading within a descending channel. The price is forming lower highs and lower lows. The channel's midline is a critical and important level, which could create a bullish bounce. However, if it breaks below this level, a price drop to the channel's bottom is anticipated.

readCrypto
آیا BATUSDT از حمایت ۰.۲۵۵۸ رالی میکند؟ شانس صعود تا ۰.۸۳۵۷!
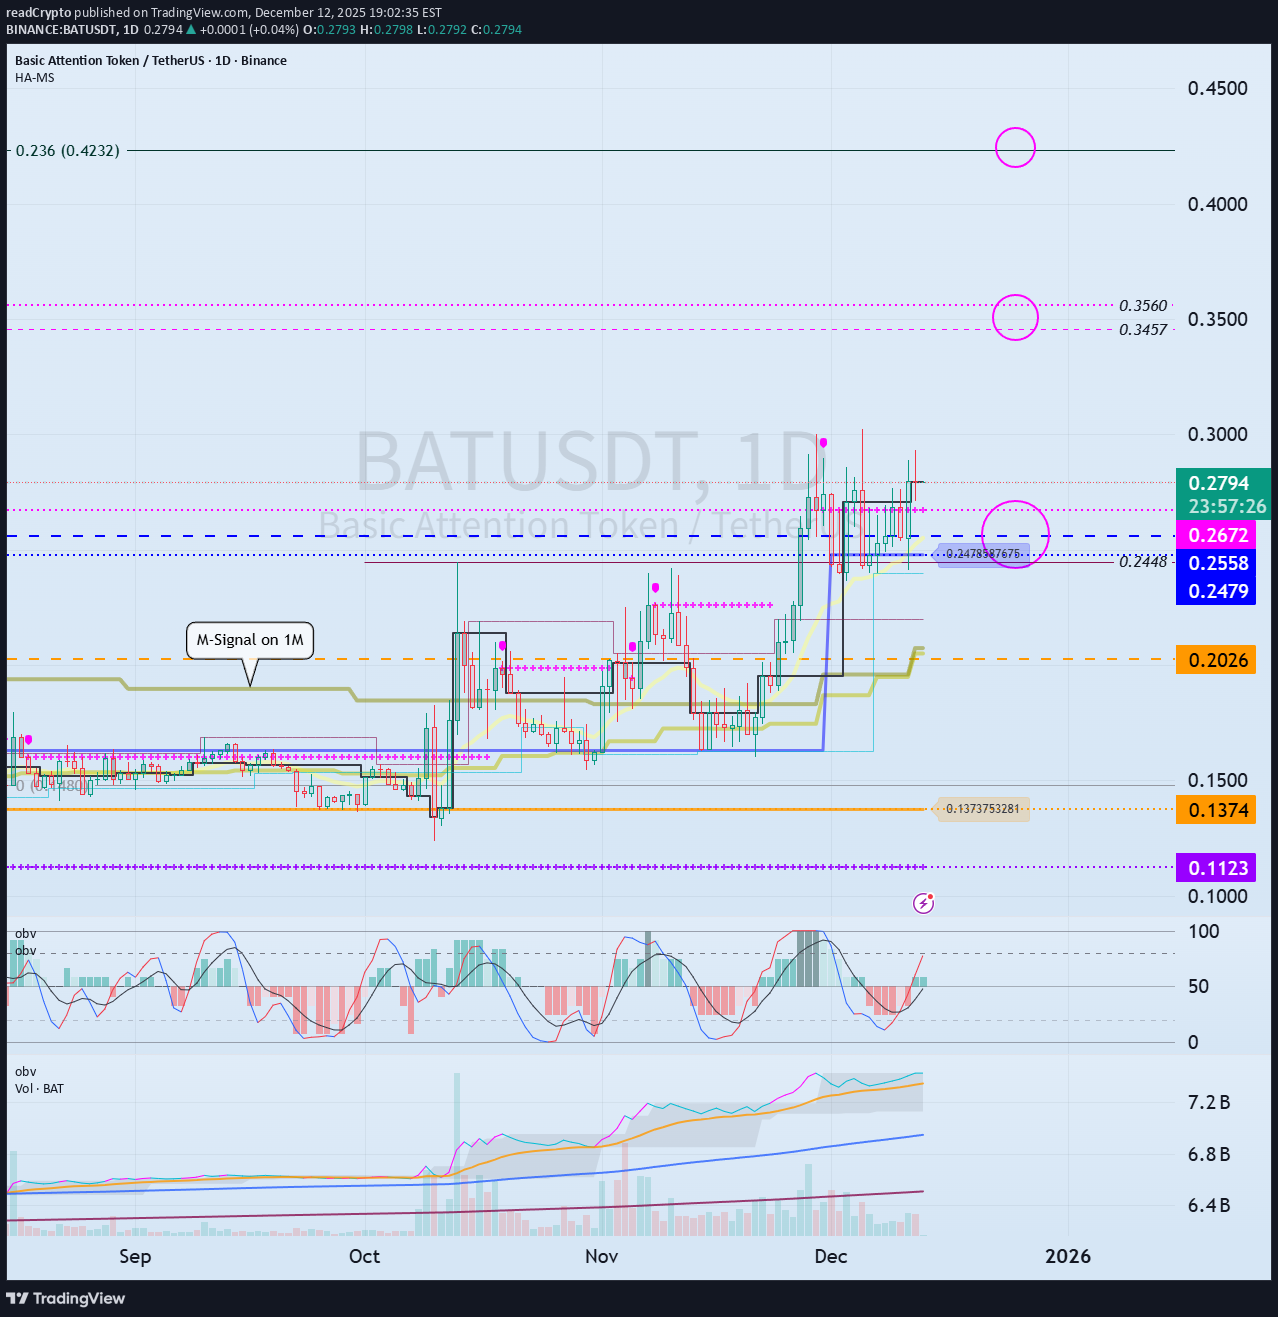
Hello, fellow traders! Follow us to get the latest updates quickly. Have a great day! ------------------------------------- (BATUSDT 1M Chart) After a significant decline, the price is forming a close above the M-Signal indicator on the 1M chart. Accordingly, if the price remains above the M-Signal indicator on the 1M chart, the long-term uptrend is expected to continue. Since the StochRSI 80 indicator is forming at 0.2448, we should examine whether it finds support near this level and can rise. A full-scale uptrend is likely to begin when it rises above the Fibonacci level of 0.236 (0.4232). If a full-scale uptrend begins, the target point is around 0.8357. - (1D chart) Therefore, the key question is whether it can find support near the 0.2479-0.2672 range and rise above 0.3457-0.3560. If it declines, we should examine whether support is found near the M-Signal indicator on the 1M chart. Therefore, support around 0.2026 is crucial. - Thank you for reading to the end. I wish you successful trading. --------------------------------------------------

CryptoSkullSignal
$BAT finally pushed through the descending channel
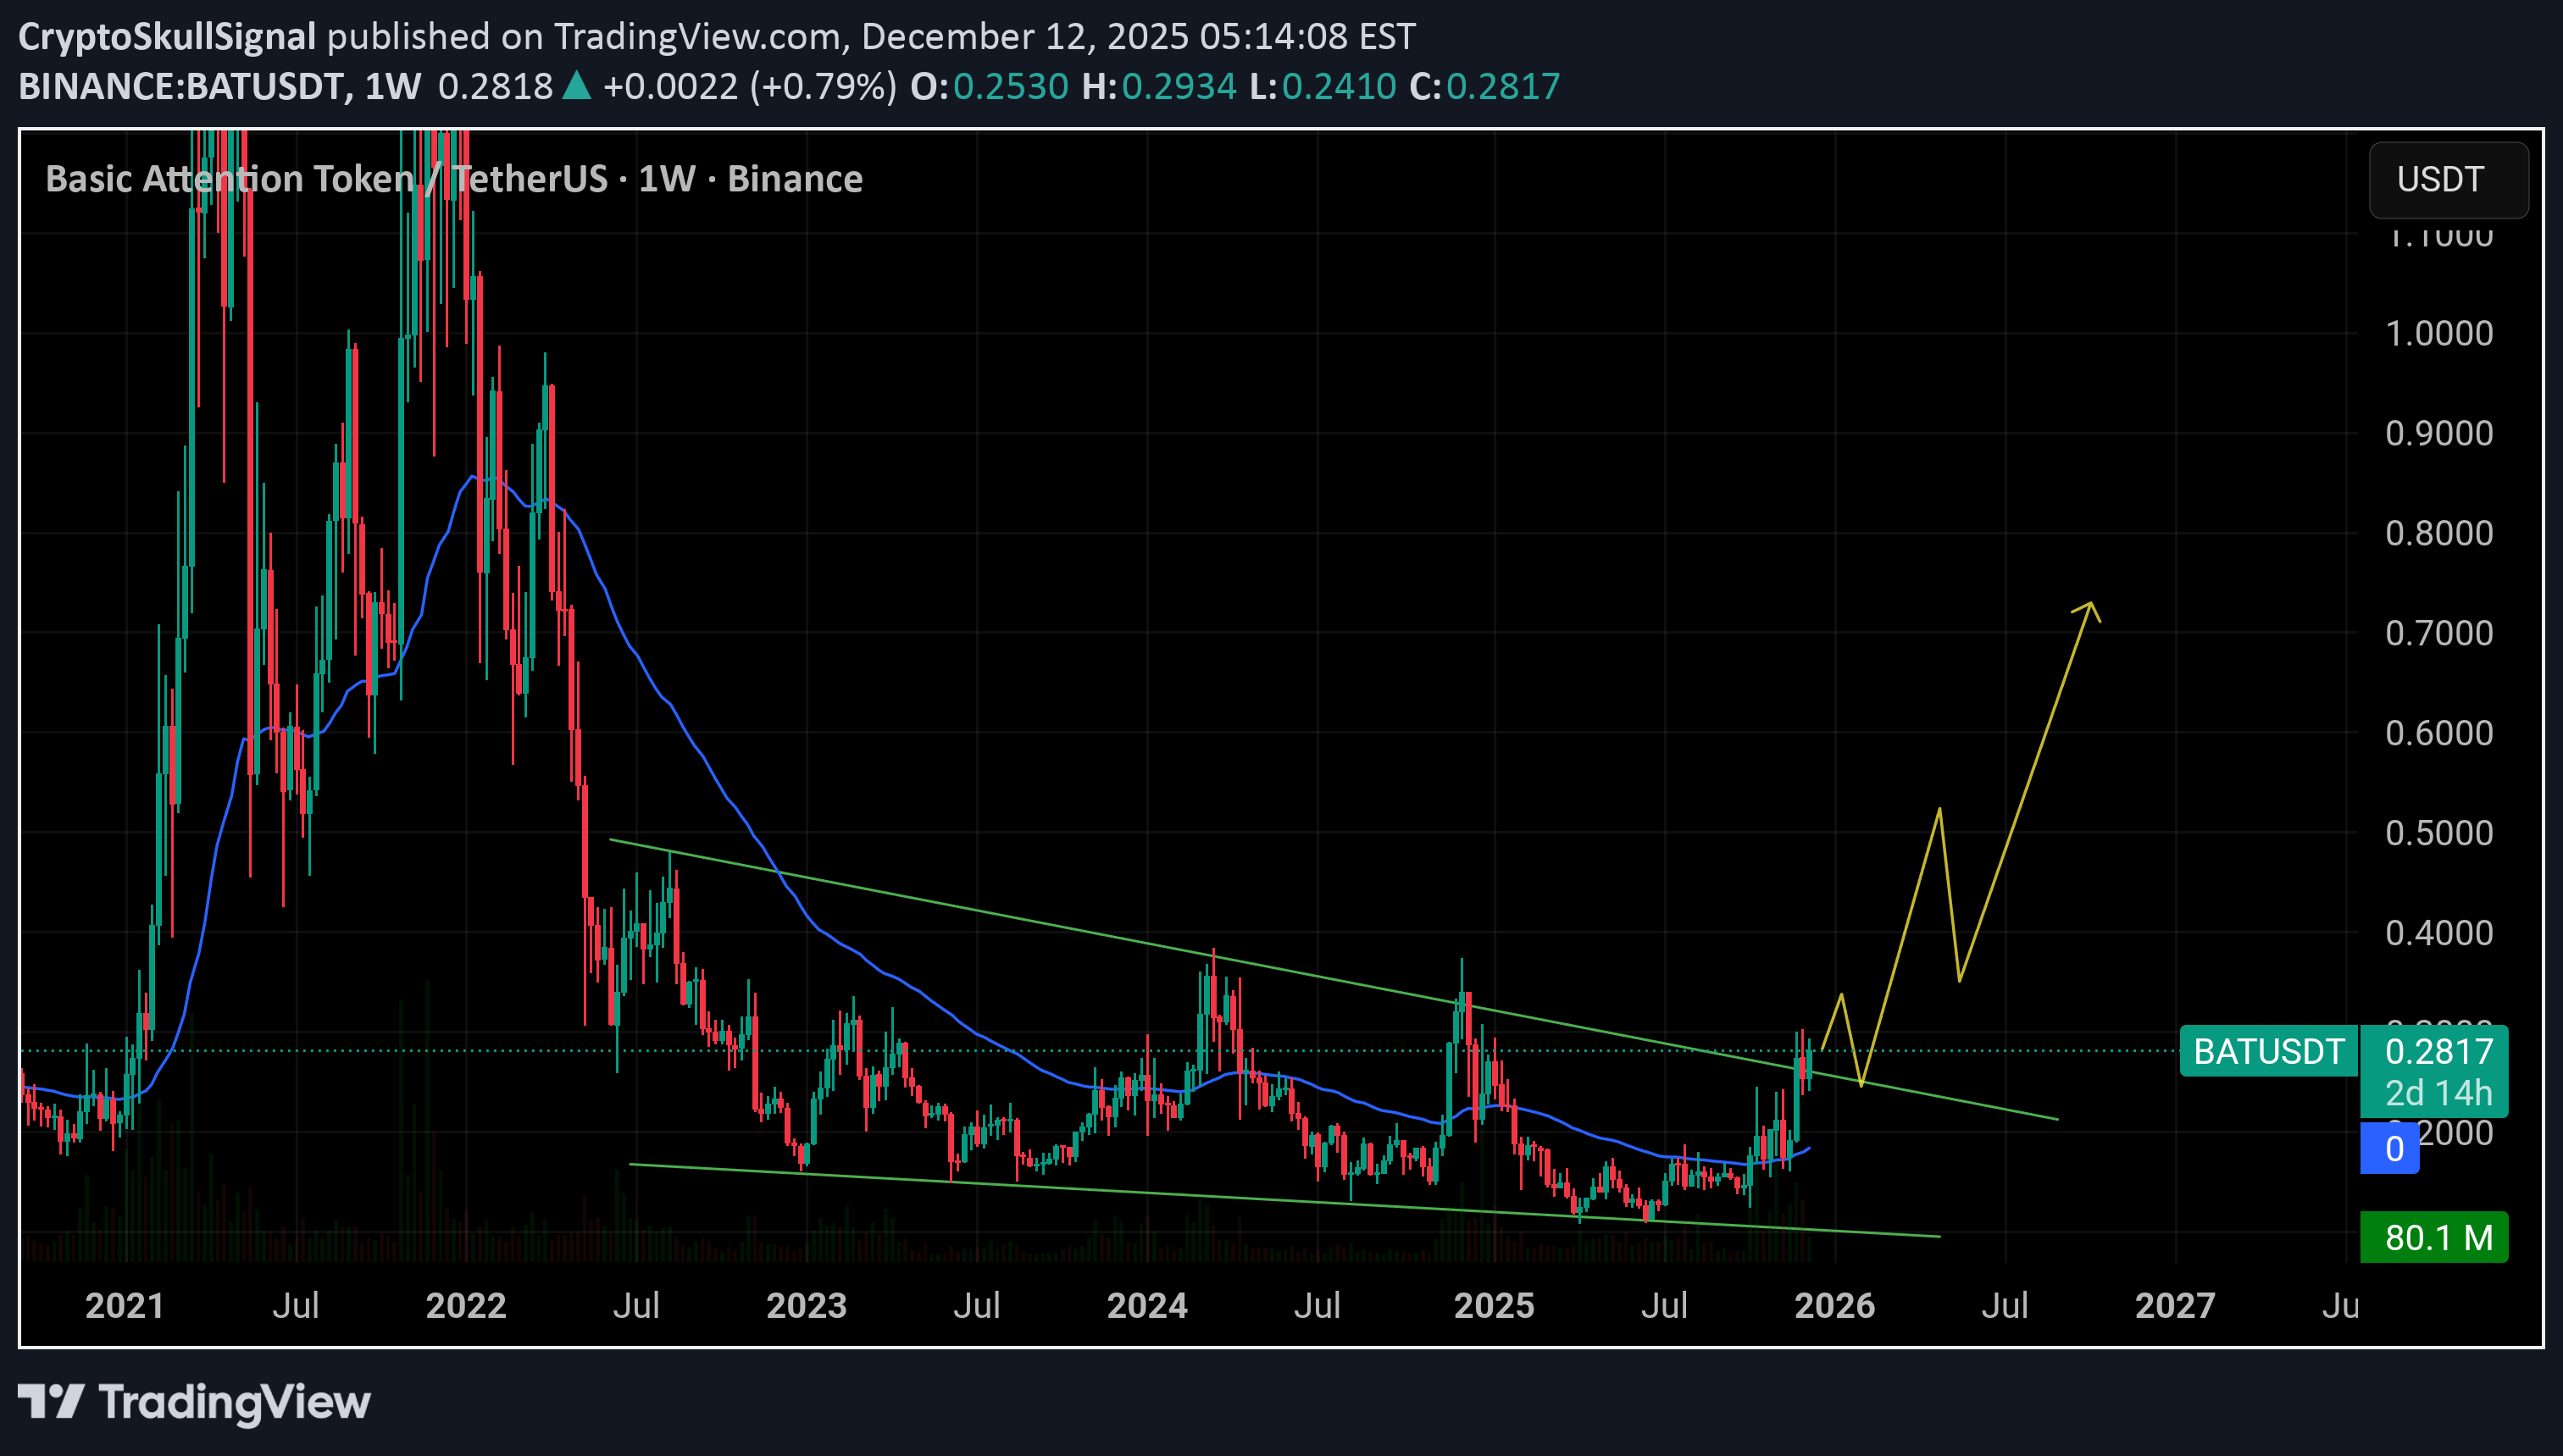
🚨🚨🚨✅ BAT finally pushed through the descending channel and is holding above 0.25. As long as it holds above 0.25, the breakout stays valid and the upside targets stay in play. That level is the line that keeps the momentum alive. If buyers defend it on the next retest, the move can stretch quickly because there isn’t much real resistance until higher levels. This is where patience pays off.

TheSignalyst
BAT - Is This the Start of a Bigger Continuation?
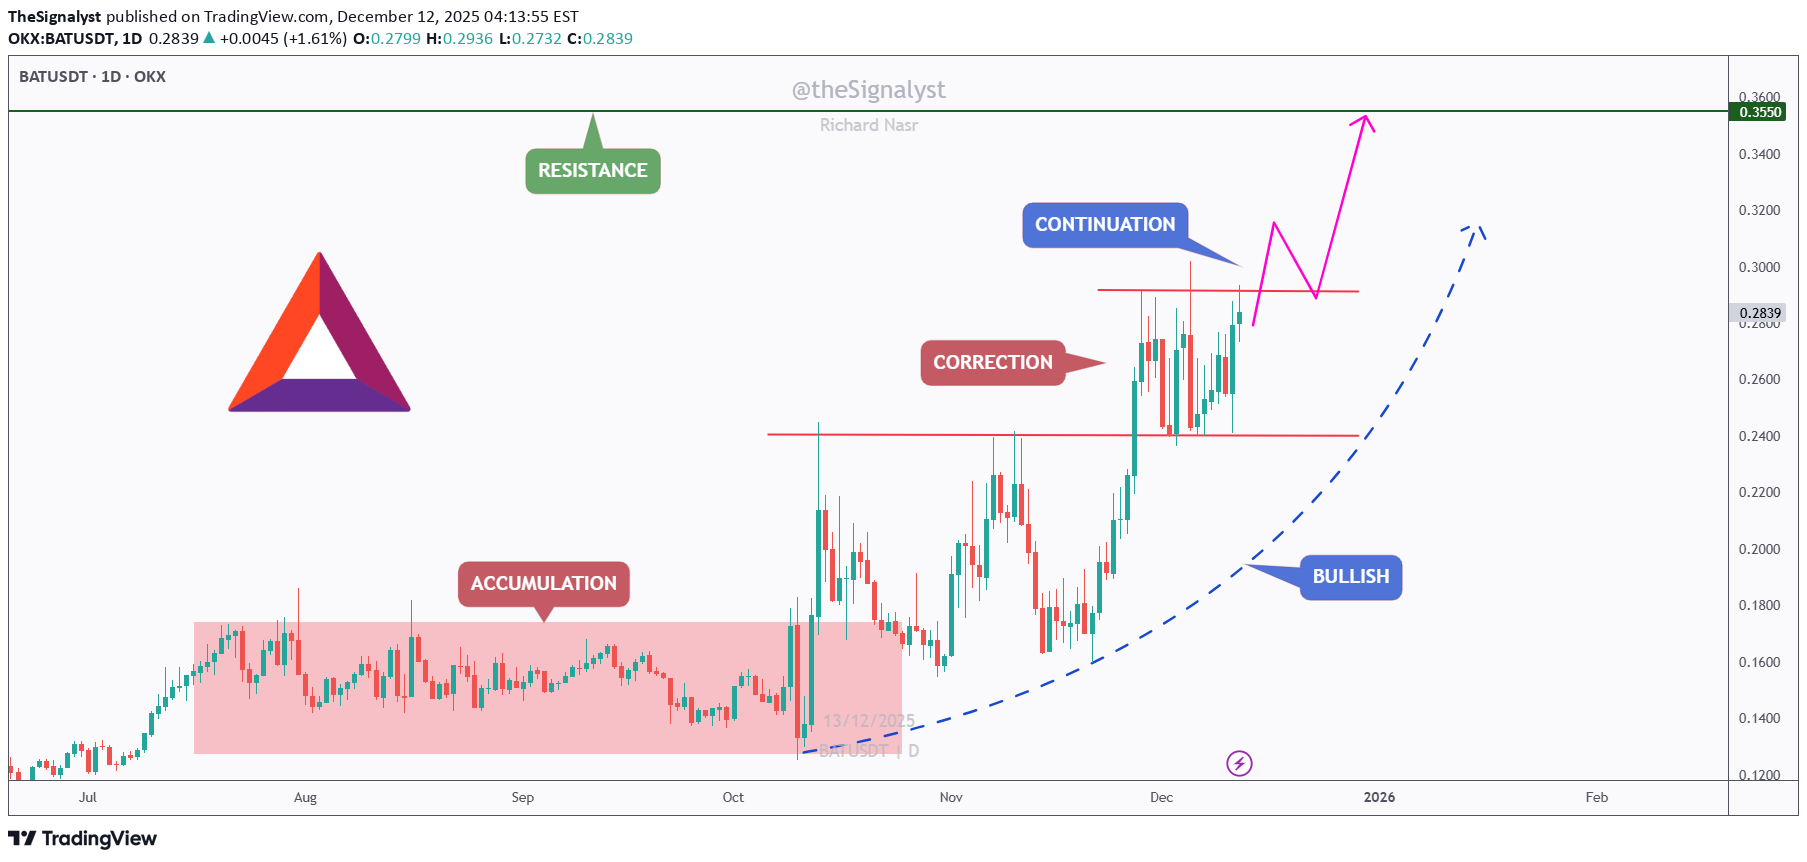
📈BAT has been steadily shifting from accumulation into a clear bullish structure , forming higher lows and pressing back into the major resistance from earlier this quarter. ⚔️Price is now retesting the red breakout level, which previously acted as resistance during the correction phase. As long as BAT holds above this level, we will be looking for continuation setups, expecting buyers to maintain control and push toward the major resistance around 0.3550. 🏹A clean retest followed by bullish rejection would provide the ideal continuation entry. However, if price breaks below the level again, this scenario becomes invalid in the short term. Are you tracking BAT’s breakout structure too? Let me know 👇🔥 ⚠️ Disclaimer: This is not financial advice. Always do your own research and manage risk properly. 📚 Stick to your trading plan regarding entries, risk, and management. Good luck! 🍀 All Strategies Are Good; If Managed Properly! ~Richard Nasr

iMoneyTeam
تحلیل تکنیکال BAT: فرصت شورت زنی در نزدیکی منطقه نقدینگی کلیدی!
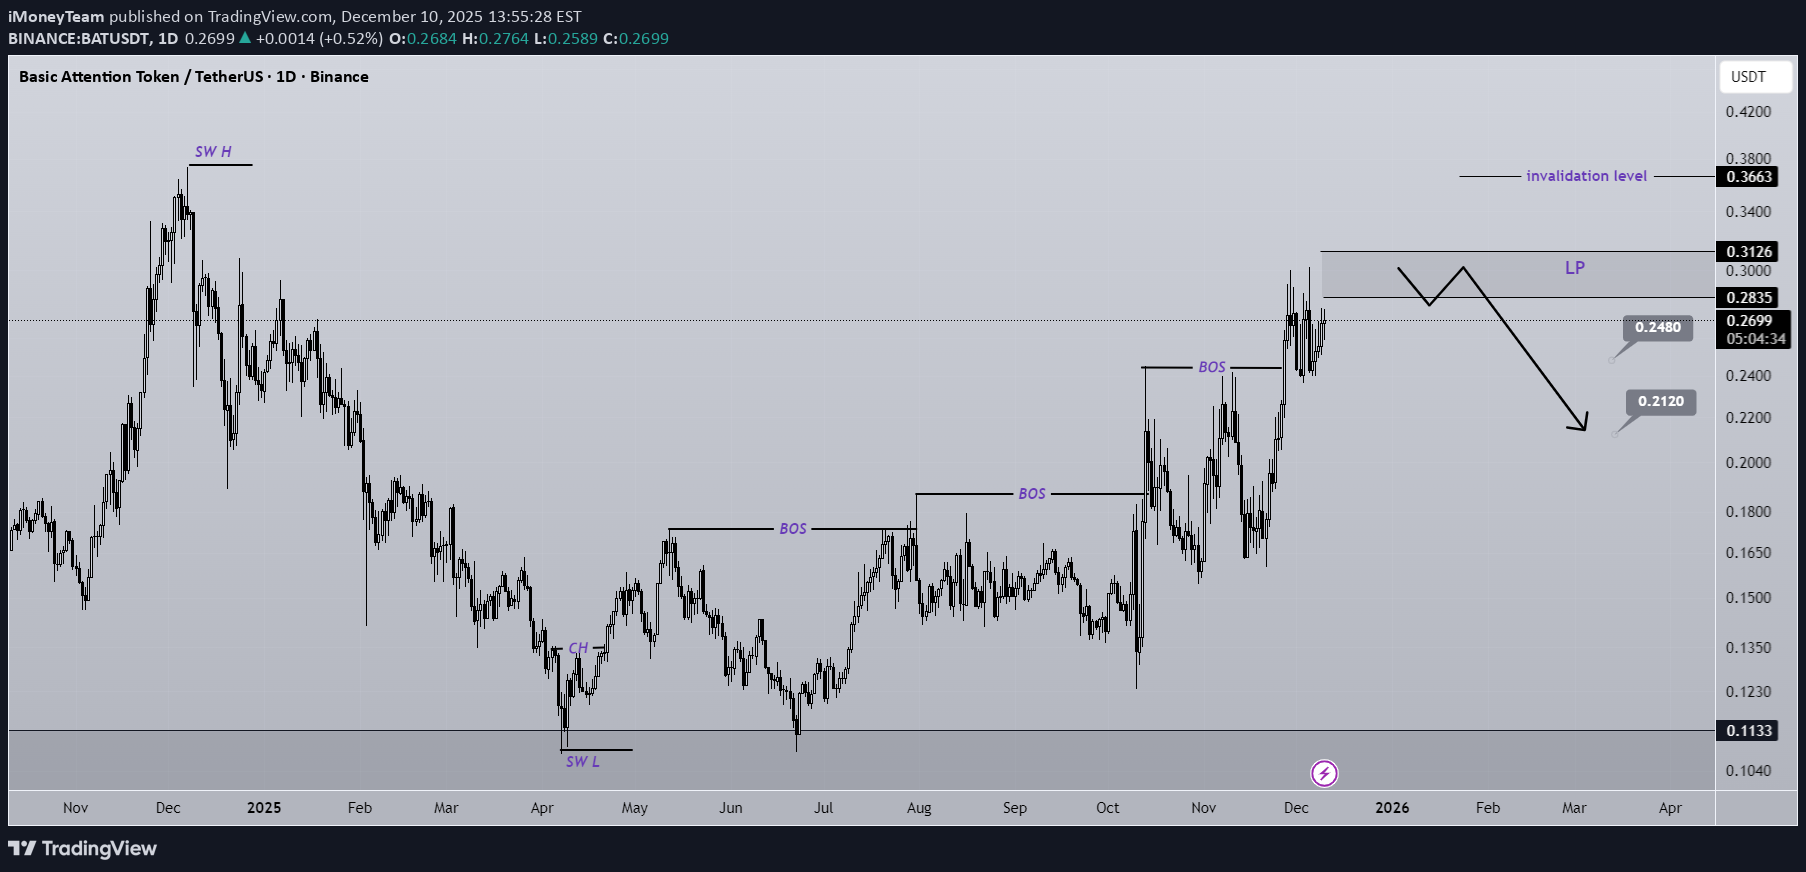
The structure of BAT is bullish, but we should not forget that it is approaching a key level. BAT is getting close to a strong liquidity pool. If price reaches the LP zone, we will look for sell / short positions toward the marked targets. A daily candle close above the invalidation level will invalidate this analysis. Do not enter the position without capital management and stop setting Comment if you have any questions thank youAfter hitting the supply entry, it dropped more than 12% and reached the first target.Both BAT targets have been hit. Take full profit.
FxPro
تحلیل موجی BAT: توکن بت کوین به کجا سقوط میکند؟ (پیشبینی 4 دسامبر)
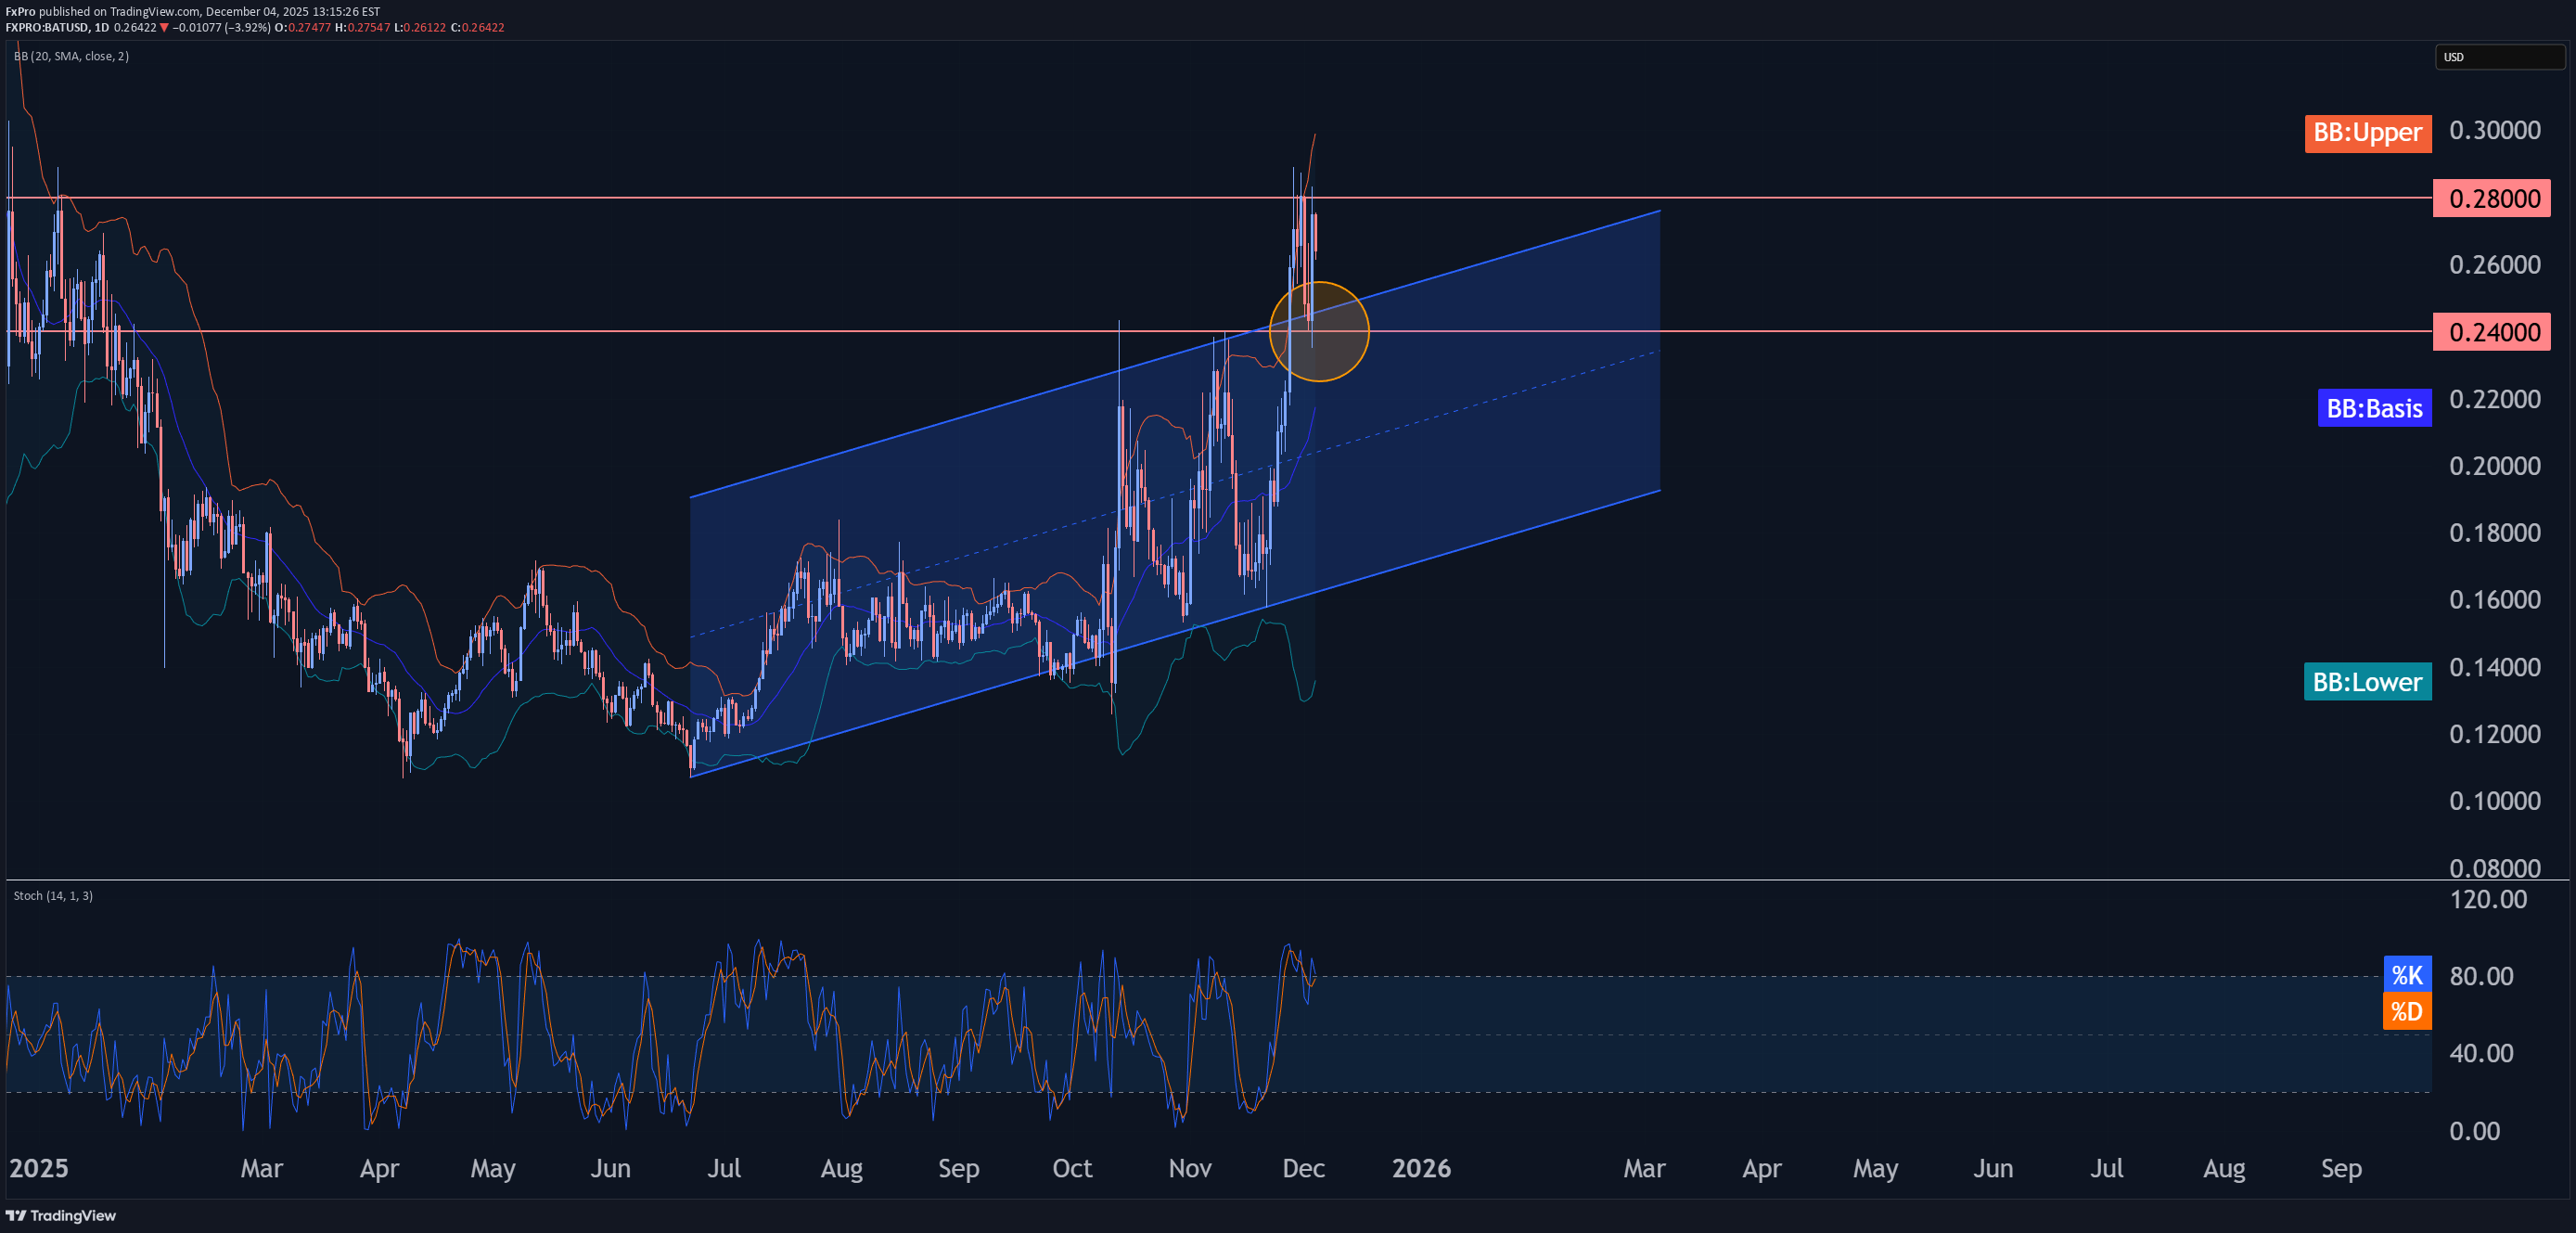
- Basic Attention Token reversed from resistance level 0.2800 - Likely to fall to support level 0.2400 Basic Attention Token recently reversed from the resistance zone between the resistance level 0.2800, upper daily Bollinger Band and the resistance trendline of the daily up channel from October. The latest downward reversal from this resistance zone is the 4th consecutive unsuccessful attempt to break above this resistance area. Given the strength of the resistance level 0.2800 and the overbought daily Stochastic, Basic Attention Token can be expected to fall to the next support level 0.2400 (low of the previous correction iv).

pullbacksignal
سیگنال خرید فوری بیتتوکن (BATUSDT): ورود به معامله با اهداف قیمتی جذاب!
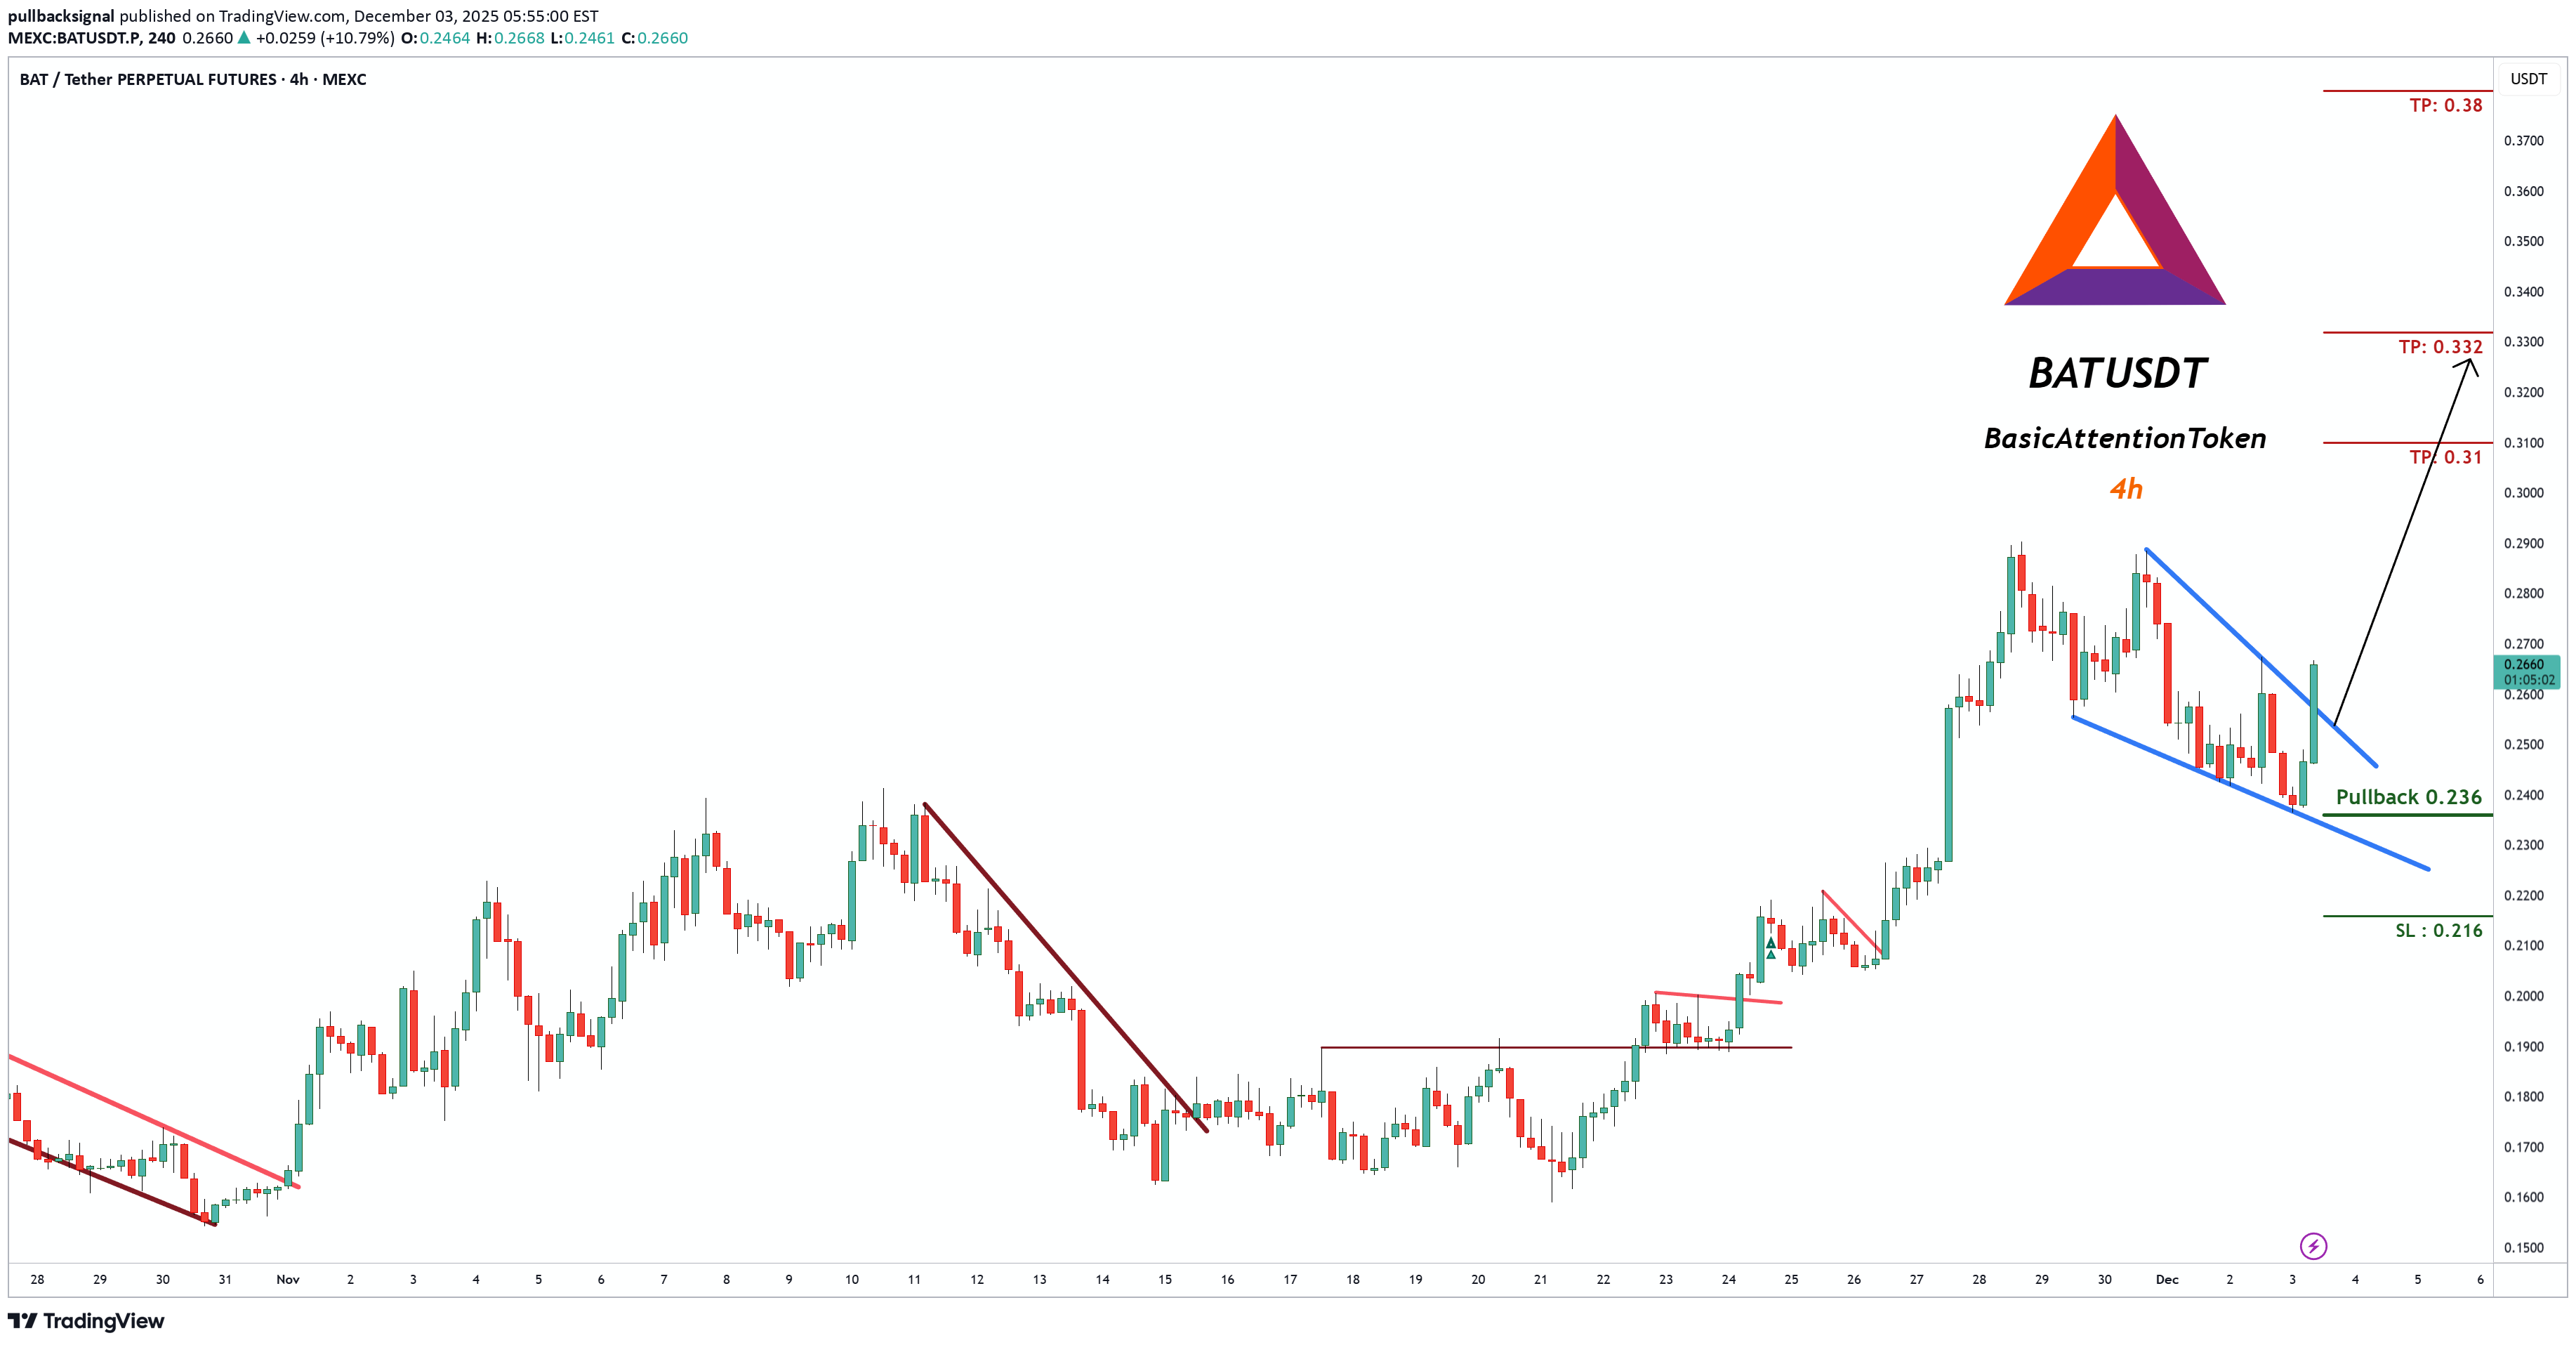
Trading Setup: A Trading Signal is seen in the BATUSDT BasicAttentionToken (4h) (spot) Traders can open their Buy Trades NOW ⬆️Buy now or Buy on 0.236 ⭕️SL @ 0.216 🔵TP1 @ 0.31 🔵TP2 @ 0.332 🔵TP3 @ 0.38 What are these signals based on? Classical Technical Analysis Price Action Candlesticks Fibonacci RSI, Moving Average , Ichimoku , Bollinger Bands Risk Warning Trading Forex, CFDs, Crypto, Futures, and Stocks involve a risk of loss. Please consider carefully if such trading is appropriate for you. Past performance is not indicative of future results. If you liked our ideas, please support us with your likes 👍 and comments .

توکن BAT در نقطه حساس: خیزش دوباره یا سقوط عمیق؟
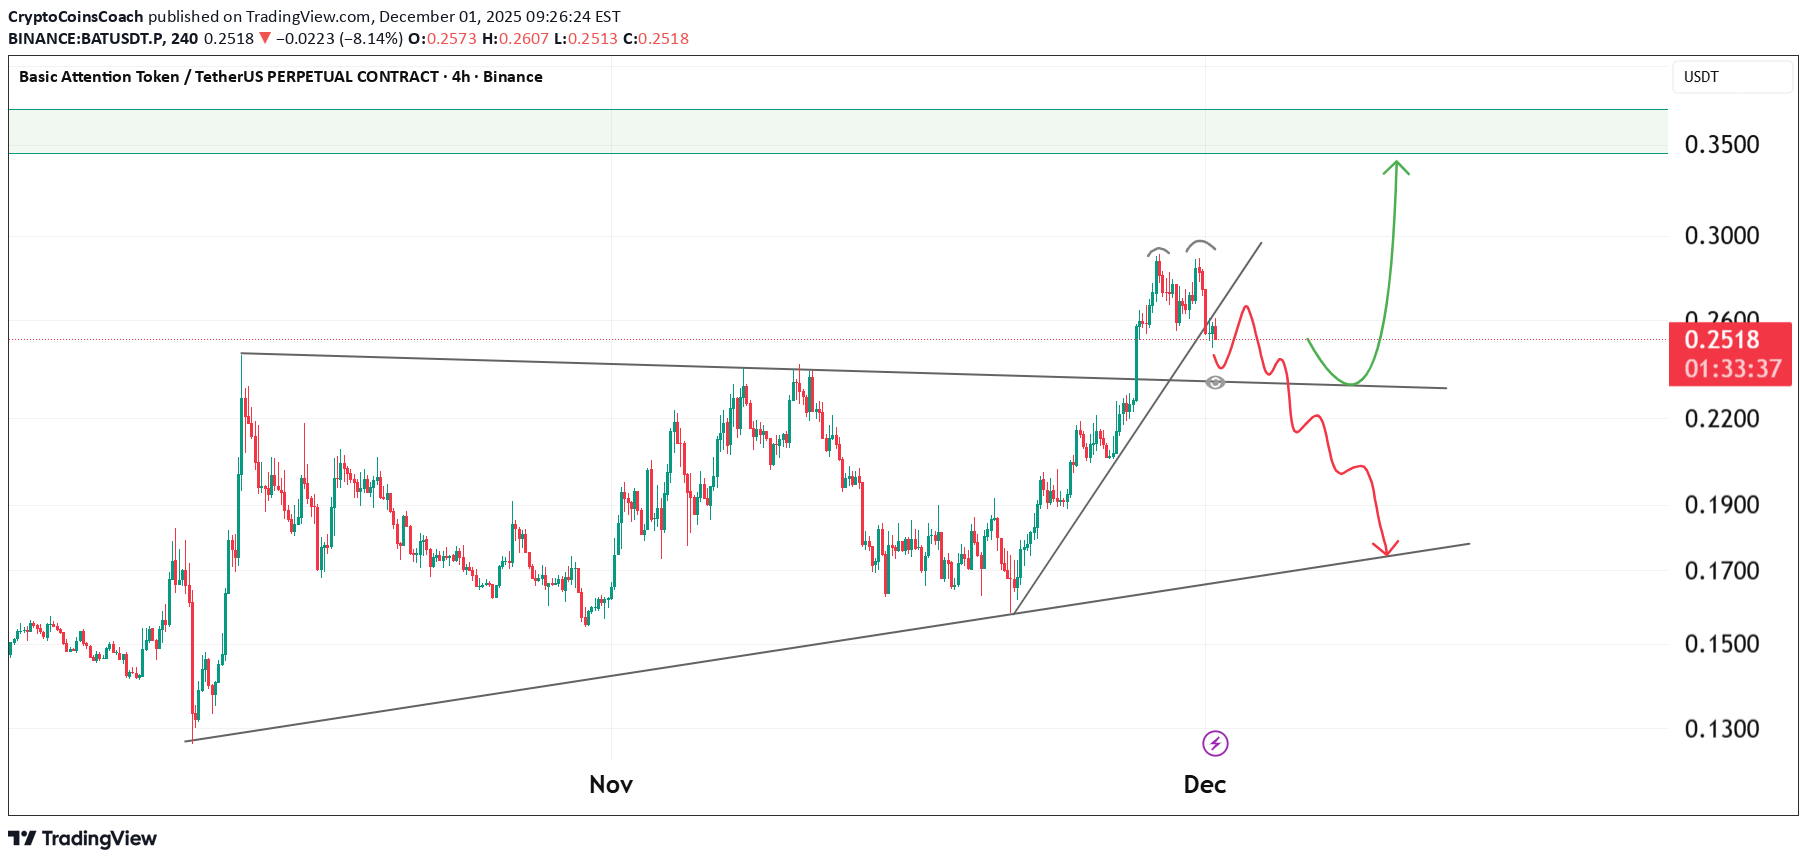
BAT is approaching a critical decision zone as price moves within a tightening structure. After a strong impulsive leg upward, the market is now forming a potential topping pattern while sitting directly on the trendline support. The current behaviour shows two possible scenarios depending on how price reacts around this region. The market has respected this ascending support multiple times, making it an important level to watch closely. Key Observations: • The recent high has created a potential double-top structure, signalling exhaustion. • Price is currently testing the trendline, which defines the short-term bias. • A clean reclaim above the nearest resistance can re-ignite bullish momentum. • A breakdown from the trendline would confirm deeper corrective movement. Bullish Scenario: If price holds the ascending trendline and pushes back above the recent breakdown zone, the next wave upward may begin. Momentum would favour a move into the next high-liquidity region. Bearish Scenario: A confirmed break below the trendline would open the path toward lower support levels. This scenario implies that the current rally was an overextension and needs deeper correction before any continuation. In simple terms: BAT is at a major support level. Hold the trendline and it can send another bullish wave. Lose the trendline and a deeper pullback becomes likely.

آیا قیمت ارز دیجیتال BAT به ۰.۳۵ دلار میرسد؟ پیشبینی هیجانانگیز برای پایان سال!
Disclaimer
Any content and materials included in Sahmeto's website and official communication channels are a compilation of personal opinions and analyses and are not binding. They do not constitute any recommendation for buying, selling, entering or exiting the stock market and cryptocurrency market. Also, all news and analyses included in the website and channels are merely republished information from official and unofficial domestic and foreign sources, and it is obvious that users of the said content are responsible for following up and ensuring the authenticity and accuracy of the materials. Therefore, while disclaiming responsibility, it is declared that the responsibility for any decision-making, action, and potential profit and loss in the capital market and cryptocurrency market lies with the trader.