
CryptoSkullSignal
@t_CryptoSkullSignal

What symbols does the trader recommend buying?
Purchase History
پیام های تریدر
Filter
CryptoSkullSignal
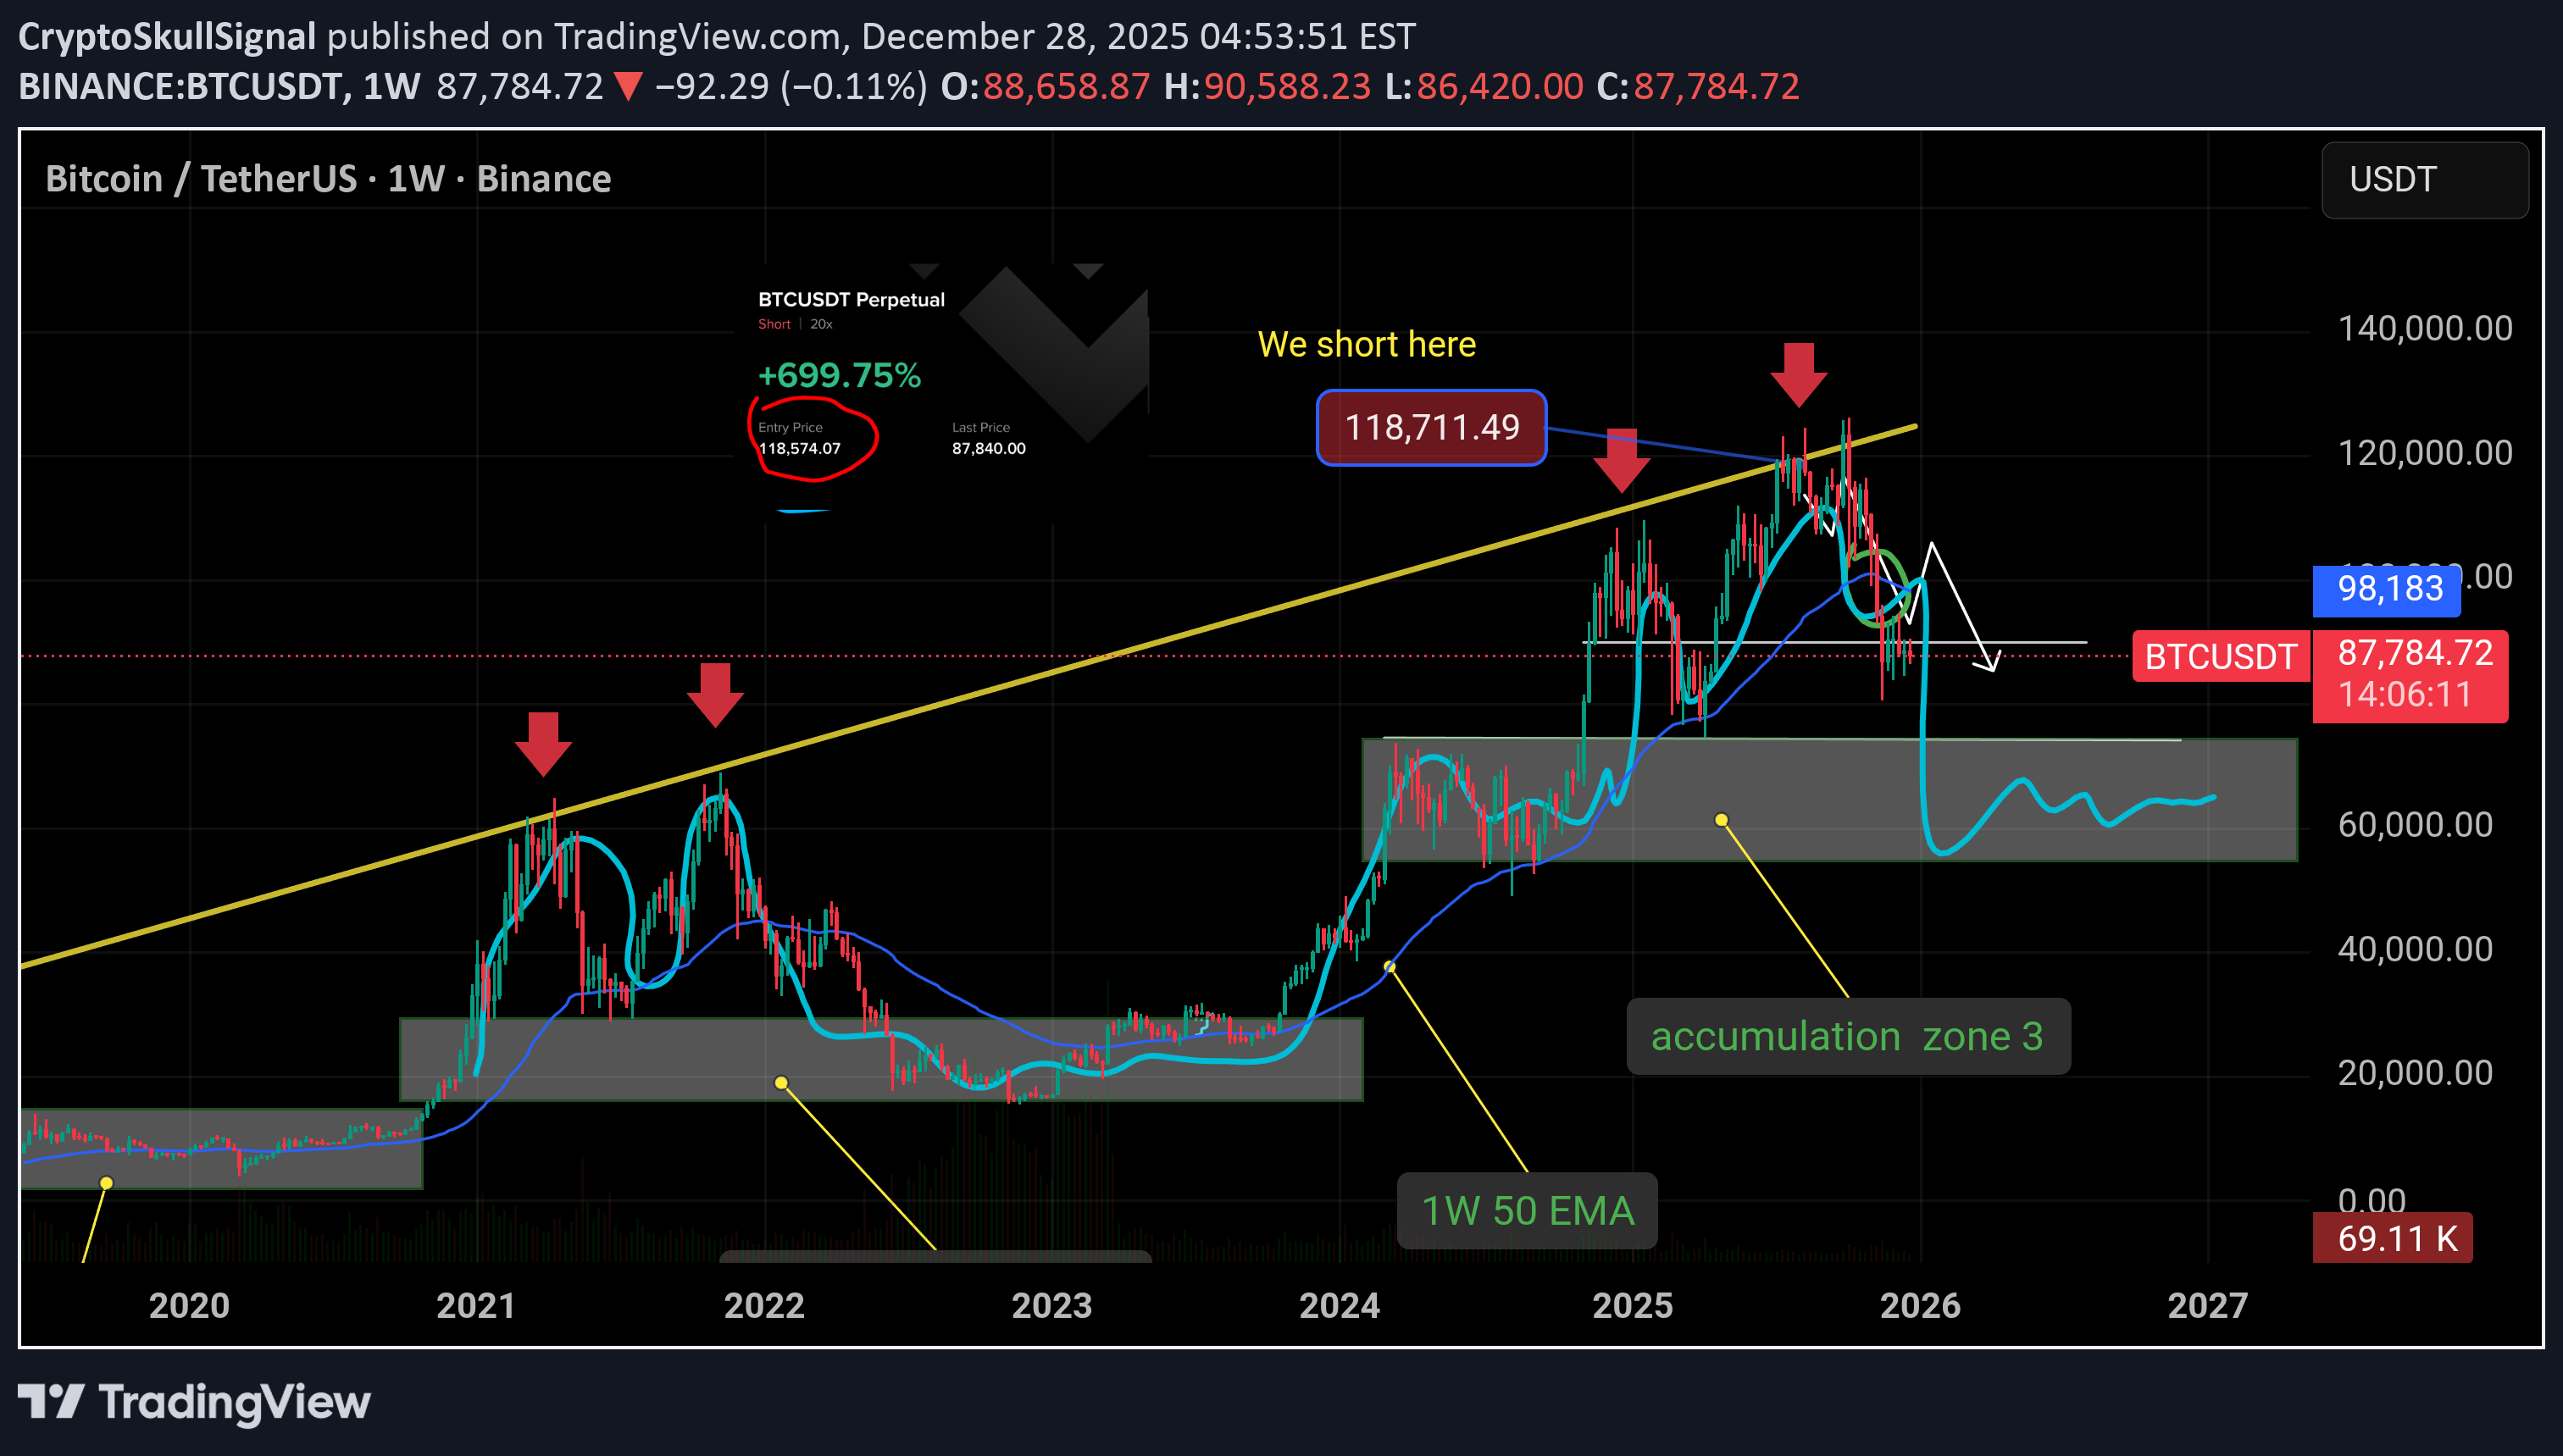
#Bitcoin Sunday Update: $BTC is holding the 1W 99 EMA

#Bitcoin Sunday Update: BTC is holding the 1W 99 EMA very strongly. That is why I repeatedly warned that a short term pump toward the 1W 50 EMA was likely. This strength is signaling a potential continuation to the upside, which is exactly what I have been waiting for over the past two months. After Bitcoin hit my sub 90k target, I clearly stated that a move toward the 1W 50 EMA in the 98k to 100k region, or even slightly above, was still possible before any major downside continuation. At this stage, the market appears to be attempting that move. For this reason, I am placing multiple short orders at 98k and 100k. I am keeping my existing shorts from the 118k region fully open, while current short orders are only preparation if price moves higher. My overall bias remains bearish, with downside targets below 72k in the coming months. This view is supported by Federal Reserve liquidity actions, including a $106 billion overnight repo injection on New Year’s Day, raising serious questions about underlying stress. At the same time, insider selling remains aggressive, increasing the risk of a 2008 style market event. These are extreme conditions. While many ignore these signals, the market remains highly vulnerable. I stay bullish only on gold and silver and strongly bearish on stocks and Bitcoin. If BTC reaches the 98k to 100k zone, I will add significantly to short positions. #btc #btcusd
CryptoSkullSignal
$TAO is trading inside a Descending Triangle!!

TAO is trading inside a Descending Triangle. It is a decentralized, open source AI network where machine learning models collaborate and earn TAO tokens based on the value they contribute. TAO creates a trustless marketplace for AI, allowing anyone to build, access, and benefit from artificial intelligence in a transparent, incentive driven ecosystem. This positions TAO as a strong contender to lead the AI sector into 2026. From a price action perspective, TAO is currently trading near a major long term support zone. If price holds the $180 to $170 area and delivers a clear bounce, followed by a decisive breakout above the descending trendline, the structure opens room for a potential 100 percent to 1000 percent upside over the next cycle. The $160 level remains key support, and a clean loss of this level would invalidate the bullish thesis.
CryptoSkullSignal
#BITCOIN SUNDAY UPDATE $BTC Nothing has changed. We are still
#BITCOIN SUNDAY UPDATE BTC Nothing has changed. We are still moving sideways. I’m holding my short position as explained before. My focus is simple: protect liquidity. I will short strength if BTC reclaims 98k 1W50EMA and add more short positions around that level or above. If price moves lower, my interest is only spot buying near fair value around 72k. Anything else right now is just noise. I’m also considering a limit long on #BTC in VIP around 85k, strictly as a tactical move to catch a push toward breaking 98k. That’s it. Simple strategy, no overtrading. I don’t chase CMP trades in a bear market. I stick to limit orders and patience.
CryptoSkullSignal
تحلیل بیت کوین ۴ ساعته: حرکت خنثی در محدوده ۸۴ تا ۹۵ هزار؛ استراتژی معاملاتی چیست؟
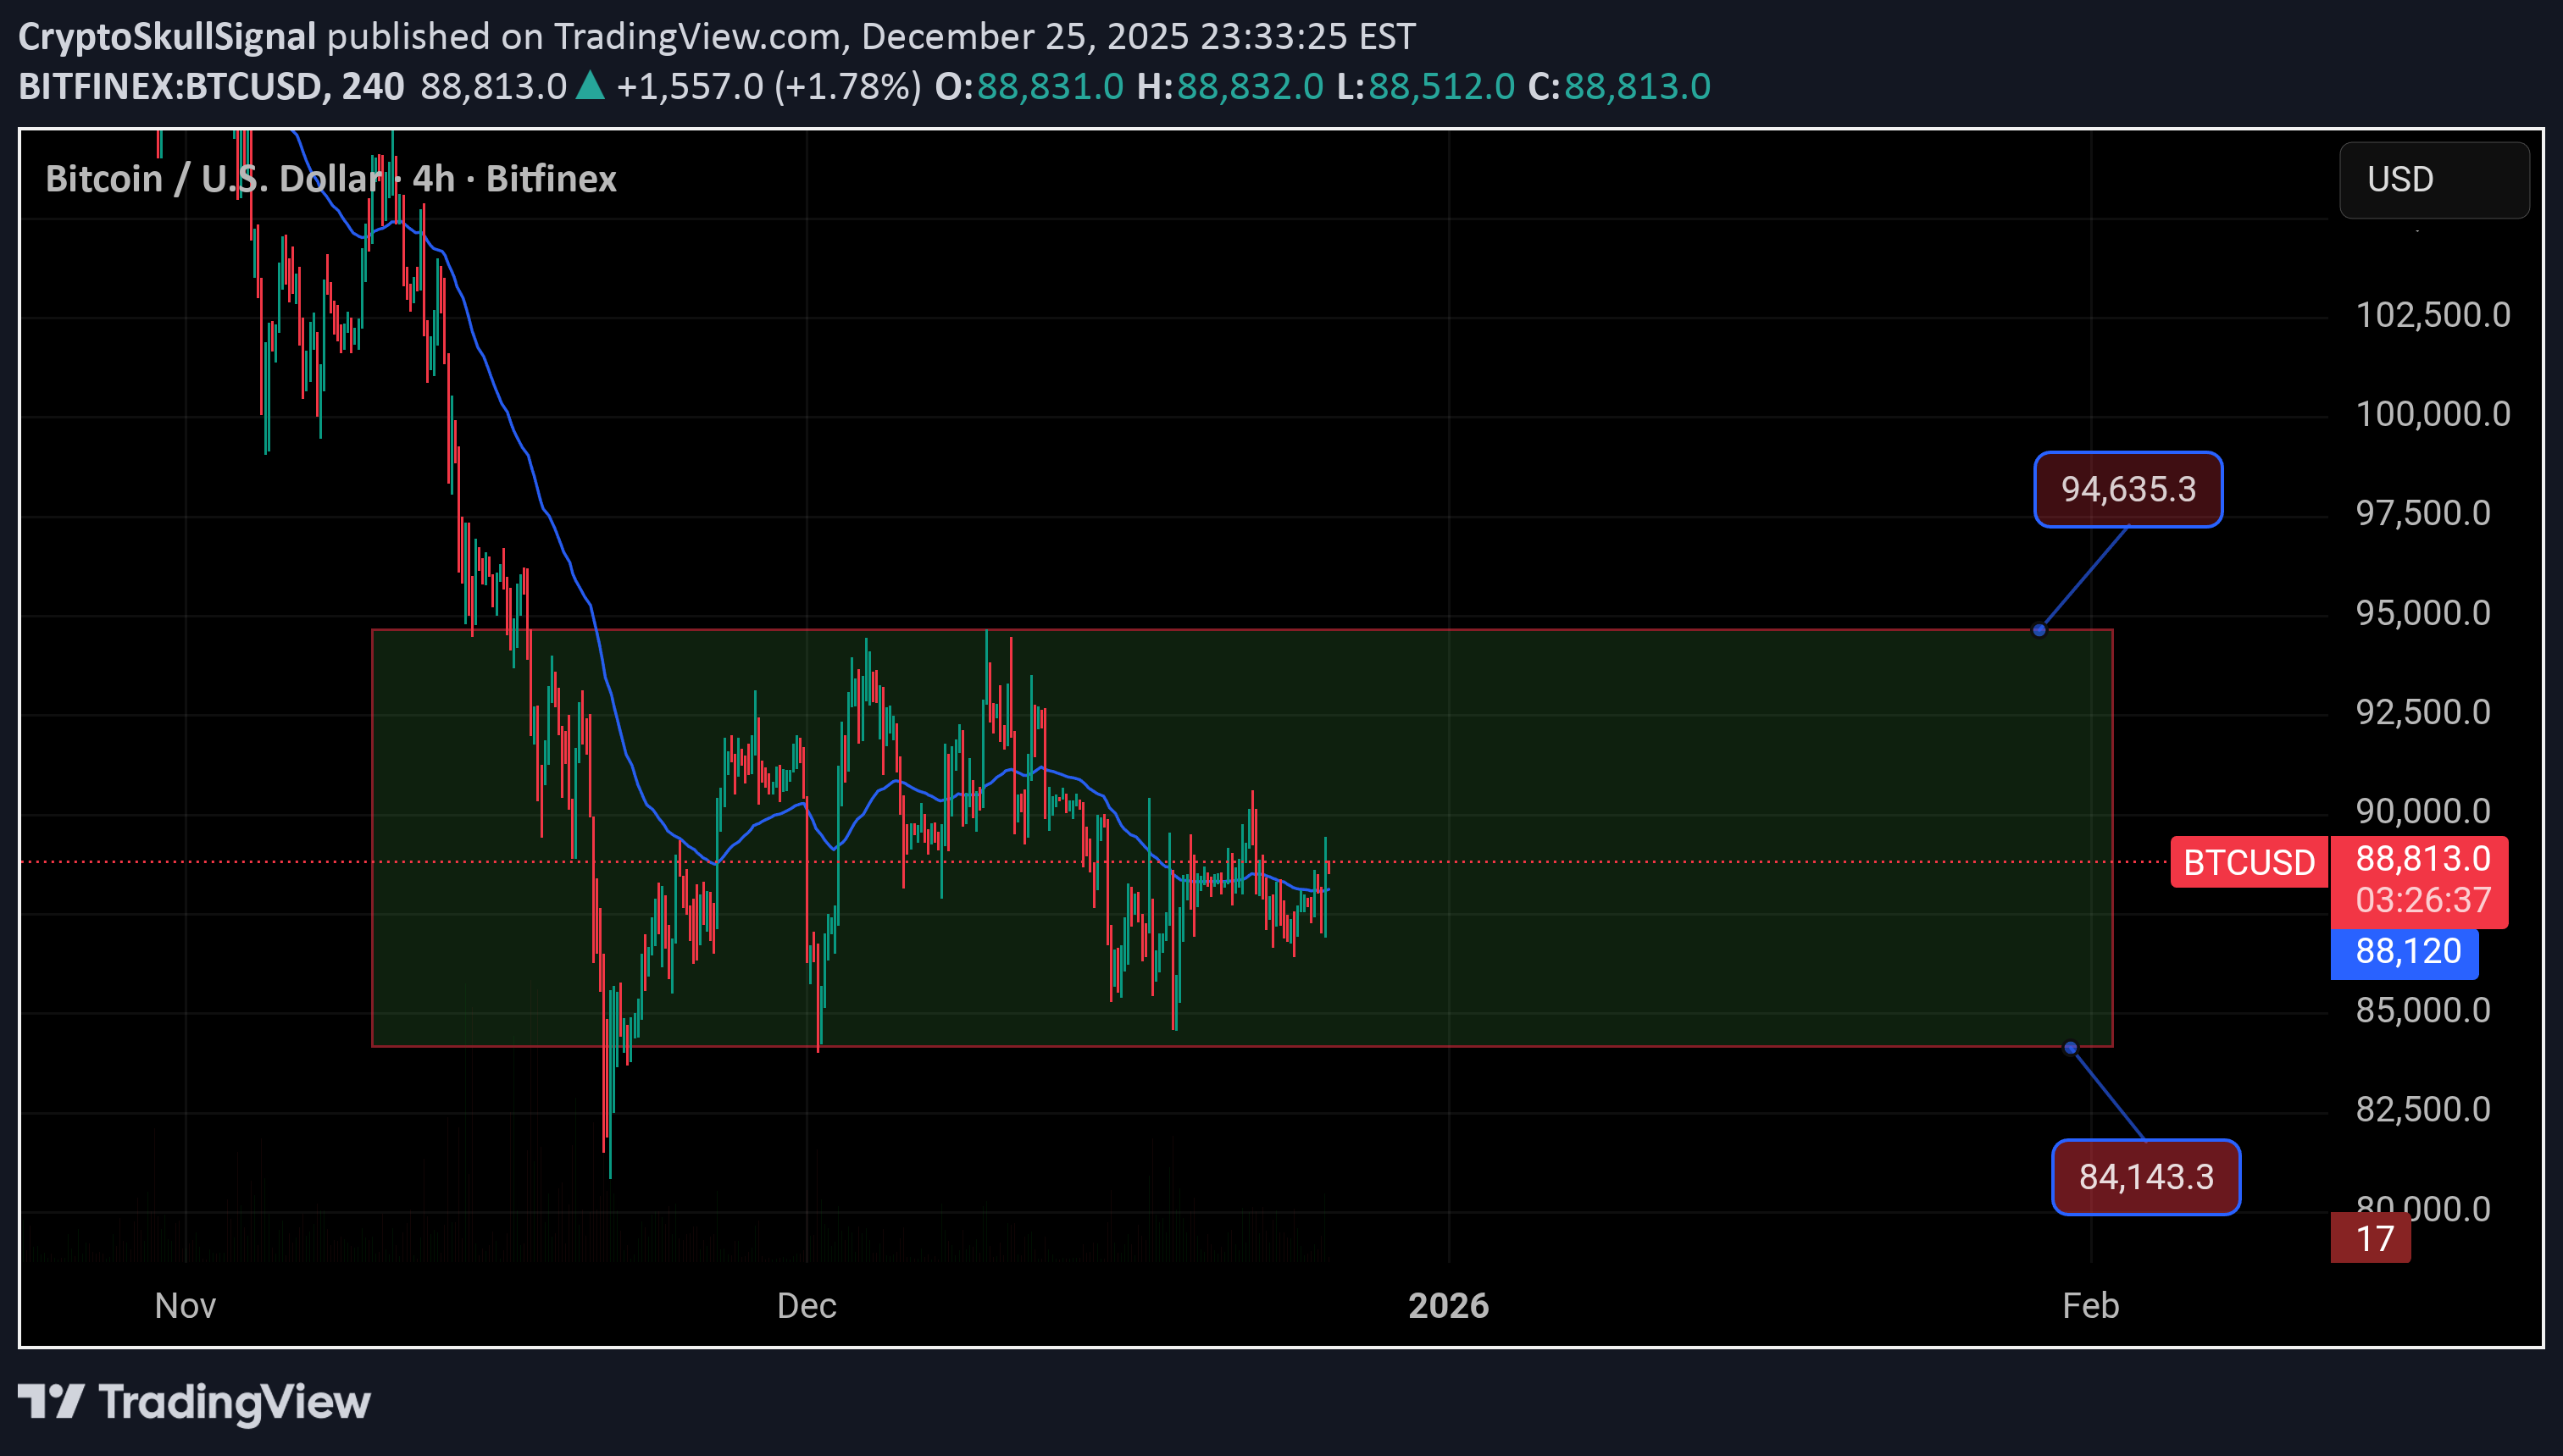
B BTC/USD 4H Analysis Bitcoin is moving sideways after a sharp selloff. Price is consolidating inside a clear range, which tells us sellers lost momentum but buyers are not strong enough yet to trend. This is balance, not strength. As long as price stays between 84K and 95K, expect chop and liquidity grabs. Trend traders should stay patient. Range traders can work the extremes with tight risk. I'm holding my short position. It has been more than 4 months, and I am patiently waiting for a move toward the 99K zone. If price gives a strong breakout and acceptance above 99K, I will look to add more shorts at higher levels, not before. Chasing early makes no sense here. On the spot side, my interest is much lower. If Bitcoin revisits the 72K region, I plan to add spot gradually, around 10 to 20 percent of my allocated capital. No panic buying, only strategic accumulation. Until then, it is all about patience, risk control, and letting price come to my levels, not forcing trades.
CryptoSkullSignal
$UNI is sitting on a major long term demand zone, and historical
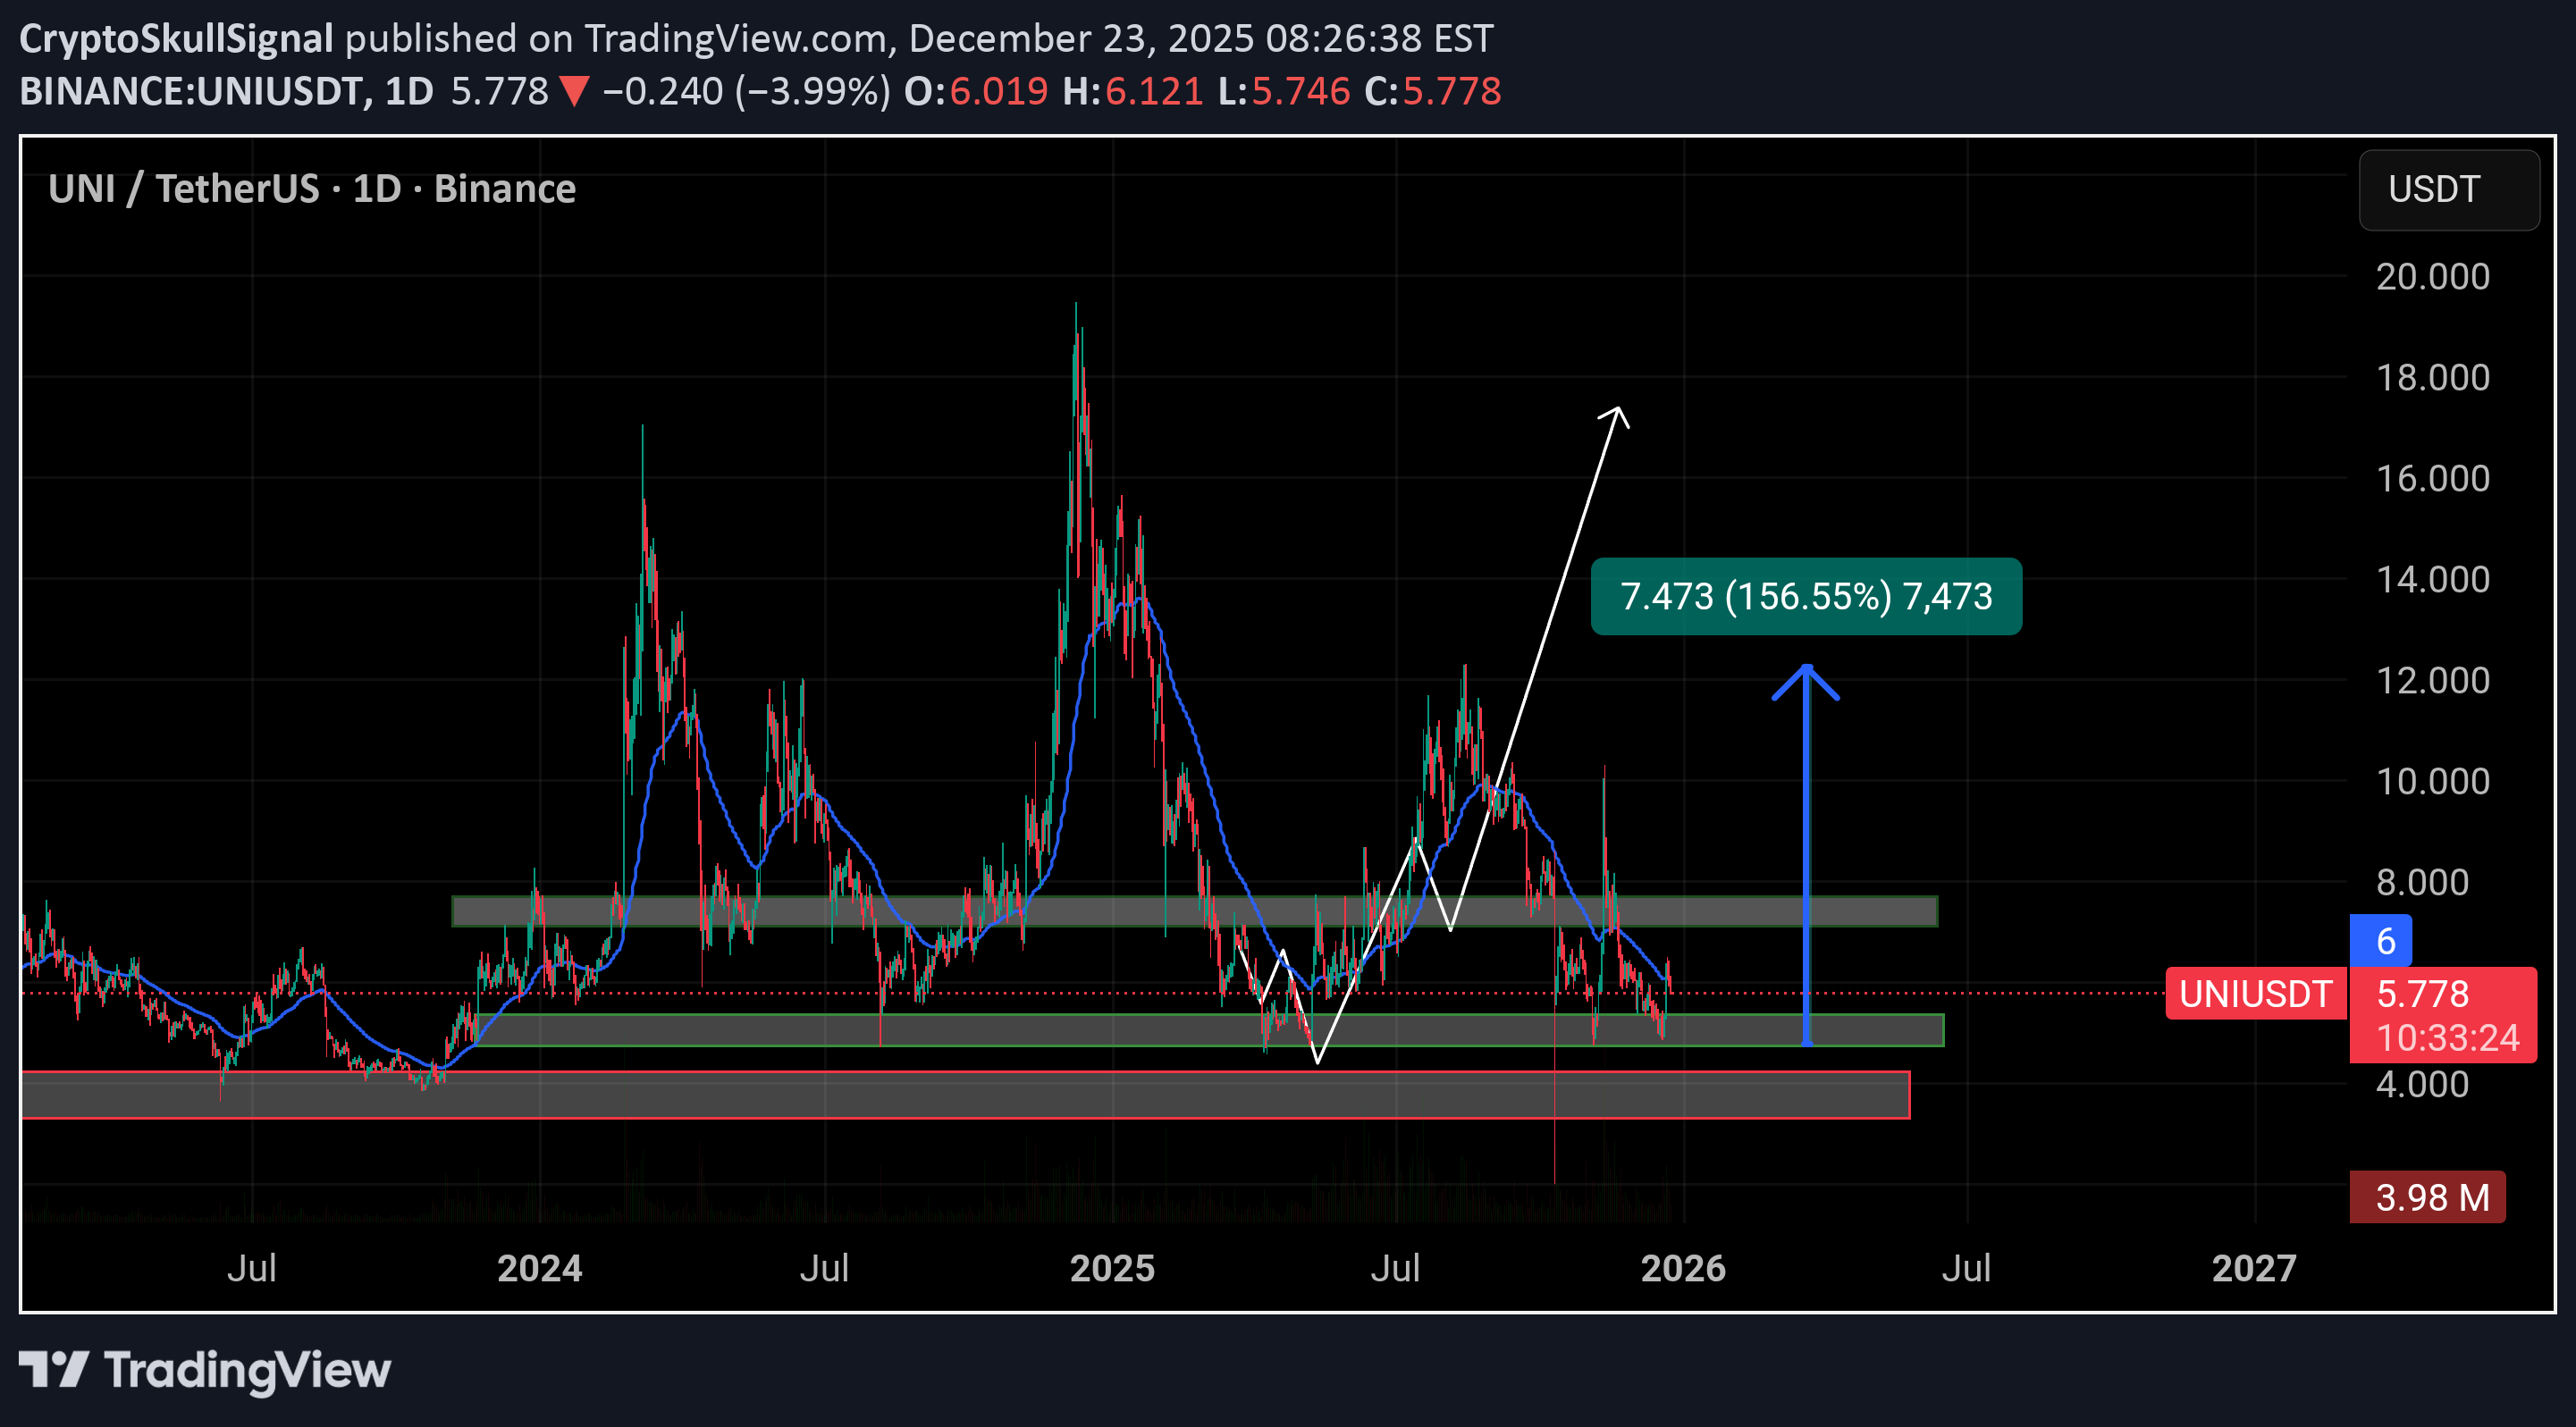
UNI is sitting on a major long term demand zone, and historically every time price respected this base, it delivered a strong upside move, the last comparable setup resulted in a ~156% pump. Right now, the focus is clear: support lies at $4.70–$5.26 with deeper demand at $3.30–$4.10, while $7.18–$7.80 remains the key resistance that must break to unlock real upside.
CryptoSkullSignal
چرا فقط منتظر فرصتهای بزرگ هستم؟ راز استراتژی من در بازار خرسی بیت کوین!
Someone DM’d me asking why I don’t post many trades at CMP, only limit orders, and why I’m mainly focused on a BTC short that I’ve been holding since 118k. I’m guessing many of you have the same question, so here’s my reasoning. 1. We are in a bear market. There’s honestly not much to do right now except wait. “So if we’re in a bear market, why aren’t you always shorting?” I am. I’ve been holding a BTC short for the past four months. I warned you countless times that this was the top and not to expect much more upside. Right now, I’m waiting for a much better opportunity, one that I’m best at, buying bottoms. 2. I believe we’re closer to the end of the downside than the beginning. Most people only understand what’s happening after it has already played out. The same thing happens in bull markets, and it’s happening again now. This bear market didn’t just start. It’s been here for months, as I’ve been saying. The real bear phase began around 99k, which I’ve mentioned many times. As I said in my last BTC big update, I’m watching 72k as a strong support. That’s where I plan to add spot positions. We need to see a bounce there. If we don’t, then we likely enter an accumulation zone between 50k and 72k, and I think we’ll stay in that range for a long time before the next bull run begins. I’m basically waiting for two things, which I’ve always shared here: BTC reclaiming 99k to add more short positions A potential bottom around 72k As for altcoins, they’re in a very bad state right now. Things can change, but until they do, don’t try to be a hero and buy blindly. Some alts look cheap, but there’s still a good chance we see another 30% drop before they form a proper bottom. The bottom line is simple: protect your liquidity and wait for better opportunities. If you really feel the need to buy something now, reduce your position size in case you’re wrong. And of course, I’ll be here to share opportunities when they actually show up. Merry Christmas in advance to those who still have money left to celebrate 🎄
CryptoSkullSignal
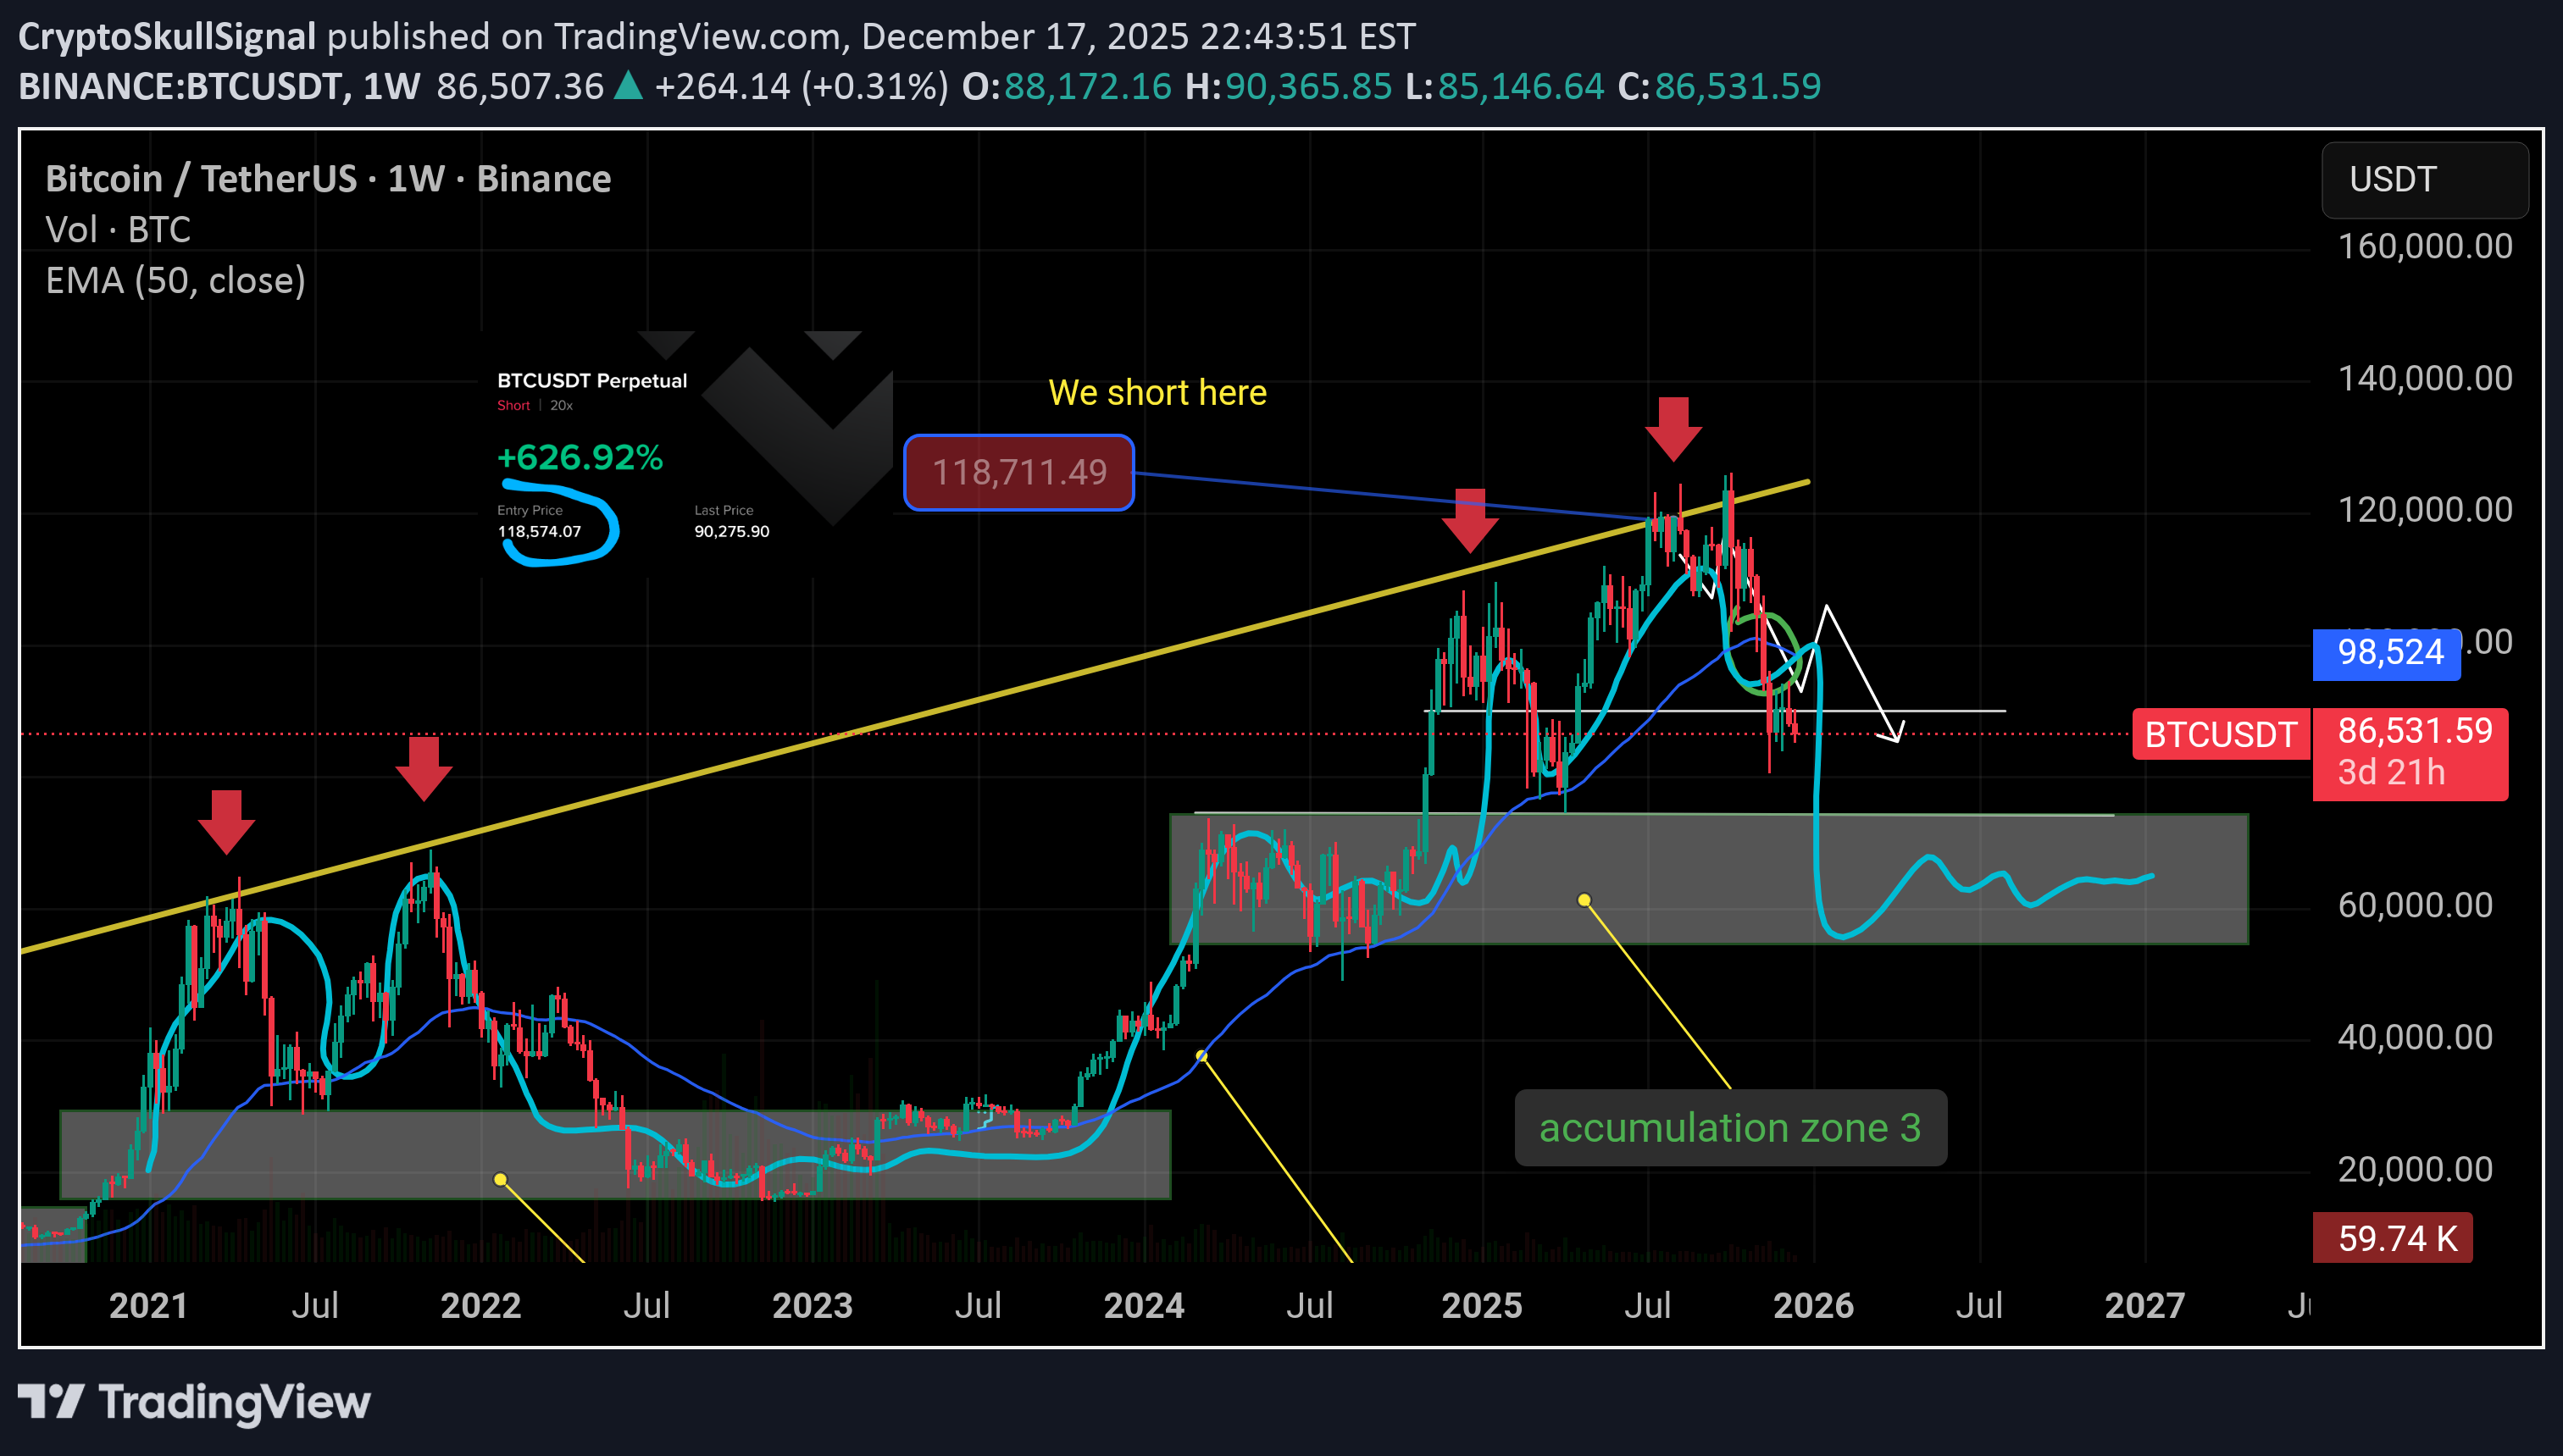
هشدار جدی بیت کوین: چرا بازار خرسی فرارسیده و حمایت نهایی کجاست؟
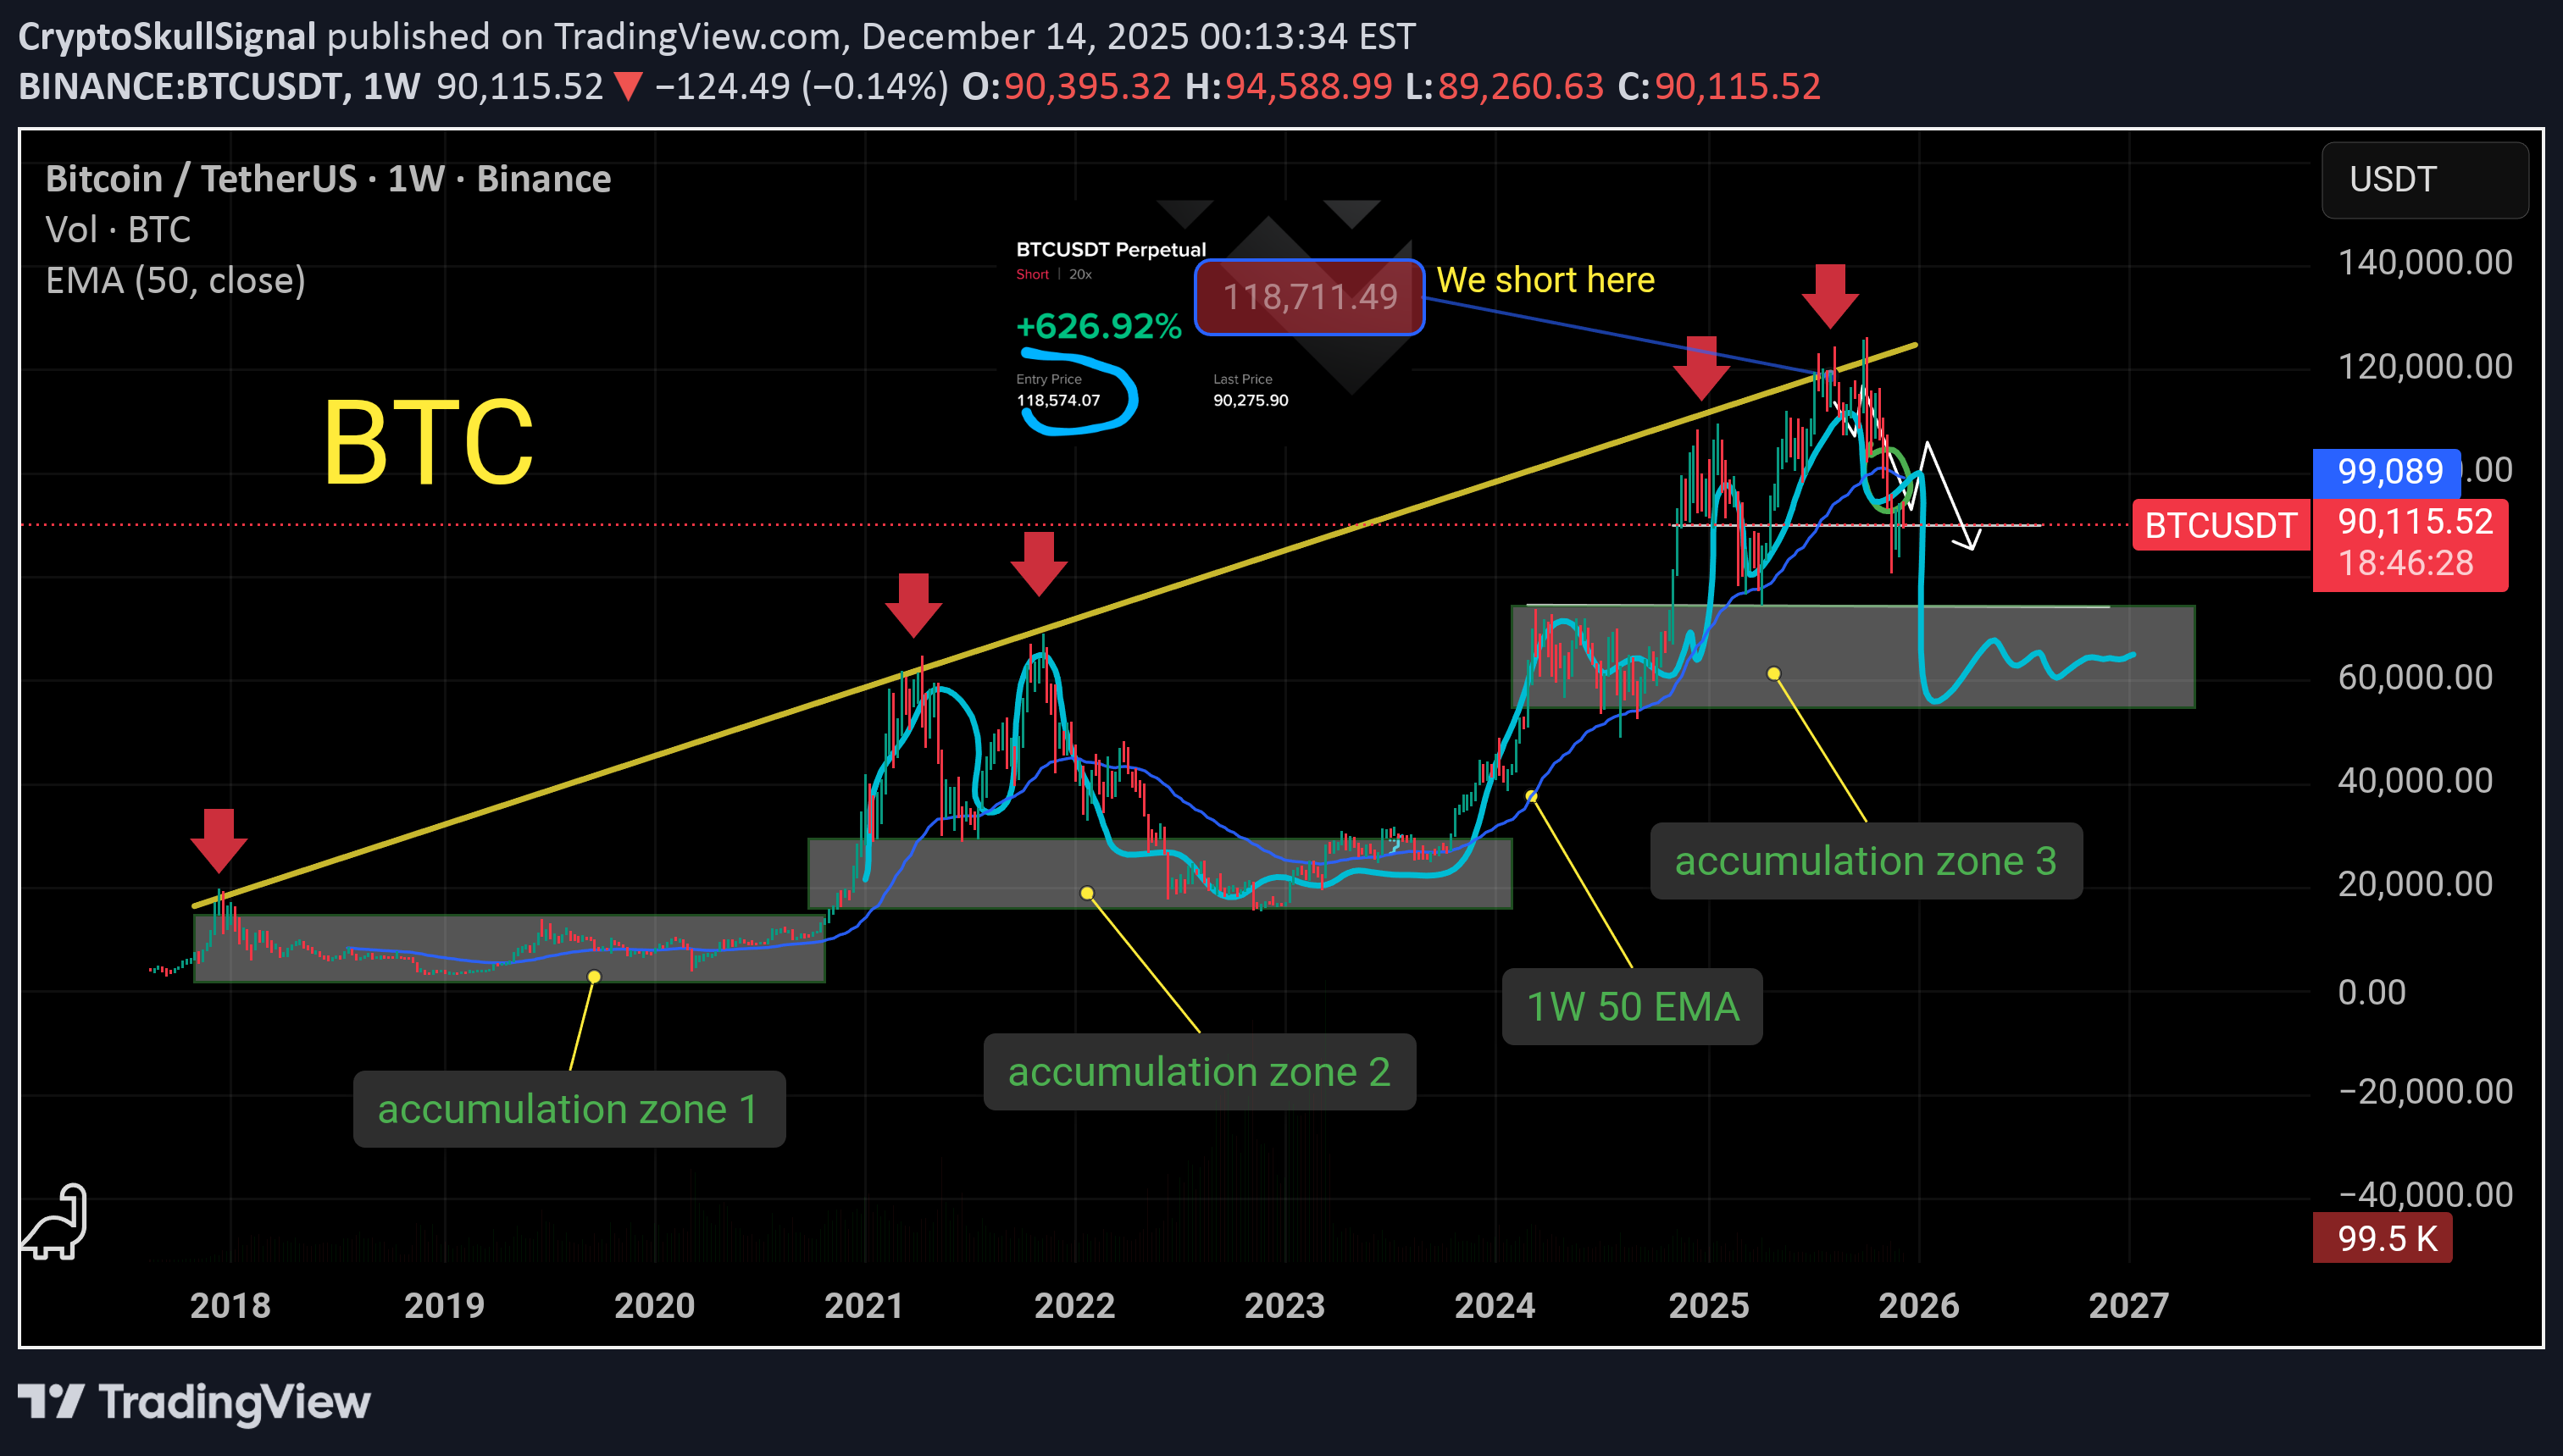
#BITCOIN BIG SUNDAY UPDATE BTC has already dumped more than $40k, and it’s been almost 4 months since I turned bearish on BTC. I’ve been warning non stop that this is the top. Don’t expect more pump. It’s ready to drop. I told you 100K was the strongest support. Weekly close below it = bear market 😂 The 1W 50 EMA is broken. Since 25K BTC pumped every touch. Now it's the 5th week below it. Welcome to the bear market. A pullback to the 50 EMA is possible, and if it happens, I’ll add more shorts. As you can see, the yellow line has been BTC’s biggest resistance since 2018. Every time price hits it, BTC gets rejected and enters a long accumulation phase. After the 2018 rejection, BTC spent more than 3 years trading inside accumulation. Then COVID hit, liquidity flooded the market, and BTC pumped hard straight back into the same trendline. That rally was also rejected. What followed? Another accumulation phase that lasted more than 1.5 years before the next expansion. Now look at the present. BTC has once again hit the same resistance trendline and is getting rejected. History is repeating, not rhyming. In my view, 75–72K is the last major support. If we lose that zone, BTC enters the 3rd accumulation range between 53K and 72K.
CryptoSkullSignal
$BAT finally pushed through the descending channel
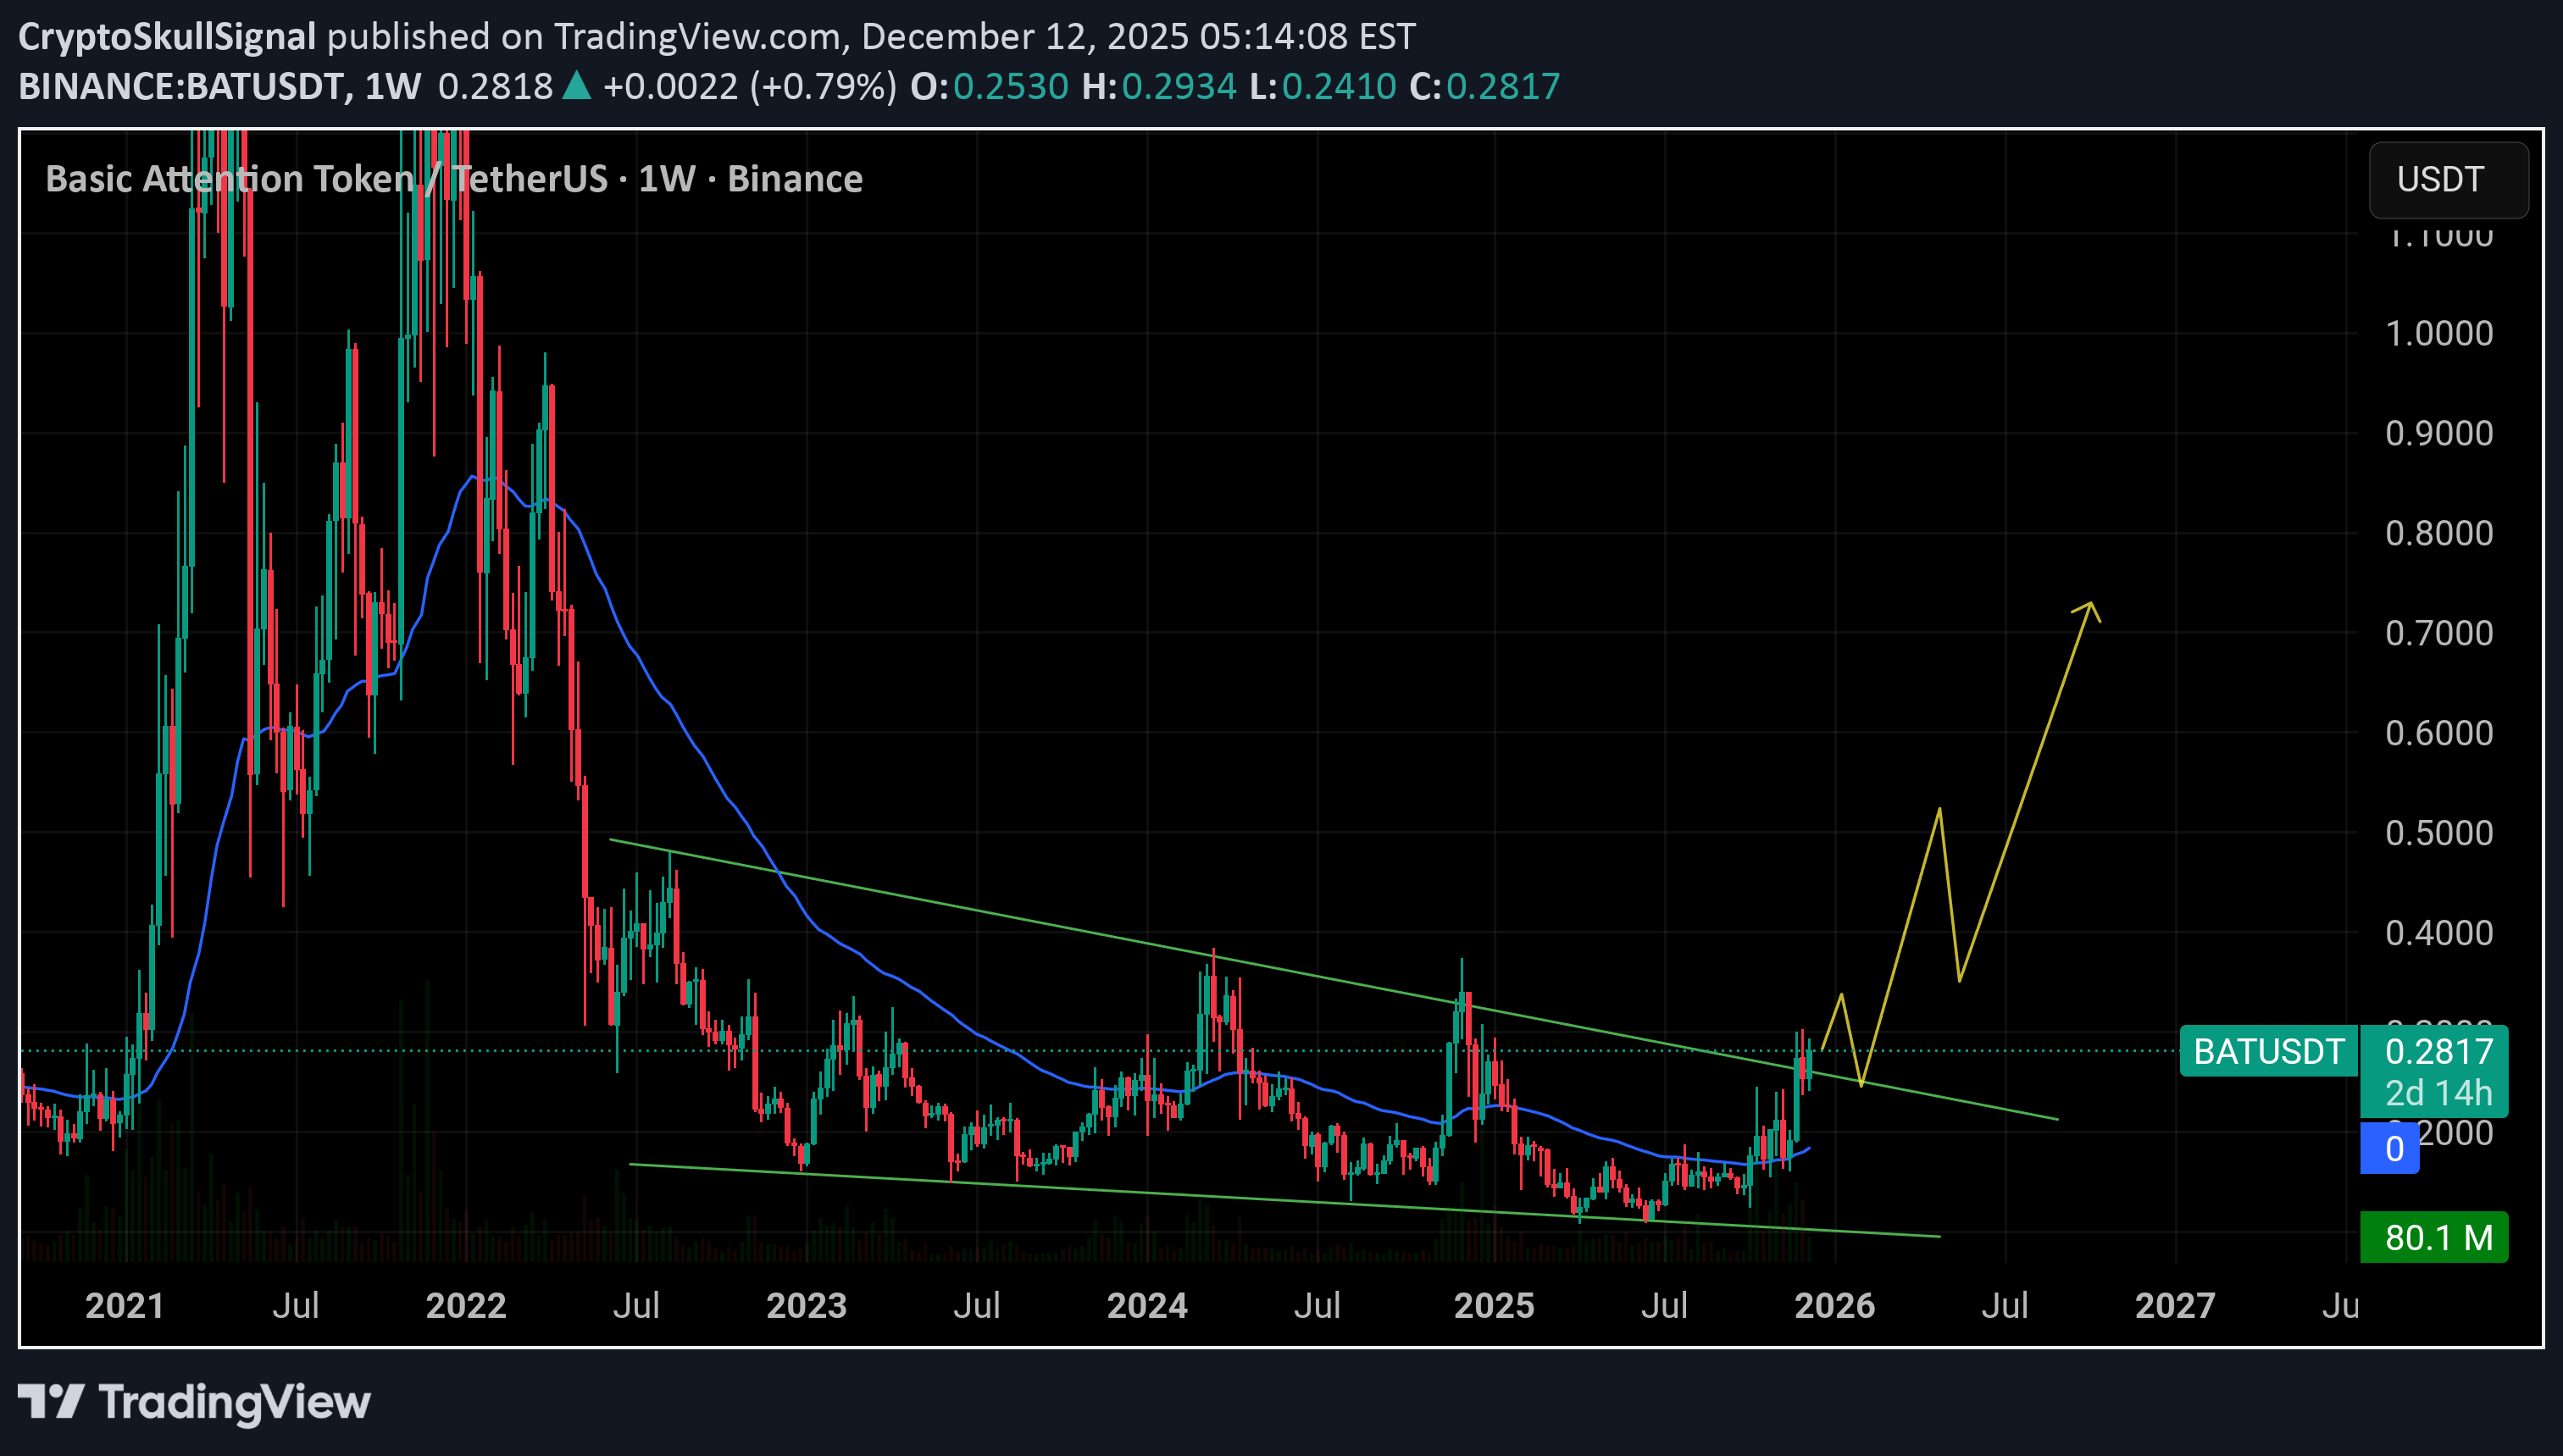
🚨🚨🚨✅ BAT finally pushed through the descending channel and is holding above 0.25. As long as it holds above 0.25, the breakout stays valid and the upside targets stay in play. That level is the line that keeps the momentum alive. If buyers defend it on the next retest, the move can stretch quickly because there isn’t much real resistance until higher levels. This is where patience pays off.
CryptoSkullSignal
بیت کوین درجا میزند! مسیر بعدی BTC صعود ۹۵ هزار دلاری است یا سقوط به ۷۲ هزار؟
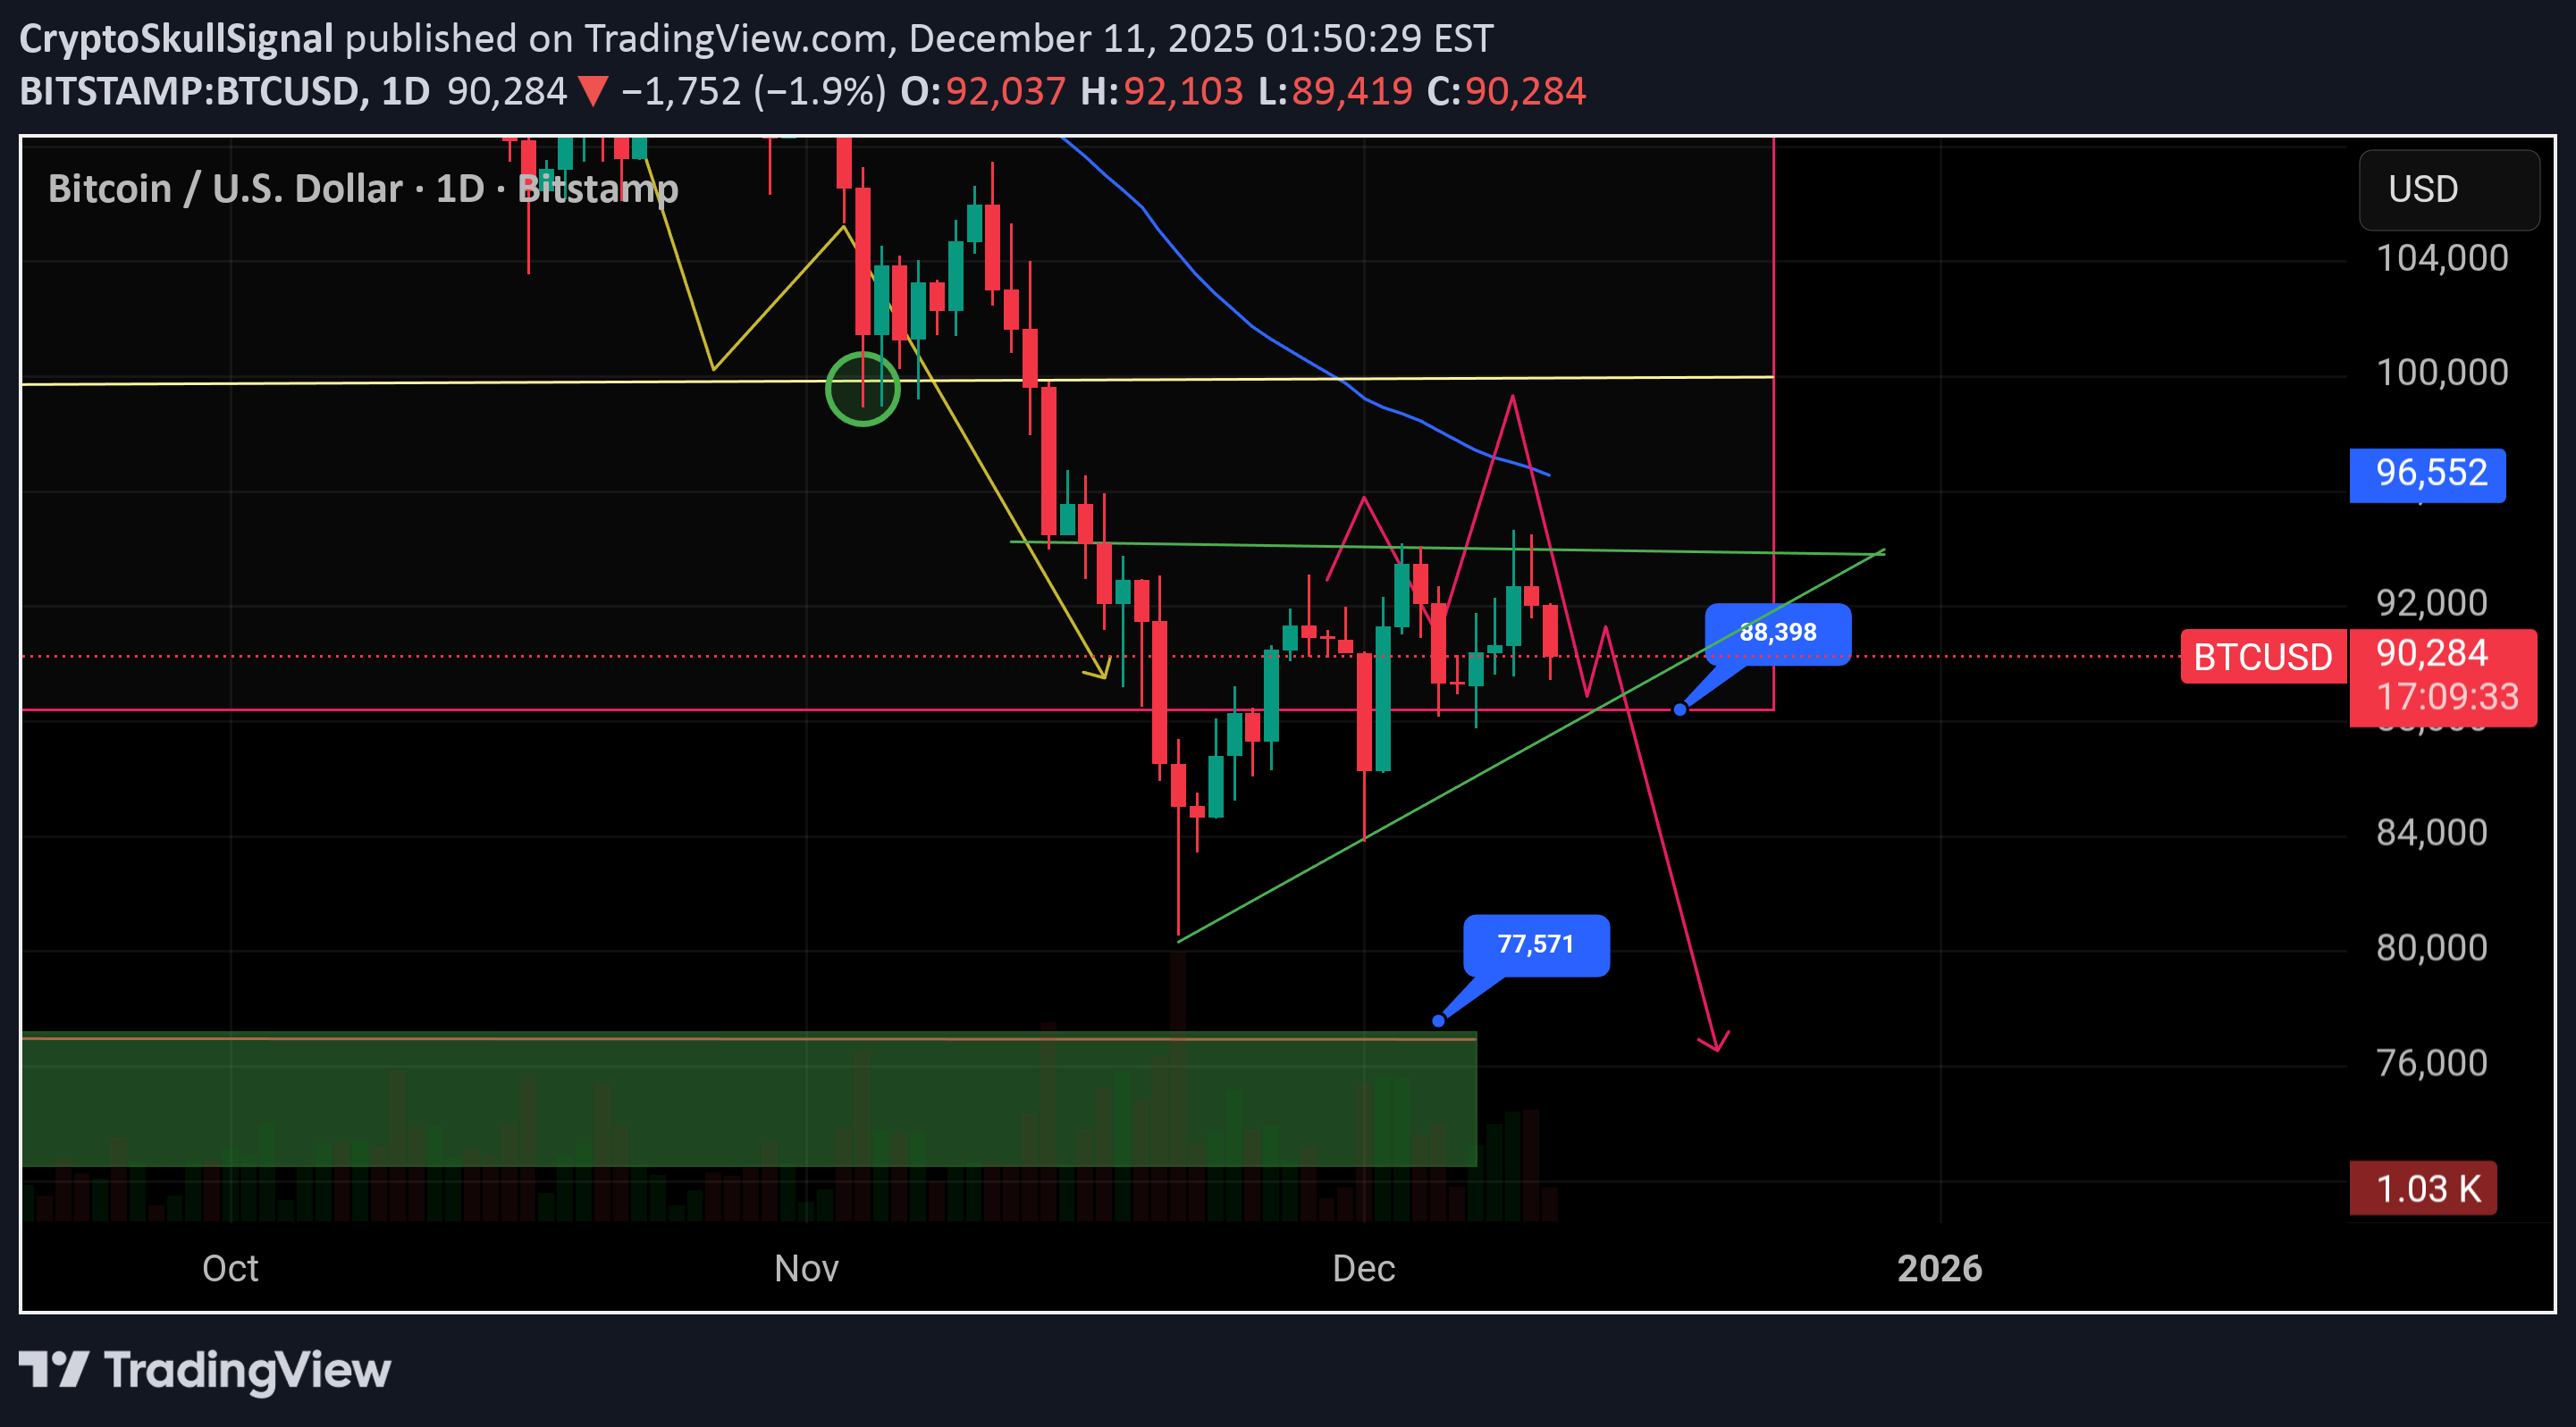
#Bitcoin Mini Update Nothing has changed. BTC is still stuck in the same range, just bouncing between support and resistance without choosing a direction. The structure on the chart is basically a rising wedge forming inside a bigger sideways range, which usually breaks with volatility. If price breaks above the wedge, the same upside target stands: the sweep into 95 to 96k, and if momentum extends, the 99k zone I already mentioned. If it breaks below the wedge, the next target also stays the same: the slide toward 77k first, then the deeper move into the 72k zone. Until BTC picks a side, this is just range trading. Same levels. Same plan.
CryptoSkullSignal
نقطه انفجار NMR: آیا خریداران قیمت را به قلههای ۲۲ تا ۲۵ خواهند رساند؟
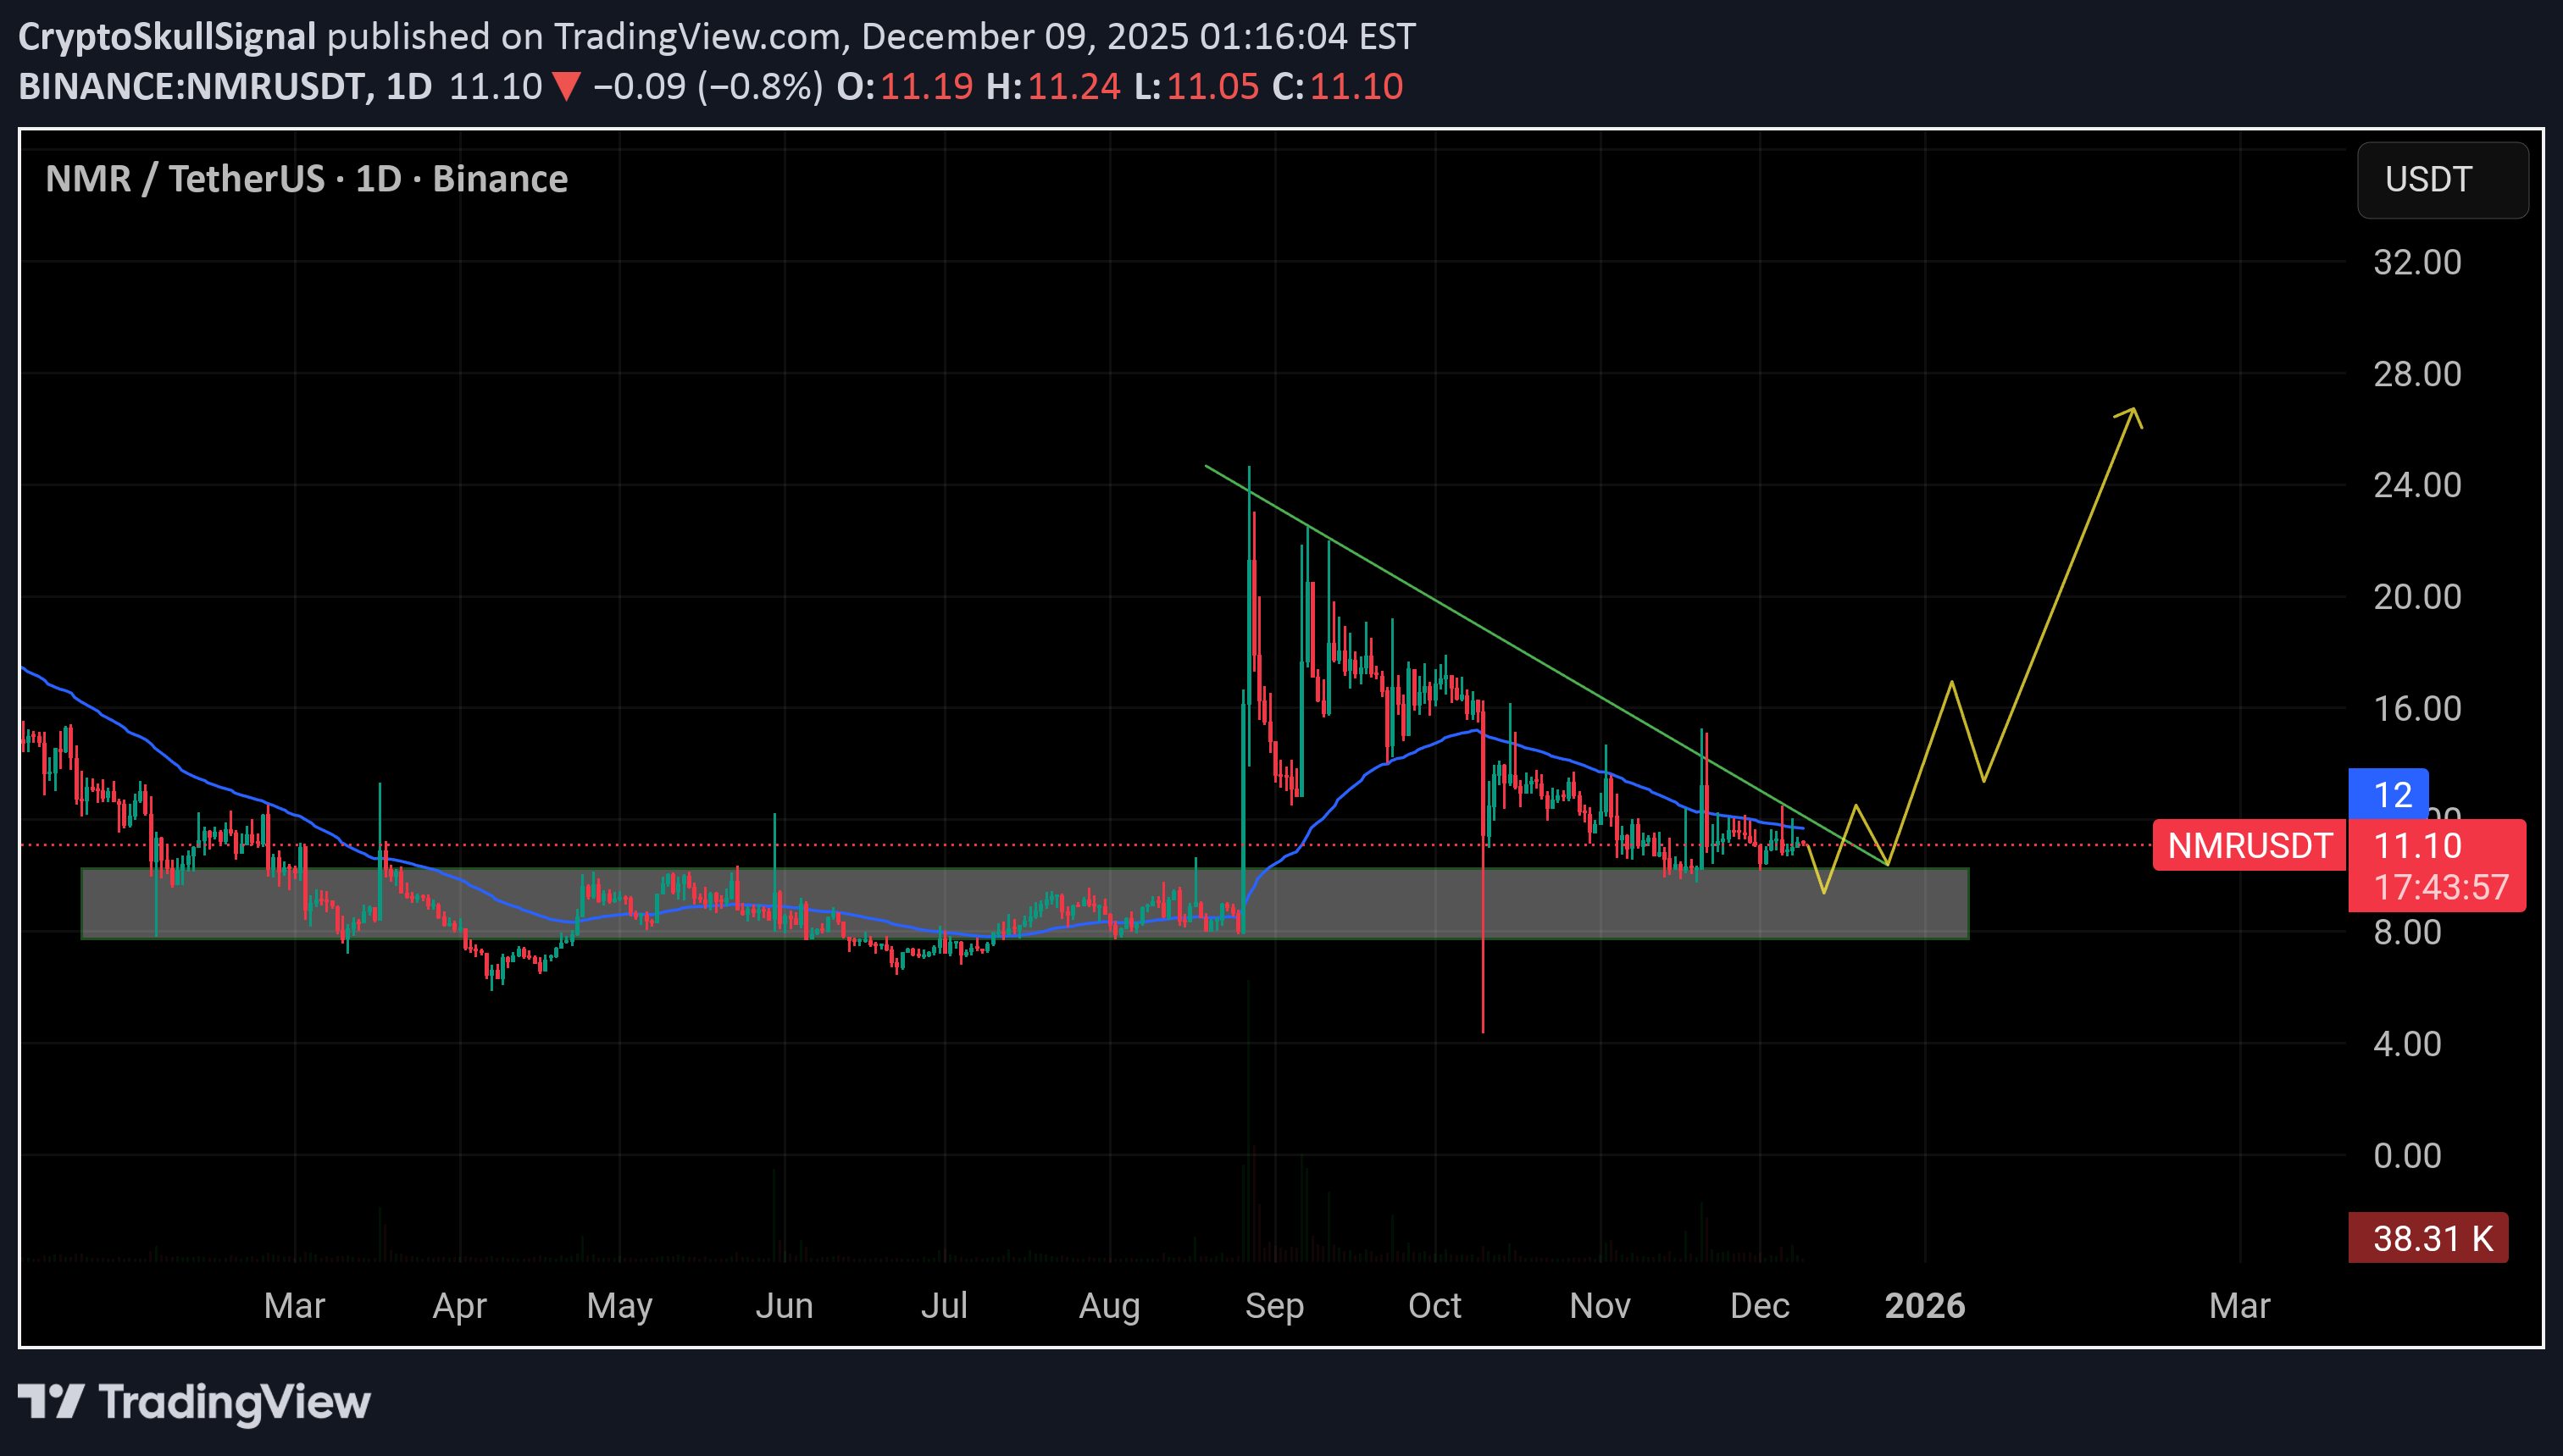
NMR is sitting right on its demand zone and the chart looks primed for a breakout. Price has held this accumulation range for months, and the downtrend line has been losing strength with every retest. If buyers protect this zone and we get a push through the trend line, a break and hold above 12.5 becomes the real trigger. Clear that level and the move toward 22 to 25 can unfold quickly. This setup only needs one strong impulse to flip the entire narrative.
Disclaimer
Any content and materials included in Sahmeto's website and official communication channels are a compilation of personal opinions and analyses and are not binding. They do not constitute any recommendation for buying, selling, entering or exiting the stock market and cryptocurrency market. Also, all news and analyses included in the website and channels are merely republished information from official and unofficial domestic and foreign sources, and it is obvious that users of the said content are responsible for following up and ensuring the authenticity and accuracy of the materials. Therefore, while disclaiming responsibility, it is declared that the responsibility for any decision-making, action, and potential profit and loss in the capital market and cryptocurrency market lies with the trader.